

Abstract
In our previous studies, the effects of effusion and pressure on sound transmission were investigated separately. The aim of this study is to investigate the combined effect of fluid and pressure on middle ear function. An otitis media with effusion model was created by injecting saline solution and air pressure simultaneously into the middle ear of human temporal bones. Tympanic membrane displacement in response to 90 dB SPL sound input was measured by a laser vibrometer and the compliance of the middle ear was measured by a tympanometer. The movement of the tympanic membrane at the umbo was reduced up to 17 dB by the combination of fluid and pressure in the middle ear over the auditory frequency range. The fluid and pressure effects on the umbo movement in the fluid-pressure combination are not additive. The combined effect of fluid and pressure on the umbo movement is different compared with that of only fluid or pressure change in the middle ear. Negative pressure in fluid-pressure combination had more effect on middle ear function than positive pressure. Tympanometry can detect the middle ear pressure of the fluid-pressure combination. This study provides quantitative information for analysis of the combined effect of fluid and pressure on tympanic membrane movement.
Keywords: laser vibrometer, middle ear mechanics, otitis media, temporal bone, tympanometry
INTRODUCTION
Otitis media with effusion (OME) is defined as the presence of fluid in the middle ear and is usually associated with the middle ear pressure change because of poor Eustachian tube function or an inflammatory response following acute otitis media. The amount of effusion in OME patients varied from partially filling the middle ear to fully filling the cavity. The properties of the effusion are highly variable and related to the pathology process of OME. The middle ear effusion is classified as serous, mucoid and glue-like with different viscosities in various pathology processes of OME. The high prevalence of OME and difficulties in diagnosis make the mechanisms behind middle ear function change seen with OME an important issue in hearing research.
Several studies (Goodhill and Holcomb, 1958; Majinma et al., 1988; Ravicz et al., 2004; Gan et al., 2006; Dai et al., 2007) have investigated possible mechanisms of hearing loss associated with the presence of middle ear effusions. Ravicz et al. (2004) suggested that the primary mechanism responsible for hearing loss at low frequencies was the reduction of middle ear compliance by a reduction in the middle ear air volume. The increased mass of the tympanic membrane (TM) by entrained fluid caused the hearing loss at high frequencies. In Gan et al.’s study (2006), the amount of fluid in middle ear was manipulated and the vibration of the TM and stapes were measured with intact and opened cochlea in human temporal bones. The displacement transmission ratio of the TM to footplate was derived and the results show that the effect of fluid on middle ear function is different between three frequency ranges.
The effect of middle ear pressure on TM mobility has been investigated in human temporal bones and animals (Teoh et al., 1997; Lee and Rosowski, 2001; Rosowski and Lee, 2002; Murakami et al., 1997; Dirckx and Decraemer, 1992; Huttenbrink 1998; Gan et al., 2006; Dai et al., 2007). The results of Murakami et al. and Gan et al. show that the middle ear pressure mainly decreased the TM movement at low frequencies (f <1k Hz).
In these published studies, the effects of middle ear fluid and pressure were investigated separately. The literature is lacking evidence that identifies how combined fluid and air pressure in the middle ear affect the middle ear function. In fact, the effusion in patients with OME is commonly associated with negative pressure. We feel that it is important to further investigate the combined effect of pressure and fluid on middle ear function in order to explain the complex mechanisms behind these combined effects.
In this study, we completed three groups of experiments in which the middle ear pressure, fluid, and fluid-pressure combination were manipulated respectively in human temporal bones. Saline solution was selected for simulation of a serous effusion and 0.3 ml was found to be the critical amount of fluid which produced significant changes in umbo displacement in our previous studies of the OME model in human temporal bones (Gan et al., 2006; Dai et al., 2007). In those temporal bones, 0.3 ml fluid filled about half of the middle ear cavity and the fluid level was about to the umbo, which was observed under microscope. The TM (umbo) displacement in response to 90 dB SPL sound input in the ear canal was measured by a laser Doppler vibrometer and the middle ear compliance change under these three conditions was measured by tympanometry.
METHODS
1. Human temporal bone preparation
Four fresh-frozen cadaver temporal bones, obtained through the Willed Body Program, University of Oklahoma Health Sciences Center, were used in this study. The ages of individual donors ranged from 50 to 93 with a mean of 69 years (3 females and 1 male). To retard putrefaction and maintain soft tissue compliance, the bones were immersed in 1:10,000 Merthiolate in 0.9% saline solution at 5° C until use. All bones were used within one week of acquisition.
Before acceptance into the study, each temporal bone was visually inspected under an operating microscope (OPMI-1, Zeiss, Thornwood, NY) to confirm a normal ear canal and an intact TM, and the absence of overt pathology. The 4 bones reported in this paper were all from normal ears without evidence of pathology in the middle ear after the post-experimental check.
The Eustachian tube (ET) meatus was identified at the nasopharyngeal end. The cartilaginous portion of the ET was then bisected and removed up to the boney meatus. A soft silicone tube, outer diameter of 1 mm, with a white tip was then advanced through the remnant of the ET into the middle ear while visualizing the TM with an operating microscope. Once the tip was visualized though the TM, the tube was glued in place at the skull base using cyanoacrylate gel glue (Henkel Consumer Adhesives, Avon, OH). The silicone tube was then connected to a syringe for injecting fluid into the middle ear cavity or adjusting the middle ear air pressure to simulate a middle ear effusion or pressure variation. The second silicone tube (2 mm outer diameter, named the outflow tube) was placed through a hole that was drilled through the epitympanic tegmen, being careful not to touch the ossicles. The tube was glued in place and connected to a syringe and a U-tube manometer through a three-way stopcock as shown in Fig. 1. The manometer was used to measure middle ear pressure and an attached syringe was used to release the middle ear pressure.
Figure 1.
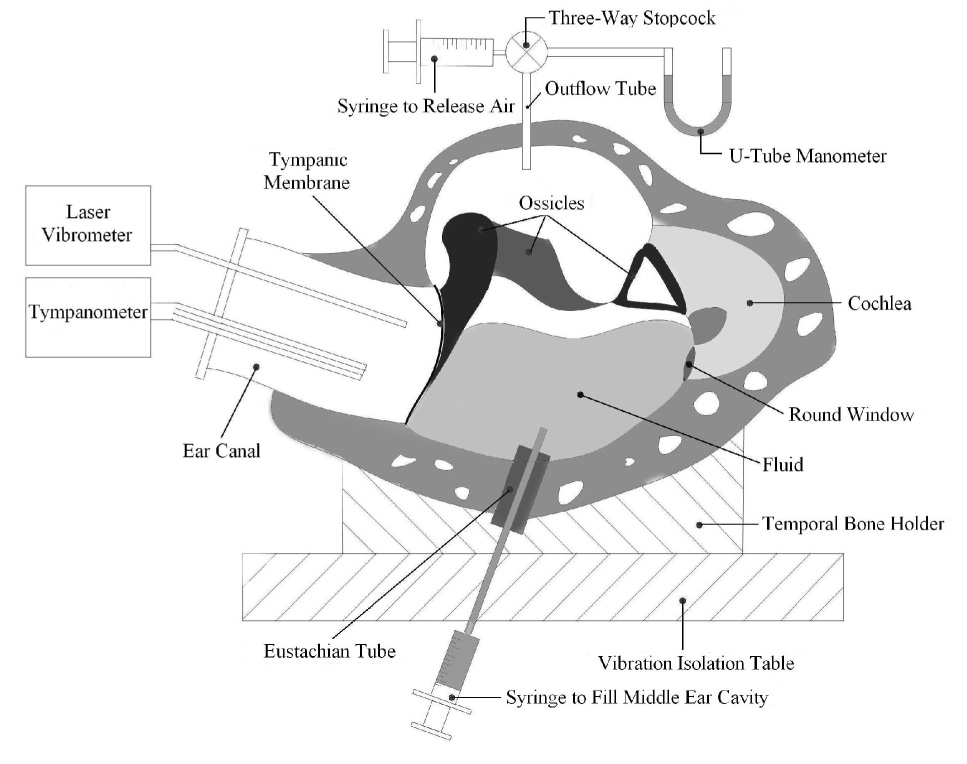
Schematic of the experimental setup with laser vibrometer and tympnometry in human temporal bones.
All surgically opened areas were sealed airtight using cyanoacrylate glue and silicone polymer (Reposil, DDI Inc., Milford, DL). A leaking test was then conducted in every bone using the procedure described by Gan et al. (2006).
After the leaking test, a piece of laser reflective tape of 0.5 mm2 and 0.04 mg (3M Co., St. Paul, MN) was placed as a laser target on the lateral surface of the umbo. The bone was wrapped in wet gauze (normal saline) to prevent desiccation of the specimen during the experiment. Before conducting any laser measurement on temporal bones, we used a tympanometer (Zodiac 901, Madsen, GN Otometrics, Denmark) to verify normal compliance of the tympanic membrane.
After all experiment measurements, a mastoidectomy was performed by a facial recess approach to check the middle ear cavity and mastoid. Among the four mastoids in the temporal bones used in this study, two of them were air-filled, one is diploetic, and the other one was mixed type of the above two. Some fibrous tissues were found near the aditus in two bones with air filled mastoid. No substantial amount of water was found in the mastoid processes of the four bones.
2. Experimental setup with laser vibrometer
Figure 1 shows the temporal bone experimental setup with a laser vibrometer and a tympanometer, which was similar to studies reported by Gan et al. (2006) and Dai et al. (2007). Briefly, the temporal bone was placed in a temporal bone holder and the bone assembly was set on a vibration isolation table. Pure tones at 90 dB SPL from a function generator (Model 193, Wavetek, San Diego, CA) were delivered to the ear canal near the TM by an inserted earphone (Model ER-2, Etymotic Research, ELK, Grove Village, IL). A probe microphone (Model ER-7, Etymotic Research) used for monitoring the input sound pressure level (SPL) was secured parallel to the sound delivery tube and was positioned approximately 2 mm from the umbo (Gan et al., 2001, 2004).
A laser Doppler vibrometer (Model CLV-700, Polytec PI, Tustin, CA) was used to measure the vibration of the TM at the umbo. The helium–neon laser with an associated positioner-aiming prism was coupled to an operating microscope (Model OPMI-1FC, Zeiss). Velocity measurements with the HLV were acquired in the frequency domain by back-weighted averaging of a live, fast-Fourier transform. A fast acquisition, multichannel, digitizing signal analyzer (Model DSA 601, Tektronix, Beaverton, OR) was used for analysis of the spectral magnitude and phase data from the laser vibrometer and all the data were recorded on a personal computer. Only data with a total harmonic distortion of less than 10% of pure tone signals according to the distortion index shown on the signal analyzer were accepted. The peak-to-peak displacement (dp-p) of the umbo was directly calculated from the voltage output of the laser vibrometer velocity decoder by a formula: dp-p = k (Avolt / πf), where Avolt is voltage amplitude in mv, f is frequency in kHz, k is a constant related to selected scale and calibration factor in unit of µm/mv/s (.Gan et al., 2001,2004).
A tympanometer (Zodiac 901, Madsen, GN Otometrics Denmark) with a constant frequency of 226 Hz was used in this study. The detailed tympanometric measurements in human temporal bones were reported by Dai et al. (2007). The tympanogram, a graphic display of acoustic admittance with respect to ear canal pressure variation, provides information about the mobility and integrity of the middle ear using three parameters shown in the tympanogram: static compliance (SC), middle ear pressure (MEP), and tympanometric width (TW). SC refers to the greatest amount of acoustic energy absorbed by the middle ear system presented in the vertical peak of the tympanogram. The MEP refers to the pressure in the ear canal corresponding to the peak of the tympanogram, which is approximately equal to the middle ear pressure. TW refers to the ear canal pressure range corresponding to a 50% reduction in static compliance and presented in daPa (Onusko et al., 2004).
3. Experimental protocols
The temporal bone was oriented approximately as a patient would be seated at a hearing test. The control study in which the middle ear pressure remained at zero with no fluid in the cavity was performed first. Three types of experiments were performed in temporal bones after the control data were acquired. Although the effects of middle ear pressure and fluid alone have been studied by Gan et al. (2006), Groups 1 and 2 experiments of either variable pressures only or constant (0.3 ml) fluid level in the cavity were conducted for comparison with the combined effect of fluid and pressure in Group 3. OME patients commonly have negative pressure in the middle ear; however, we studied both positive and negative pressure changes to try to gain a comprehensive understanding of the effects of pressure changes on middle ear function. Therefore, in our Group 3 experiment, both positive and negative pressures were ombined with fluid to complete the study. Both laser and tympanometry measurements shared the same protocols as follows. In Group 3 experiments, the fluid amount of 0.3 ml was selected because it was reported to be a critical volume of fluid in the middle ear, which caused significant umbo movement change (Gan et al. 2004). In their experiments on temporal bones, the maximum amount of fluid to fill up the middle ear cavity was between 0.6 and 0.7 ml. With 0.3 ml about half of the middle ear cavity was filled, and the fluid level was about to the umbo which was observed microscopically during the experiment. Although such partially filling resulted in smaller decreases in umbo displacement or velocity compared to the decreases observed when the middle ear was completely filled as reported by Gan et al. (2006) and Ravicz et al. (2004), we prefer to use 0.3 ml fluid level as a standard amount of fluid to see the fluid and air combined effect on middle ear function.
Group 1 – Effect of middle ear pressure
The outflow tube was connected to the U-tube manometer. The middle ear air pressure was increased stepwise from 0 to +10, +15, +20, then down to 0, −10, −15, −20 cm H2O (1 cm H2O = 98 Pa), and finally, back to zero using the syringe attached to the ET catheter. Displacement of the umbo was measured at each middle ear pressure level by laser vibrometer and the compliance was measured by tympanometry.
Group 2 – Effect of middle ear fluid
0.3 ml normal saline solution was injected into the middle ear cavity through the ET catheter with the outflow tube open to the atmosphere. The fluid level was maintained in the cavity and visualized through the ear canal using a light microscope. Displacement of the umbo and the compliance of middle ear were measured by laser vibrometer and tympanometry, respectively.
Group 3 – Effect of combination of middle ear fluid and pressure
After the Group 2 experiment, 0.3 ml fluid was kept in the middle ear. The middle ear pressure was increased or decreased from 0 to ± 10, ± 15, and ± 20 cmH2O, respectively. The displacement of the umbo was measured by laser vibrometer and the middle ear compliance change was measured by tympanometer at each pressure level.
RESULTS
Figure 2 shows the mean spectral peak-to-peak displacement of the TM at the umbo measured from 4 temporal bones in three groups with 0.3 ml middle ear fluid or/and positive pressures. The bold solid line is the TM displacement of control or zero fluid and pressure in response to 90 dB sound input in the external ear canal at frequencies of 200~8k Hz. The thin lines without symbols represent the mean curves of TM displacement obtained in Group 1, in which positive air pressure was introduced in the middle ear. The broken bold line shows the mean TM displacement curve of Group 2 (0.3ml middle ear fluid). The lines with symbols show the mean TM displacements curves of Group 3. Results from Group 1 show TM movement decreased mainly at low frequencies (f < 2k Hz) and there was no significant reduction at high frequencies (f > 2k Hz). Note that at frequencies from 6k~8k Hz, the umbo displacement in Group 1 was higher than the control and interestingly, umbo displacement in response to 20 cm H2O middle ear pressure was higher than that in response to 10 cmH2O. In Group 2, the TM displacement was almost the same as the control at low frequencies of 250~450 Hz and decreased significantly at high frequencies (f >1 k Hz). The TM displacements of Group 3 in (thin solid lines with symbols) decreased over all frequencies from the control curve. Compared with Group 1, the umbo displacement reduction in Group 3 was less at low frequencies (f <1k Hz), but significantly more at high frequencies (f >2k Hz). Similar to Group 1, higher middle ear pressure caused more umbo movement reduction at low frequencies (f <1k Hz), but less reduction was observed at high frequencies (f <2k Hz).
Figure 2.
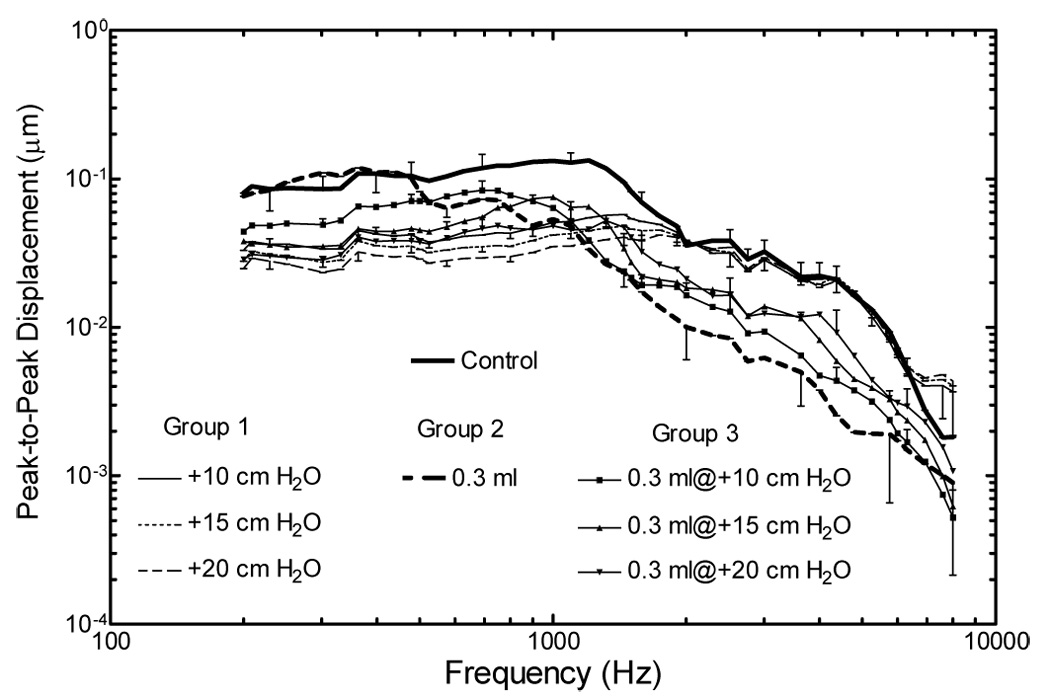
Averaged peak-to-peak umbo displacement measured in four bones using a laser vibrometer in response to 90 dB SPL sound in the ear canal. The curves with standard deviations represent control (bold solid line) and three experimental groups of positive pressure (Group 1, thin lines without symbol), 0.3ml fluid (Group 2, broken bold line) and combined fluid-positive pressure (Group 3, solid lines with symbols).
Figure 3 shows the mean spectral displacement of the TM at the umbo under conditions of fluid or/and negative pressure in the middle ear in Group 1, Group 2 and Group 3. The curves obtained in control and Group 2 are the same as those in Fig. 2. In Group 1, negative middle ear pressures resulted in decreases of umbo movement at low frequencies (f <3k Hz). The negative pressure shifted the umbo displacement peak from 1k Hz at Control to 1.8k Hz. In Group 3, umbo displacement was reduced at all frequencies by the combination of fluid (0.3 ml) and negative pressures. At low frequencies (f <1k Hz), the umbo displacement reduction in Group 3 was less than that in Group 1. However, umbo displacement decreased significantly at high frequencies while no obvious change was observed in Group 1 (f >2k Hz). There are some differences for Group 3 results at high frequencies (f > 2k Hz) between Fig. 1 and Fig. 2. The TM displacements in Fig. 2 decreased a little more than those in Fig.1. Negative pressure had more effect on TM movement than positive pressure.
Figure 3.
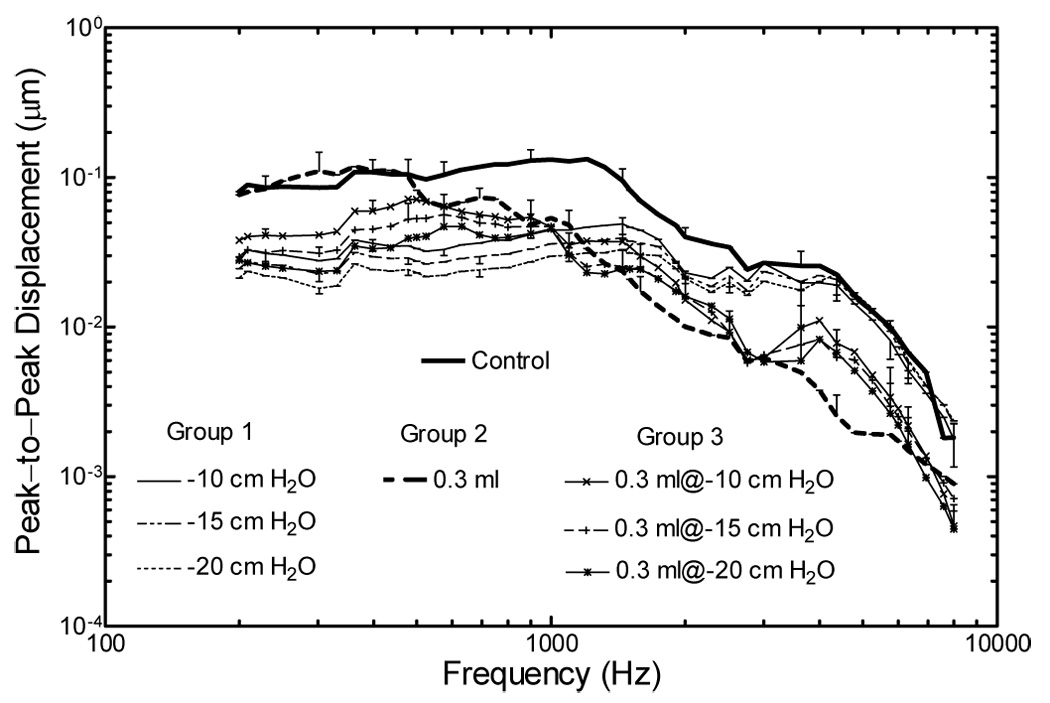
Averaged peak-to-peak umbo displacement measured in four bones using a laser vibrometer in response to 90 dB SPL sound in the ear canal. The curves with standard deviations represent control (bold solid line) and three experimental groups of negative pressure (Group 1, thin lines without symbol), 0.3ml fluid (Group 2, broken bold line) and combined fluid-negative pressure (Group 3, solid lines with symbols).
Figure 4 shows the TM movement changes relative to the control (in dB) derived from the three groups in Fig. 2. Solid lines with hollow symbols represent the umbo displacement magnitude change in response to positive pressure in Group 1. The umbo displacement magnitude change mainly occurred at low frequencies (f <1k Hz) and 20 cmH2O middle ear pressure caused up to 10 dB loss at frequencies below 1k Hz. No significant change was observed at frequencies of 2~6k Hz and the displacement magnitude increased at frequencies > 6k Hz. In Group 2 (bold solid line), umbo displacement magnitude increased slightly to about 2 dB at 300 Hz and decreased significantly up to 12~19 dB loss at high frequencies (f >1k Hz). In Group 3 (solid lines with solid symbols), umbo displacement magnitude decreased across all frequencies of 200~8k Hz. At low frequencies (f <1k Hz), 0.3 ml fluid combined with 10 cmH2O middle ear pressure caused 3 to 5 dB loss while 0.3 ml fluid and 20 cmH2O pressure caused 5 to 10 dB loss. At frequencies of 4~5k Hz, 0.3 ml fluid combined with 10–20 cmH2O middle ear pressure caused 7~12 dB reduction of the umbo displacement. At low frequencies (f < 1000 Hz), TM movement decreased more in Group 1 than that in Group 3. At high frequencies (f > 2k Hz), TM displacement decreases in Group 3 are more than that in Group 1 and less than that in Group 2
Figure 4.
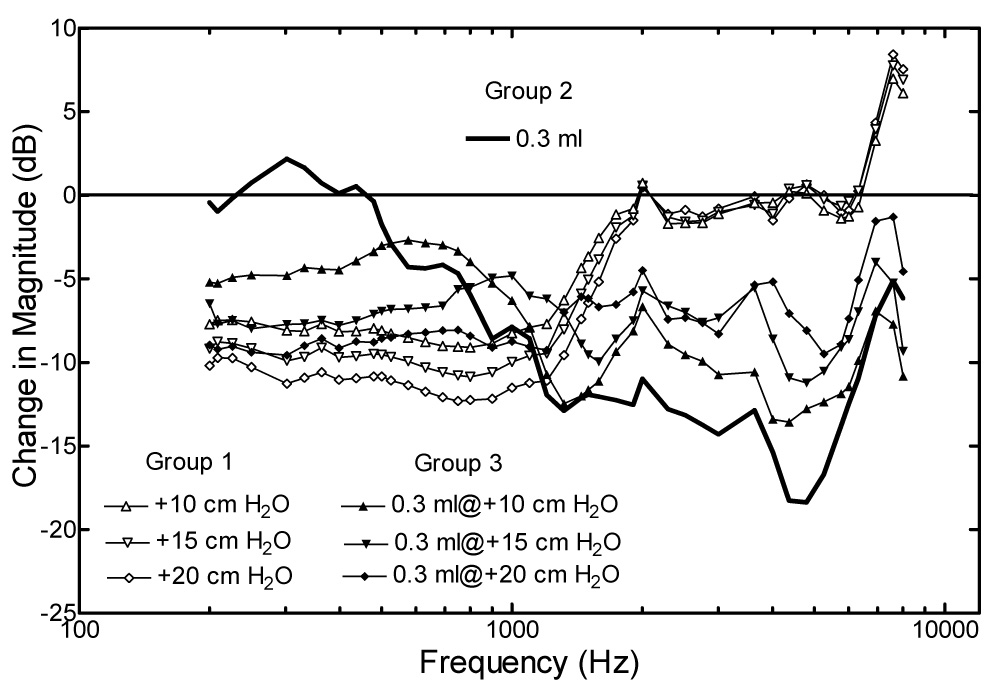
Averaged changes of umbo displacement magnitude in dB measured from three experiments in the three groups of positive pressure (Group 1, solid lines with hallow symbols), 0.3ml fluid (Group 2, bold solid line) and combined fluid-positive pressure (Group 3, solid lines with filled symbols).
The results in Figure 5 were derived from Figure 3 and display the change of TM (umbo) displacement magnitude related to the control data in the three experimental groups. Similar to Figure 4, significant umbo displacement reduction occurred at low frequencies (f < 1k Hz) in Group 1, when negative pressures were induced in the middle ear. A 14 dB reduction was observed at low frequencies when the middle ear pressure reached −20 cm H2O. At the high frequencies (1~3k Hz), the umbo displacement reduction was smaller than that at low frequencies. A slight increase in umbo displacement magnitude occurred at frequencies of 7k~8k Hz. In Group 3, the combination of fluid and negative pressures reduced umbo displacement at all frequencies tested. Fluid combined with −20 cmH2O middle ear pressure caused 6~11 dB loss at low frequencies (200~500 Hz) and a maximum of 14 dB loss at 2.7k Hz. Umbo displacement changes in Group 1 and 3 in Figure 5 at high frequencies were larger than those in Figure 4.
Figure 5.
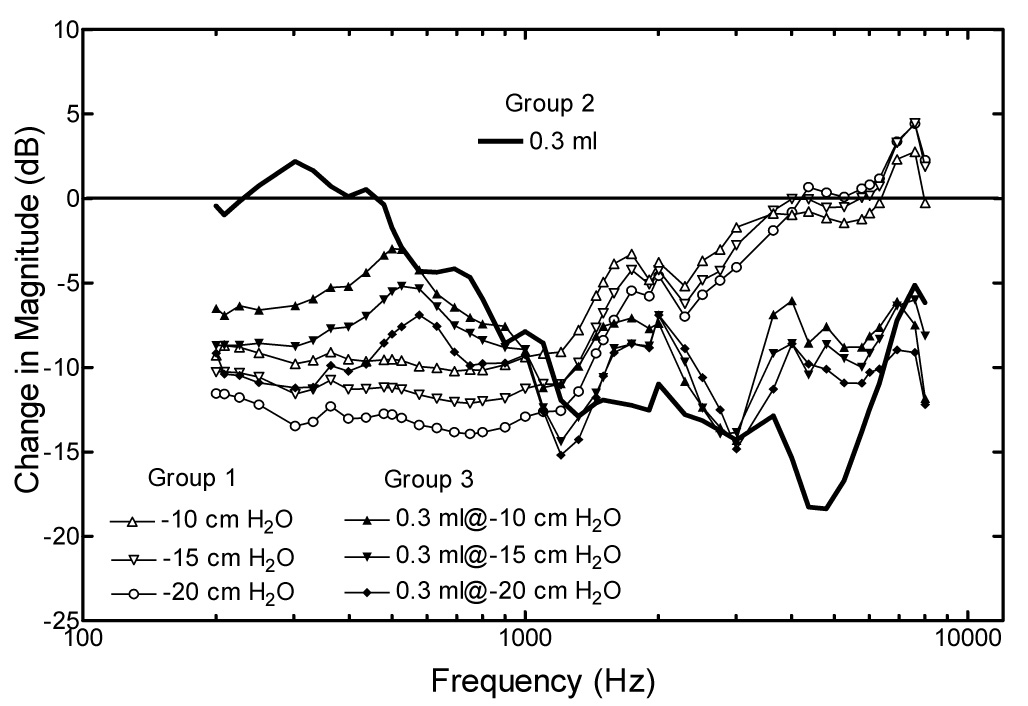
Averaged changes of umbo displacement magnitude in dB measured from three experiments in the three groups of negative pressure (Group 1, solid lines with hallow symbols), 0.3ml fluid (Group 2, bold solid line) and combined fluid-negative pressure (Group 3, solid lines with filled symbols).
Figure 6 shows the tympanometric results of middle ear pressure (MEP), static compliance (SC) and tympanometric width (TW) under control and three experimental groups. Figure 6A illustrates that the tympanometric MEP values are almost equal to the middle ear air pressure directly read from the manometer (1 cm H2O ≈ 10 daPa) in all tested ears. Figure 6B shows the mean SC (in ml) values for Control and experimental Groups. The Control SC value was about 0.58 ml and the SC value decreased slightly to 0.41 (still in normal range) when the middle ear pressure increased to 20 cmH2O in Group 1. The mean SC value in Group 2 was 0.52 ml, almost equal to the Control value. In Group 3, the SC values (hollow squares) decreased slightly when 0.3 ml fluid combined with +10, +15 and +20 cmH2O air pressures was induced into the middle ear. Figure 6C shows the TW changes in Control and experimental groups. The TW value (in daPa) was about 80 in control. No significant change was observed in Group 1 (hollow triangle) or Group 2 (circle). The TW value increased when fluid combined with negative pressures was introduced in the middle ear.
Figure 6.
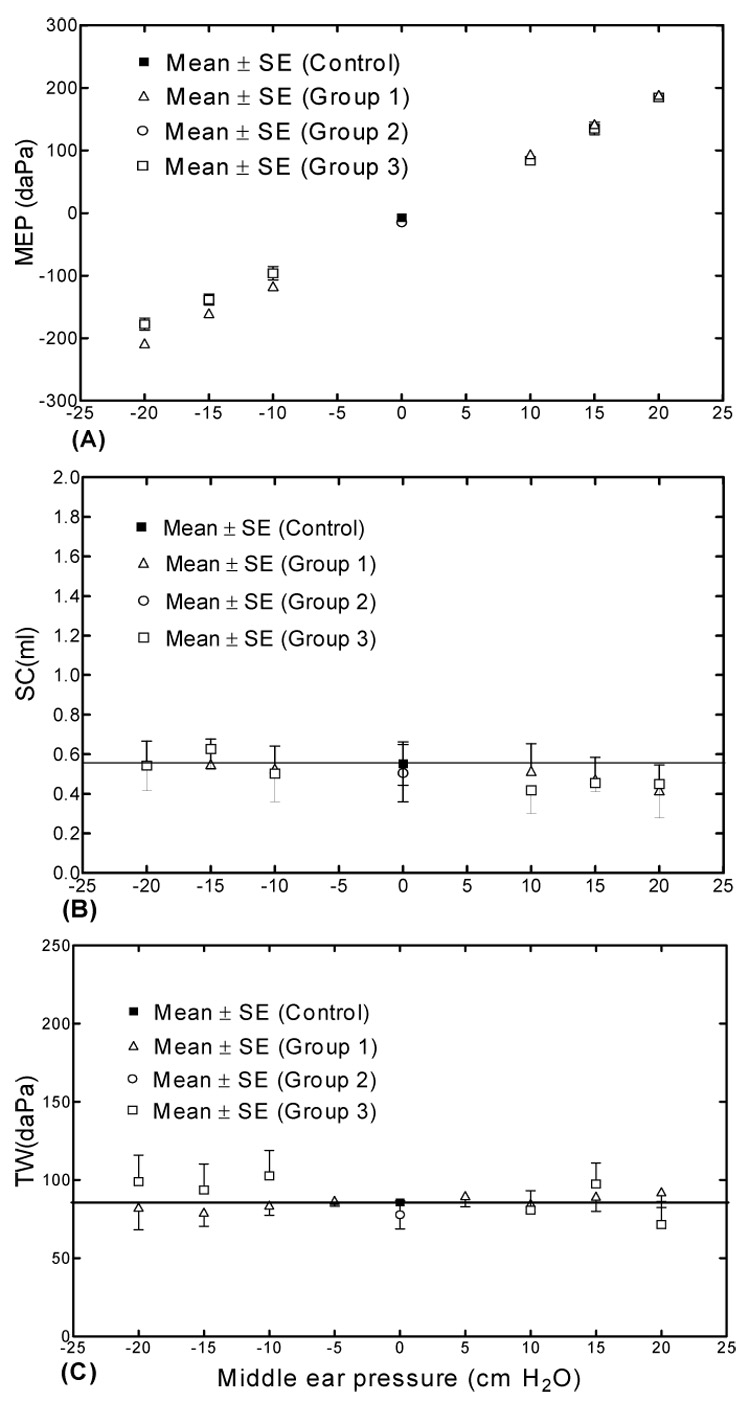
Averaged tympanometric data in response to variation of pressure and fluid in control and three experimental groups. A. Middle ear pressure (MEP) data in daPa, B. Static compliance (SC) data in ml, C. Tympanometric width (TW) data in daPa.
DISCUSSION
1. Summary of Results and Comparison with Published Data
Results of this study show that the umbo movement was reduced by a combination of fluid and pressure at all frequencies. At low frequencies (f < 1k Hz), the TM movement reduction caused by the combination of middle ear fluid and pressure (Group 3) was higher than that by middle ear fluid alone (Group 2), but less than that by middle ear pressure alone (Group 1). At high frequencies (f> 2k Hz), the umbo displacement reduction by the combination of fluid and pressure was more significant than that by middle ear pressure alone, but less significant than that by middle ear fluid alone. The results also show that the combination of fluid with negative pressure had more effect on umbo movement than positive pressure. This indicates that the influence of negative and positive pressure in combination with fluid in the cavity on TM movement is not the same.
The tympanometric results show that the MEP can predict the middle ear pressure changes with the combination of fluid and pressure. No significant change of middle ear static compliance (SC) as middle ear pressure changes (Fig. 6 B) does not mean the middle ear compliance is independent of pressure. However, this indicates that the primary reason for the change in compliance is a change in middle ear static pressure as measured by laser Doppler vibrometer in temporal bones with zero ear canal pressure. The fluid has little effect on the tympanometric static compliance (Fig. 6), which is consistent with the umbo displacement measurement at low frequency (i.e., 200 Hz) shown in Fig. 4 and Fig. 5. The introduction of positive or negative middle ear pressure shifts the tympanogram peak to the right or left and reduces compliance at zero ear canal pressure. This is consistent with the umbo displacement measured in temporal bone in Fig. 4 and Fig. 5, and reported by Dai et al. (2007) in previous study. In the clinical setting, the tympanograms of OME patients are flat without a tympanometric peak. The tympanometric peak shown in the measurements in the experimental partially filled ears indicates the artificial conditions which is different from the measurements in OME patients. However, tympanograms from patients with air/fluid levels often show a slight peak.
The experimental data measured from 4 temporal bones in this study was first compared with the results reported by Gan et al. (2006) from 7 bones when the middle ear pressure was varied or 0.3 ml of saline was infused into the middle ear cavity (Figure 3 and Figure 9 in Gan et al.’s paper, 2006). As can be seen in Figure 7, the displacement curves obtained in this study at control (without fluid and zero middle ear pressure), 0.3 ml fluid in the cavity (Group 2), and ±20 cm H2O of middle ear pressure (Group 1) are in good agreement with Gan et al’s (2006) results. This indicates our experimental setup was reliable for the fluid-air pressure combination study.
Figure 7.
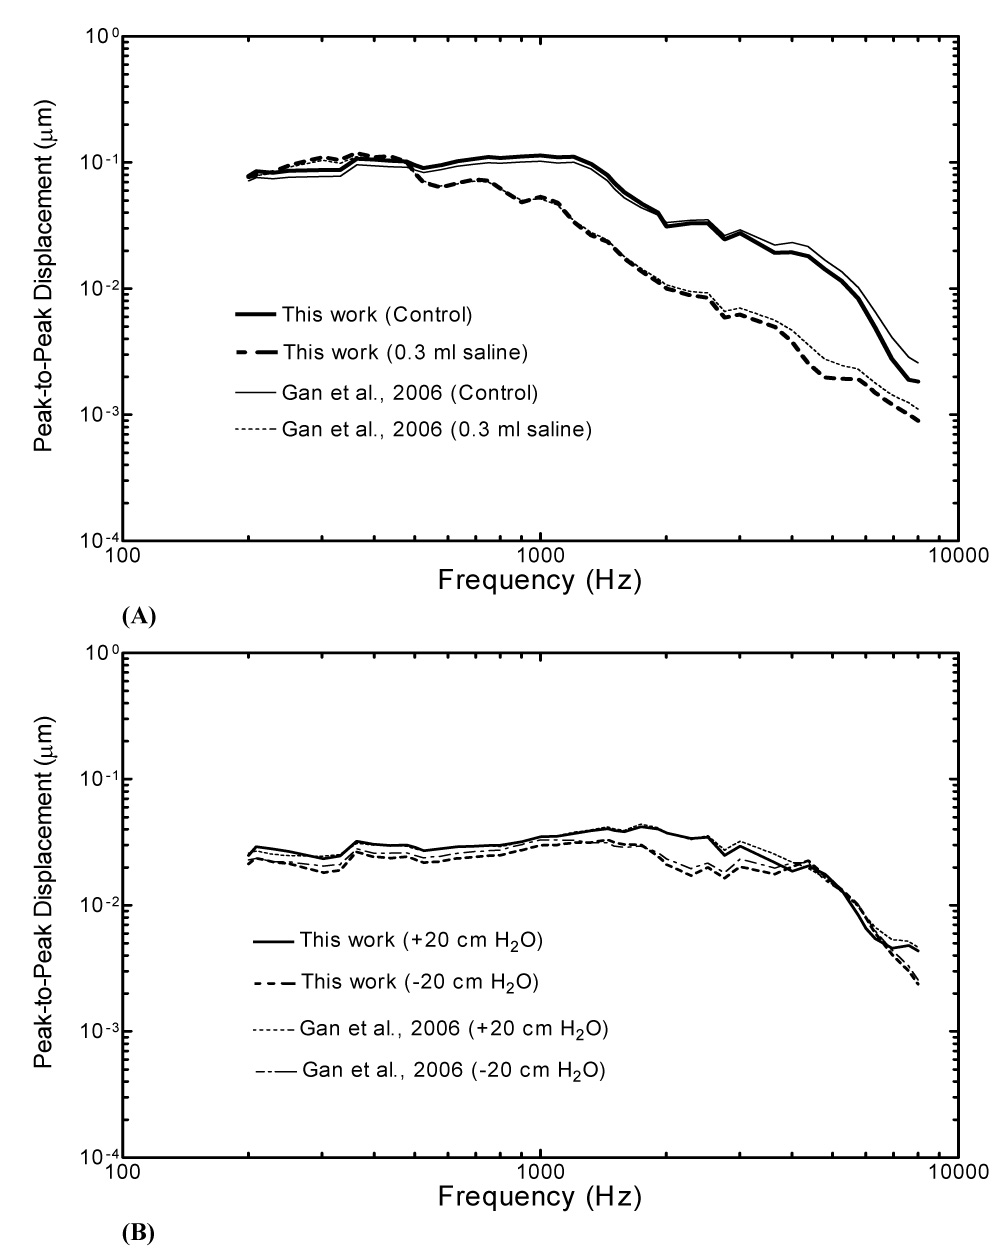
Comparison of the data obtained from this study with the published results by Gan et al. (2006). A. Umbo displacements measured in control and filled with 0.3 ml saline in the middle ear cavity (Group 2). B. Umbo displacements measured in bones with middle ear pressure of +20 cm H2O and −20 cm H2O, respectively.
Furthermore, we compared the results from our Group 2 in this present study with the results from comparable studies by Ravicz et al. (2004). The frequency range covered by Ravicz et al. was up to 3k Hz while the current study measured up to 8k Hz. There were some variations between our data and Ravicz et al.’s (2004) results, but the measurements reported here generally agree with the data obtained by Ravicz et al.
The effect of graded variations in middle ear pressure on umbo movement in human temporal bones was also reported by Murakami et al. (1997). They used a video measuring system to detect umbo displacement when a constant sound pressure of 134 dB was delivered at the TM across the frequency range of 200 to 3.5k Hz. In our Group 1 experiment of middle ear pressure, the umbo displacement had a significant reduction at frequencies below 1.5k Hz which is similar to Murakami et al.’s results.
The experimental measurements (Group 3) were compared with clinical data and are illustrated in Figure 8. Pure tone air and bone conduction audiometric thresholds at standard frequencies (0.25, 0.5, 1, 2, 4 kHz) were obtained from 30 OME patients in the private clinical practice of Dr. Mark Wood (co-author). The 30 patients were diagnosed with OME by otoscopy and tympanometric acoustic reflex testing in a sound booth. The averaged age of the 30 patients was 56 years old ranging from 23 to 72 (14 male and 16 female). Figure 8A shows the averaged air-bone gap data from the 30 patients who had middle ear effusions examined by the pneumatic otoscopy. None of the patients had other middle ear pathology or a history of ear surgery, and none of the middle ear effusions were associated with clinical signs of infection. All patients complained of acute or sub-acute hearing loss (3 weeks to 3 months) and most of the tympanic membranes appeared to be retracted. None of the middle ears had bubbles or observable air-fluid levels, thus it was concluded that the middle ear was filled with fluid.
Figure 8.
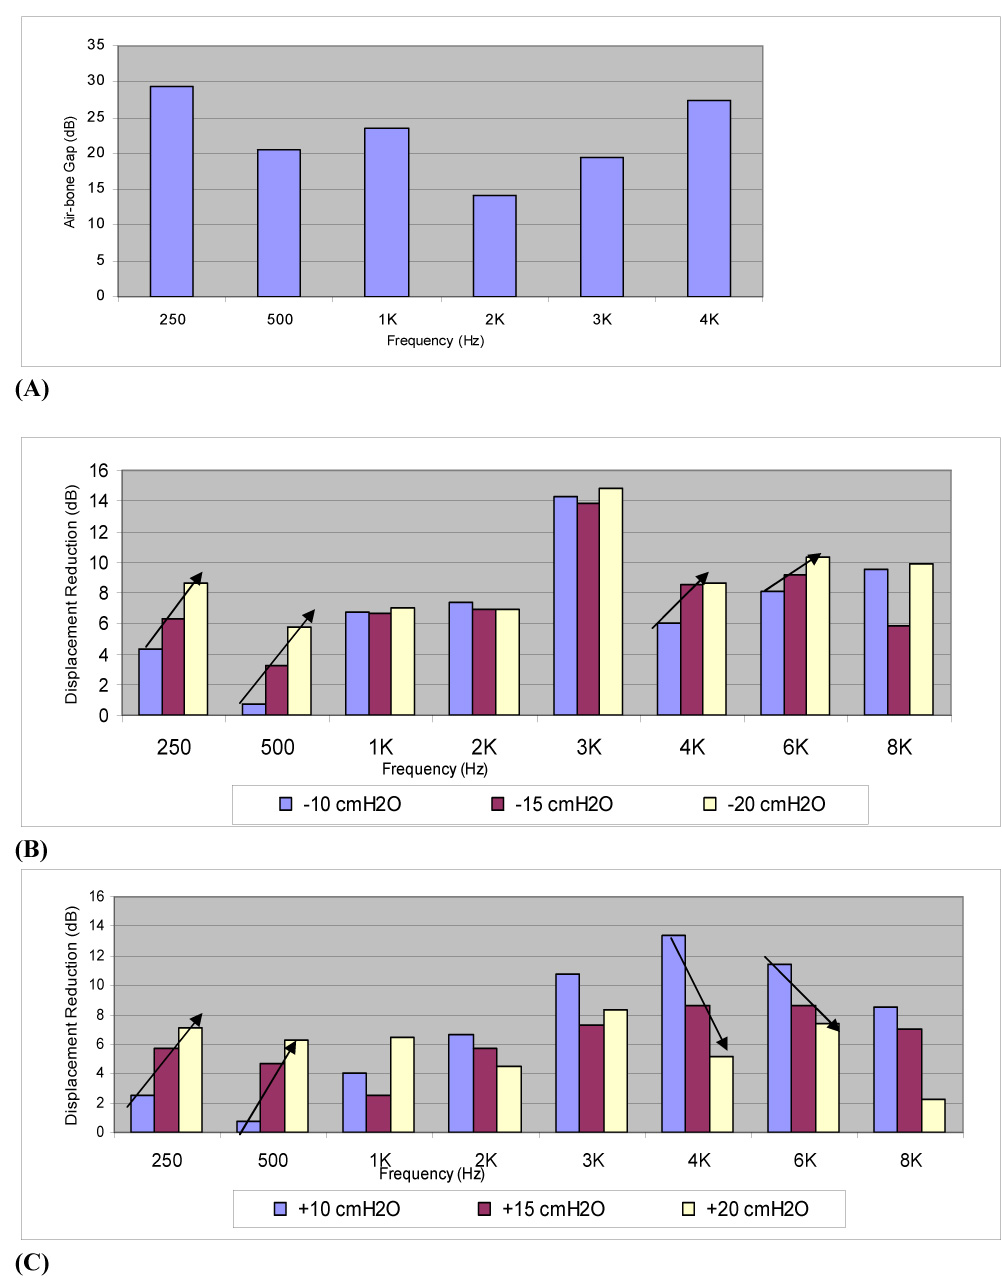
Air-bone data obtained from 30 OME patients and umbo displacement reduction measured from temporal bones in Group 3 experiments. Mean air-bone gap data from 30 OME ears at frequencies of 250, 500, 1k, 2k, 3k and 4k Hz. B. Data extracted from Group 3 results of Fig. 5 (combined fluid and negative pressure) at frequencies of 250, 500, 1k, 2k, 3k, 4k, 6k, and 8k Hz. C. Data extracted from Group 3 results of Fig. 4 (combined fluid and positive pressure) at frequencies of 250, 500, 1k, 2k, 3k, 4k, 6k, and 8k Hz.
Figure 8A shows the hearing loss in the OME patients is higher at 250 Hz and 4k Hz than that at 500, 1k, 2k or 3k Hz. This change was similar to the displacement reduction shown in Figure 8B and Figure 8C (0.3 ml fluid and ±20 cm H2O combination) except that the air-bone gap was highest at 250 Hz and the highest reduction in our temporal bones occurred at 3k Hz. The averaged conductive hearing losses collected from 30 OME patient ears were larger than the umbo displacement reduction measured from temporal bones. These clinical findings differ from the results of temporal bones (Figure 8B and Figure 8C) and those of Gan et al. (2006) and Ravicz et al. (2004) in the amount of low frequency conductive hearing loss that is recorded in the clinical setting. These differences may reflect the small amount of fluid volume that was used in this experimental setup, the chronicity of the fluid noted in our clinical patients, the possible effects of viscosity, inflammation and pressure differences which are not measurable within the scope of the clinical setting. Other effects which may result in more low frequency loss in the clinical setting include chronic effects on the tympanic membrane, such as stretching, entrained fluid or thickening of the inner membranous layer and the possibility of effects on the ossicular chain. However, Figure 8A shows the OME patients have about 27 dB loss at high frequencies (4k Hz) and that is similar to the results of Gan et al. (2006) when the temporal bone model was filled with fluid. The similar results between a filled middle ear cavity and clinical OME patients indicate that the fluid was the primary cause of hearing loss in OME patients and this was verified by recovery of hearing loss when the fluid was drained in these patients.
The volume of the tympanic cavity in humans ranges between 0.5 and 2 ml. The maximum volumes were found to be 0.6~0.7 ml in the post-experiment check of the four bones used in this study. In this experimental setup, the fluid amount of 0.3 ml was selected since it was the critical amount that caused significant umbo movement change in the previous study reported by Gan et al. (2006). In this preliminary study for understanding the effect of fluid and pressure combination on umbo movement, the selected 0.3 ml fluid volume in the middle ear might also show some critical effect on middle ear function. In fact, the results obtained from Group 3 show that 0.3 ml is most sensitive to the umbo movement reduction. However, we realized that partially filling the temporal bones does not predict the hearing loss from patients who have hearing levels consistent with completely filled ears. It is similar to the work of Ravicz et al. (2004) in which they provided a good model for hearing loss in patients with fluid filled middle ears, but not good for assessing hearing loss in patients with partially filled middle ear. So it is not surprising that in the present study, which partially filled the middle ear cavity, the model did not demonstrate the same amount of hearing loss as is seen in patients who had completely filled middle ears (Figure 8). In future temporal bone studies, larger amounts of fluid will be used in the middle ear along with pressure to simulate OME in the clinical setting.
2. Possible Mechanism of Combined Effect on Middle Ear Function
At low frequencies, the umbo displacement reduction by the combination of middle ear fluid and pressure was less than that by pressure alone (Figure 2–Figure 5). One possible explanation is the combined changes of TM stiffness with the fluid and air pressure in the middle ear. Stiffness of the TM increased when the middle ear pressure increased and the mobility of the umbo was decreased at low frequencies, where the stiffness of the TM dominated its motion. According to the report by von Unge et al. (1995), OME seems to decrease the stiffness of TM promptly and it may relate to the edema. When fluid was present in the middle ear and attached to the TM, the water entrained in TM may result in the stiffness decrease of the TM. Thus, the stiffness of the TM in fluid-pressure combination was lower than that in pressure alone case, and the displacement reduction of the umbo was accordingly lower in fluid-pressure combination case (Group 3). Ravicz et al’s (2004) study indicated that a fluid-related reduction in middle ear compliance due to a reduction in middle ear air volume was another possible explanation for the reduction at low frequencies. At low frequencies, changes of movement of the umbo is compliance-dominated in the normal state and continues to be compliance-dominated as the middle ear air volume is changed by fluid (Ravicz et al. 2004).
At high frequencies, the displacement reduction of the TM was mainly caused by fluid in the middle ear as reported by Gan et al. (2006). The main mechanism behind this reduction seemed to be the increased TM mass by entrained fluid. Compared with middle ear fluid alone, the reduction of umbo displacement by fluid-pressure combination was smaller. This observation reflects the influence of middle ear pressure on umbo displacement reported by Gan et al. (2006) and shown in Fig. 2 and Fig. 3 of present study. The peak frequency of the displacement curve was shifted toward the high frequencies when middle ear pressure was changed, which helped to release the displacement reduction at high frequency. Thus, the mobility of the umbo in fluidpressure combined state was lightly better than the fluid only case at high frequencies.
The laser measurements displayed in Figure 4, Figure 5 and Figure 8 show some differences between positive and negative pressure effects on TM or umbo movement. For example, 0.3 ml middle ear fluid combined with −20 cm H2O pressure caused 12 dB loss at 300 Hz and 15 dB at 3k Hz while 0.3 ml fluid with +20 cm H2O pressure caused 9 and 11 dB at the 300 Hz and 3k Hz respectively. The reason for more reduction by negative pressure in the fluid-pressure combination may be due to the air volume change in the middle ear cavity in response to pressure variation. Positive middle ear pressure increases the tympanic space air volume by pushing the TM laterally and negative pressure decreases this volume by retracting the TM medially. This phenomenon was similar to the observation by Murakami et al. (1997). Calculated from the data in Fig. 2 and Fig. 3, the increased cavity volume by 20 cm H2O pressure was about 0.005 ml, about 0.9% of the whole normal middle ear cavity, and −20 cm H2O pressure only caused 0.6% middle ear cavity decrease. Thus, the small difference of the TM motion between positive and negative pressures may not completely, but slightly relate to the small cavity volume change by middle ear pressure. At low frequencies of 250 and 500 Hz, the umbo displacement reduction (Figures 7B and 7C) increased when the pressure in the middle ear varied from ±10 to ±15 and ±20 cm H2O. At frequencies of 4k and 6k Hz, the umbo displacement reduction increased as the pressure varied from −10 to −15 and −20 cm H2O (Figure 7B) while the umbo displacement reduction decreased as pressure changed from 10 to 15 and 20 cm H2O. A possible explanation for the different effect of negative and positive pressure is the geometric changes of the TM induced by different pressure variations.
CONCLUSSION
Both laser interferometry and tympanometry were used to detect the combined effects of fluid and pressure changes on middle ear function. The combination of fluid and pressure reduced the TM (umbo) movement at all audible frequencies tested. The fluid and pressure effects on the umbo movement are not additive in the fluid-pressure combination. The combined effect of fluid and pressure on TM movement is different from that of fluid or pressure only in the middle ear. The negative pressure in the fluid-pressure combination has more effect on umbo movement than that of positive pressure. Tympanometry can detect the middle ear pressure of the fluid-pressure combination. This study provides useful, quantitative information for analysis of the combined effect of fluid and pressure on TM movement. The mechanism behind TM movement reduction by a combination of middle ear fluid and pressure variations needs further studies.
ACKNOWLEDGMENTS
This work was supported by NIH/NIDCD Grant R01DC006632. The authors thank Don Nakmali at Hough Ear Institute for his expert technical help.
Footnotes
Publisher's Disclaimer: This is a PDF file of an unedited manuscript that has been accepted for publication. As a service to our customers we are providing this early version of the manuscript. The manuscript will undergo copyediting, typesetting, and review of the resulting proof before it is published in its final citable form. Please note that during the production process errors may be discovered which could affect the content, and all legal disclaimers that apply to the journal pertain.
REFERENCES
- Dai C, Wood MW, Gan RZ. Tympanometry and laser Doppler interferometry measurements on otitis media with effusion model in human temporal Bones. Otol. Neurotol. 2007;28(4):551–558. doi: 10.1097/mao.0b013e318033f008. [DOI] [PubMed] [Google Scholar]
- Dirckx JJJ, Decraemer WF. Area change and volume displacement of the human tympanic membrane under static pressure. Hear. Res. 1992;62:99–104. doi: 10.1016/0378-5955(92)90206-3. [DOI] [PubMed] [Google Scholar]
- Gan RZ, Dai C, Wood MW. Laser interferometry measurements of middle ear fluid and pressure effects on sound transmission. J Acoust Soc Am. 2006;120(6):3799–3810. doi: 10.1121/1.2372454. [DOI] [PubMed] [Google Scholar]
- Gan RZ, Dyer RK, Wood MW, Dormer KJ. Mass loading on ossicles and middle ear function. Ann. Otol. Rhinol. Laryngol. 2001;110:478–585. doi: 10.1177/000348940111000515. [DOI] [PubMed] [Google Scholar]
- Gan RZ, Wood MW, Dormer KJ. Human middle ear transfer function measured by double laser interferometry system. Otol. Neurotol. 2004;25:423–435. doi: 10.1097/00129492-200407000-00005. [DOI] [PubMed] [Google Scholar]
- Goodhill V, Holcomb AL. The relation of auditory response to the viscosity of tympanic fluids. Acta Otolaryngol. 1958;49(1):38–46. doi: 10.3109/00016485809134725. [DOI] [PubMed] [Google Scholar]
- Huttenbrink KB. The mechanics of the middle-ear at static air pressure. Acta Otolaryngol. (Stockh) 1998;451 suppl:1–35. doi: 10.3109/00016488809099007. [DOI] [PubMed] [Google Scholar]
- Lee C-Y, Rosowski JJ. Effects of middle-ear static pressure on pars tensa and pars flaccida of gerbil ears. Hear. Res. 2001;153:146–163. doi: 10.1016/s0378-5955(00)00269-0. [DOI] [PubMed] [Google Scholar]
- Majima Y, Hamaguchi Y, Hirata K, Takeuchi K, Morishita A, Sakakura Y. Hearing impairment in relation to viscoelasticity of middle ear effusions in children. Ann Otol Rhinol Laryngol. 1988;97(3):272–274. doi: 10.1177/000348948809700311. [DOI] [PubMed] [Google Scholar]
- Murakami S, Guo K, Goode RL. Effect of middle ear pressure change on middle ear mechanics. Acta Otolaryngol. 1997;117:390–395. doi: 10.3109/00016489709113411. [DOI] [PubMed] [Google Scholar]
- Onusko E. Tympanometry. Am Fam Physician. 2004;70(9):1713–1720. [PubMed] [Google Scholar]
- Ravicz ME, Rosowski JJ, Merchant SN. Mechanisms of hearing loss resulting from middle-ear fluid. Hear. Res. 2004;95(1–2):103–130. doi: 10.1016/j.heares.2004.05.010. [DOI] [PubMed] [Google Scholar]
- Rosowski JJ, Lee C-Y. The effect of immobilizing the gerbil’s pars flaccida on the middle-ear’s response to static pressure. Hear. Res. 2002;174:183–195. doi: 10.1016/s0378-5955(02)00655-x. [DOI] [PubMed] [Google Scholar]
- Teoh SW, Flandermeyer DT, Rosowski JJ. Effects of pars flaccida on sound conduction in ears of Mongolian gerbil: acoustic and anatomical measurements. Hear. Res. 1997;106:39–65. doi: 10.1016/s0378-5955(97)00002-6. [DOI] [PubMed] [Google Scholar]
- von Unge M, Decraemer WF, Dirckx JJ, Bagger-Sjoback D. Shape and displacement patterns of the gerbil tympanic membrane in experimental otitis media with effusion. Hear Res. 1995;82(2):184–196. doi: 10.1016/0378-5955(94)00017-k. [DOI] [PubMed] [Google Scholar]