

Abstract
Using a large-scale case–control study, we examined whether common single-nucleotide polymorphisms (SNPs) within 13 genes involved in the cell cycle pathway are associated with breast cancer risk. Seventy-nine tag SNPs were used to evaluate 240 common SNPs found in the genes: CCND1, CCND2, CCND3, CCNE1, CDK2, CDK4, CDK6, CDKN1A, CDKNIB, CDKN2A/CDKN2B, CDKN2C and CDKN2D. These were genotyped in 2270 cases and 2280 controls from the Studies in Epidemiology and Risks of Cancer Heredity (SEARCH) study. Tag SNPs showing evidence of statistically significant differences between cases and controls (P < 0.1) were genotyped in a further 2200 cases and 2280 controls from the same population. This approach found evidence for breast cancer-associated SNPs in four of the cell cycle genes: the cyclin CCNE1 rs997669 had an odds ratio (OR) (GG/AA) of 1.18 [95% confidence interval (95% CI) 1.04–1.34] P = 0.003 and the cyclin-dependent kinase inhibitors—CDKN1A rs3176336: OR (TT/AA) = 1.25 (95% CI 1.11–1.42) P = 0.0026; CDKN1B rs34330: OR (TT/CC) = 1.22 (95% CI 1.02–1.47) P = 0.013 and the region of CDKN2A/2B rs3731239: OR (CC/TT) = 0.90 (95% CI 0.79–1.03) P = 0.013 and rs3218005 OR (GG/AA) = 1.55 (95% CI 1.02–2.37) P = 0.013 (P-values unadjusted for multiple testing). We were able to exclude the D-type cyclins, cyclin-dependent kinases, CDKN2C and CDKN2D from having any significantly associated risk with breast cancer in our study population. The combined effects of the cell cycle genes considered here provide evidence for a significant association with breast cancer risk in a global test (P-heterogeneity = 0.010, P-trend = 0.048). Further large-scale studies are needed to confirm these results.
Introduction
Breast cancer tends to run in families, and twin studies suggest that most of the excess familial risk is attributable to genetic factors (1), (reviewed in ref. 2). Some of this familial risk is explained by high-risk susceptibility genes, notably BRCA1 and BRCA2 (3). Linkage studies suggest that other high-risk genes are unlikely to exist, (2) and most of the familial aggregation is likely to be due to common lower risk alleles. Lower risk susceptibility alleles in ATM, CHEK2, BRIP1, PALB2 and CASP8 (4-11) have been identified, and more recently six new susceptibility loci have been detected through genome-wide studies (12-14). In total, the known susceptibility alleles only explain about 25% of the familial risk of the disease, strongly suggesting that further loci remain to be identified (2,15).
Failures in DNA repair and the subsequent uncontrolled proliferation of cells with damaged DNA both contribute to tumourigenesis (16). Since the cell cycle governs the proliferation and growth of cells, germ-line alterations in the cell cycle genes and their products could predispose to tumours. Here, we consider key genes involved in the cell cycle pathway and examine whether common alleles confer a risk of breast cancer.
The cell cycle pathway has been extensively reviewed (16-19). Germ-line and somatic mutations within the genes (20-22) and changes in expression of their protein products (23-26) have been reported in several cancers. The cell cycle can be broken down into distinct phases (27). This study focuses on the proteins involved in the G1 to S transition, which are concerned with surmounting the ‘restriction point’ (R) (Figure 1): a critical period within the cell cycle at which cells shift from senescence to becoming committed to DNA replication and cell growth (28). The retinoblastoma (RB) protein, a key regulator within the cell cycle, is at the centre of this phase. It is not considered here, as we have previously reported a comprehensive single-nucleotide polymorphism (SNP)-tagging approach on the RB1 gene, with two SNPs (rs2854344 and rs198580) showing a differential effect on breast cancer risk (29).
Fig. 1.
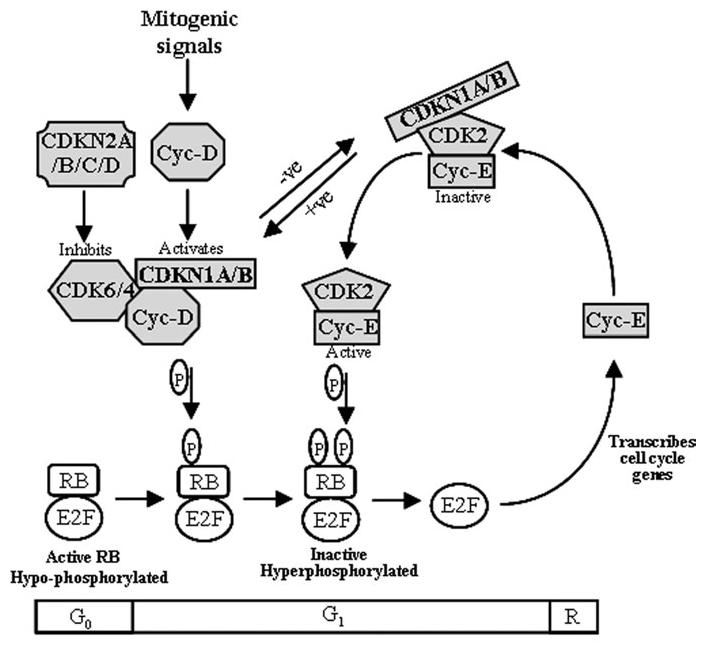
Proteins involved in the G1to S transition of the cell cycle to overcome the restriction point (R) (adapted from ref. 31). The genes examined in this study correspond to the proteins highlighted in grey. P, phosphorylation; −ve, inhibits CDK–cyclin complex; +ve, aids CDK–cyclin complex
Progression through the cell cycle is governed by the activation of cyclin-dependent kinases (CDKs), a group of serine/threonine kinases that form active heterotrimeric complexes when bound to their regulatory cyclin subunits (18). Sequential activation of CDK–cyclin complexes leads to the phosphorylation and inactivation of RB, allowing transcription of cell cycle genes by the E2F family of transcription factors (named for their ability to bind a sequence in the adenovirus E2 promoter) (30). This process is kept in check by cyclin-dependent kinase inhibitors (CKIs). These are known under various names, but are generally classified into two groups: The first group is known as inhibitors of kinase 4 (INK4), which include CDKN2A (INK4A/p16 and ARF/p14), CDKN2B (INK4B/p15), CDKN2C (INK4C/p18) and CDKN2D (INK4D/p19). These bind to both CDK4 and CDK6 to prevent their association with cyclin-D. The second group is commonly known as cyclin-dependent kinase inhibitory protein/kinase inhibitor protein (CIP/KIP): CDKN1A (WAF1/p21/CIP1) and CDKN1B (KIP1/p27), which form heterotrimeric complexes with the G1 to S transition CDKs. The CIP/KIP proteins do not affect cyclin binding. At low concentrations, they have been shown to improve complexing between CDK4/6 and Cyclin-D, but still inhibit CDK2–Cyclin-E (reviewed in ref. 31).
The purpose of this study was to ascertain whether common polymorphisms in the cell cycle genes are associated with breast cancer risk. We used a case–control study design and a comprehensive SNP tagging approach to capture the common variants and test them for association with breast cancer risk.
Materials and methods
Patients and controls
Cases were drawn from the SEARCH (breast) study, an ongoing population-based study, with cases ascertained through the Eastern Cancer Registration and Information Centre (formerly Eastern Cancer Registry). The study commenced in 1996 and to maximize recruitment in the initial phase all women diagnosed with invasive breast cancer below age 55 years since 1991 and still alive in 1996 (prevalent cases, median age 48 years) were invited to participate. This increased the number of younger cases where the genetic contribution to the disease is predicted to be higher. Between 1996 and the present, all women diagnosed below age 70 years (incident cases, median age 54 years) were eligible to take part. Sixty-four percent of eligible breast cancer patients returned a questionnaire and provided a blood sample for DNA analysis. Controls were randomly selected from the Norfolk component of European Prospective Investigation of Cancer (EPIC). EPIC is a prospective study of diet and cancer being carried out in nine European countries. The EPIC-Norfolk cohort comprises 25 000 individuals resident in Norfolk, East Anglia—the same region from which the cases have been recruited. Controls were not matched to cases, but were broadly similar in age at blood draw (aged 42–81 years, median age 63 years). Basic epidemiological details of the breast cancer cases and controls have previously been reported in ref. (32). The ethnic background of both cases and controls, as reported on the questionnaires, was similar with >98% being white. The study was approved by the Eastern Region Multicentre Research Ethics Committee, and all subjects provided written informed consent.
The total number of cases available for analysis was 4470, of whom 27% were prevalent cases. The samples were split into two sets in order to save DNA and reduce genotyping costs: the first set (set 1 n = 2270 cases and 2280 controls) was genotyped for all SNPs and the second set (set 2 n = 2200 cases and 2280 controls) was then tested for those SNPs that showed marginally significant associations in set 1 (P-heterogeneity or P-trend < 0.1). Cases were randomly selected for set 1 from the first 3500 recruited, with set 2 comprising the remainder of these plus the next 970 incident cases recruited. As the prevalent cases were recruited first, the proportion of these is higher in set 1 than set 2 (33% versus 20%). Median age at diagnosis was similar in both sets (51 and 52 years old, respectively). There were no significant differences in the morphology, histopathological grade or clinical stage of the cases by set or by prevalent/incident status.
Power
The statistical power of the study depends on the susceptibility allele frequency, the risks conferred and the genetic mode of action (dominant, recessive, co-dominant). The staged approach substantially reduces genotyping costs without significantly affecting statistical power—a comparison is shown in Supplementary Table I (supplementary data are available at Carcinogenesis Online). For example, assuming that the causative SNP is tagged with r2 = 0.8, a type I error rate of 0.0001 and genotyping success rate of 0.95, the staged study has 86% (full = 88%) power to detect a dominant allele with a minor allele frequency (MAF) of 0.05 that confers a relative risk of 1.5. Power to detect a dominant allele with MAF of 0.25 that confers a relative risk of 1.3 is 87% (full = 89%). Power to detect recessive alleles conferring the same relative risk is less—53% in the staged study (full = 60%) for an allele with MAF of 0.25 and risk 1.5 and 71% (full = 75%) for an allele with MAF 0.5 and risk 1.3.
Selection of tagging SNPs
Where possible, the tag SNPs were identified from data obtained from the National Institute of Environmental Health Sciences (NIEHS) Environmental Genome Project (EGP). The EGP is currently re-sequencing candidate genes for cancer across a panel of 90/95 individuals representative of USA ethnicities. The original panel (P1-PDR90) of 90 individuals consists of 24 European Americans, 24 African-Americans, 12 Mexican Americans, 6 Native Americans and 24 Asian-Americans, but the ethnic group identifiers are not available. Because it is known that there is greater genetic and haplotype diversity in individuals of African origin, we have identified and excluded 28 of the samples with the greatest African ancestry in this population by comparing the genotypes of the re-sequenced samples with genotypes for the same SNPs from the National Heart, Lung and Blood Institute Variation Discovery Resource Project African-American panel (http://pga.gs.washington.edu/finished_genes.html). Data from the remaining 62 individuals were used to identify tag SNPs. Ideally, samples from Native American, Hispanic American and Asian-American individuals should also be removed, but there is less genetic diversity between these groups and they cannot be excluded with any certainty.
When NIEHS re-sequencing data were not available, we used data from the International HapMap Project (http://www.hapmap.org, release #34/5 21-06-2005: last public release used in this study) to select tag SNPs. The HapMap Project has genotyped a large number of randomly selected tag SNPs in several populations including 30 parent–offspring trios collected by the Centre d'Etude du Polymorphisme Humain in 1980 from residents in Utah, USA with northern and western European ancestry (CEU population). Tag SNPs selected using HapMap data are thought to capture most of the known common variation with good efficiency (33).
The efficiency with which a SNP is tagged depends on the linkage disequilibrium (LD) between itself and the tag SNP as measured by the pairwise correlation coefficient (rp2). We aimed to define a set of tag SNPs where all known common variants (MAF ≥ 0.05) had an estimated rp2 > 0.8 with at least one tag SNP. Some SNPs are poorly correlated with other single SNPs but may be efficiently tagged by a haplotype defined by multiple SNPs (multimarker tags), reducing the number of tag SNPs needed. Therefore, we aimed for the correlation between each SNP and a haplotype of tagging SNPs to be rs2 > 0.8. Tag SNPs were selected using the programme Tagger (http://www.broad.mit.edu/mpg/tagger/), which combines the simplicity of pairwise methods with the potential efficiency of multimarker approaches (34).
Taqman genotyping
Genotyping was carried out using Taqman® according to the manufacturer's instructions. Primers and FAM/VIC-labelled probes were supplied directly by (Applied Biosystems, Warrington, UK) as Assays-by-Design™. All assays were carried out in 384-well plates. Each plate included negative controls (with no DNA) and positive controls duplicated on a separate quality control plate. Plates were read on the ABI Prism 7900 using the Sequence Detection Software (Applied Biosystems). Failed genotypes were not repeated. Assays in which the genotypes of duplicate samples did not show >98% concordance were discarded and replaced with alternative assays with the same tagging properties. Call rates for each assay were above 95%.
Statistical methods
For each SNP, deviation of genotype frequencies in controls from the Hardy–Weinberg equilibrium was assessed by a χ2 test with one degree of freedom (df). Genotype frequencies in cases and controls were compared by χ2 test for heterogeneity (2df) and test for trend (1df). Genotype distributions were also compared between prevalent and incident cases and between subjects in set 1 and set 2 with χ2 tests (2df). No statistically significant differences were found (data not shown), and therefore, the results were combined.
In addition to the univariate analyses, we carried out specific haplotype tests for those combinations of alleles (multimarker tags) that tagged specific SNPs. We also carried out a general comparison of common haplotype frequencies in each gene haplotype block utilizing the data from all the tag SNPs in that block. Haplotype blocks were defined such that the common haplotypes (>5% frequency) accounted for at least 80% of the haplotype diversity. Rare haplotypes (<5%) were pooled. For both specific multimarker tests and the general comparison of haplotype frequencies by haplotype block, haplotype frequencies and subject-specific expected haplotype indicators were calculated separately for each study using the programme TagSNPs (35). This implements an expectation substitution approach to account for haplotype uncertainty given unphased genotype data. Subjects missing >50% genotype data in each block were excluded from haplotype analysis. Haplotype-specific odds ratios (ORs) were estimated with their associated confidence intervals (CIs) using unconditional logistic regression. We also used unconditional logistic regression to test the association of specific tag SNP combinations (multimarkers), generated by the Tagger program, with breast cancer risk.
To obtain an overall test of whether there were more associations than would be expected under the global null hypothesis of no association, we used the admixture maximum likelihood (AML) test (36). In brief, the AML method formulates the alternative hypothesis in terms of the proportion (unknown) of SNPs that are associated (α) and the effect size when an association exists (η). The parameters α and η can be estimated by maximum pseudo-likelihood, assuming that the SNPs are independent and a likelihood ratio statistic derived. Although some SNPs are correlated, the significance of the test statistic can be assessed empirically by random permutation of cases and controls; in this study, we used 10 000 permutations.
Results
We genotyped 79 tag SNPs, representing 240 common SNPs in 13 genes within the cell cycle pathway. Details of the SNP tagging process are summarized in Table I. All tag SNPs were genotyped in set 1 (2270 cases and 2280 controls), and the genotype-specific risks are shown in Table II (genotype frequencies for cases and controls are shown in Supplementary Table II, supplementary data are available at Carcinogenesis Online). Five (6.3%) of the 79 genotype distributions in controls showed minor departure from Hardy–Weinberg (P < 0.05). These are included in the data set as visual inspection of clustering showed good quality genotyping. Fifteen tag SNPs with a P-value < 0.1 for either heterogeneity or trend test were eligible to be genotyped in set 2, consisting of a further 2200 cases and 2280 controls. The combined results (set 1 and set 2) are also shown in Table II highlighted in grey. Twelve common SNPs located in CCND2 and CDK6 were tagged by a combination of tag SNPs (multimarker tags) rather than an individual SNP tag. There were no significant associations between these multi-marker tags and breast cancer risk (Supplementary Table III, supplementary data are available at Carcinogenesis Online).
Table I. Details of tag SNPs selection for cell cycle genes.
| Gene | Size (kb) | Data | Percentage of gene re-sequenced by EGP |
No. of common variants |
No. of tag SNPs genotyped |
Additional SNPs genotypeda |
Common variants tagged rp2 > 0.8 |
Common variants tagged rp2 > 0.5 |
Common variants tagged rs2 > 0.8 |
LD blocks |
|---|---|---|---|---|---|---|---|---|---|---|
| CCND1 | 16 | EGP | 100 | 13b | 5 | 2 | 10 (76.9%) | 10 (76.9%) | 10 (76.9%) | 1 |
| CCND2 | 32 (40 kb file)c | HapMap | NA | 30 | 14 | 0 | 19 (63.3%) | 25 (83.3%) | 23 (76.7%) | 2 |
| CCND3 | 9 | EGP | 88 | 13 | 7 | 0 | 12 (92.3%) | 12 (92.3%) | 12 (92.3%) | 1 |
| CCNE1 | 13.5 | EGP | 84 | 12d | 3 | 1 | 5 (41.7%) | 7 (58.3%) | 5 (41.7%) | 1 |
| CDK2 | 7.6 | EGP | 98 | 6 | 2 | 0 | 2 (33.3%) | 2 (33.3%) | 2 (33.3%) | 1 |
| CDK4 | 6.7 | EGP | 96 | 5 | 2 | 0 | 4 (80%) | 4 (80%) | 4 (80%) | 1 |
| CDK6 | 220.8 | HapMap | NA | 88 | 13 | 0 | 68 (77.3%) | 83 (94.3%) | 76 (86.4%) | 3 |
| CDKN1A | 10.9 | EGP | 85 | 27 | 9e | 1 | 17 (63.0%) | 22 (81.5%) | 17 (63.0%) | 3 |
| CDKN1B | 5.7 (10 kb file)c | HapMap | 100 | 7 | 7 | 1 | 7 (100%) | 7 (100%) | 7 (100%) | 1 |
| CDKN2A (2B)f | 28.8 (13.3) | EGP | 81 (94) | 33 | 13 | 3 | 32 (97%) | 32 (97%) | 32 (97%) | 1 |
| CDKN2C | 8.9 | EGP/HapMap | 87 | 3 | 2 | 0 | 3 (100%) | 3 (100%) | 3 (100%) | 1 |
| CDKN2D | 4.1 | EGP | 63 | 3 | 2 | 0 | 3 (100%) | 3 (100%) | 3 (100%) | 1 |
NA, not applicable.
Additional SNPs genotyped that were not common in the data set used for tagging. These SNPs do not contribute to the estimates of tagging efficiency
One common SNP in EGP (rs3212867) was monomorphic in the CEU HapMap population.
File size actually used for tagging process.
Eleven SNPs in LD in EGP had a MAF of 0 in the CEU HapMap population, so were not considered in our population.
Assay for rs3176359 was too rare in our population (MAF 5 0.002).
Genes CDKN2A and CDKN2B were considered together as they lie in a single LD block on 9p21.
Table II. Breast Cancer risks associated with the tag SNPs examined in this study.
| Gene and SNPs | MAF | OR (95% CI) (heterozygotes versus common homozygotes) |
OR (95% CI) (rare homozygotes versus common homozygotes) |
Heterogeneity, P-value (2df) |
Trend test, P-value (1 df) |
|---|---|---|---|---|---|
| CCND1 | |||||
| rs602652 (07) | 0.48 | 0.93 (0.81–1.07) | 0.97 (0.83–1.15) | 0.599 | 0.713 |
| rs3862792 (02)a | 0.03 | 1.07 (0.83–1.39) | 1.07 (0.07–17.14) | 0.871 | 0.600 |
| rs603965 (03) | 0.46 | 0.92 (0.80–1.06) | 0.90 (0.76–1.07) | 0.386 | 0.205 |
| rs3212879 (08) | 0.46 | 1.03 (0.90–1.18) | 1.09 (0.92–1.29) | 0.612 | 0.329 |
| rs3212891 (10) | 0.43 | 1.01 (0.88–1.15) | 1.09 (0.92–1.29) | 0.559 | 0.371 |
| rs678653 (04) | 0.35 | 1.06 (0.97–1.16) | 1.14 (0.99–1.30) | 0.136 | 0.046 |
| rs7178 (01)a | 0.07 | 0.99 (0.83–1.18) | 1.10 (0.49–2.45) | 0.969 | 0.994 |
| CCND2 | |||||
| rs3217795 (01) | 0.10 | 1.01 (0.87–1.17) | 1.21 (0.64–2.29) | 0.833 | 0.752 |
| rs3217805 (02) | 0.40 | 0.87 (0.77–1.00) | 0.93 (0.77–1.11) | 0.129 | 0.180 |
| rs3217820 (03) | 0.38 | 1.05 (0.92–1.19) | 0.90 (0.75–1.09) | 0.255 | 0.573 |
| rs3217852 (09) | 0.24 | 0.95 (0.84–1.08) | 0.91 (0.71–1.17) | 0.615 | 0.324 |
| rs3217862 (10) | 0.16 | 1.01 (0.89–1.16) | 1.28 (0.90–1.82) | 0.379 | 0.355 |
| rs3217863 (11) | 0.07 | 1.02 (0.86–1.20) | 1.17 (0.45–3.04) | 0.934 | 0.779 |
| rs3217869 (05) | 0.38 | 1.14 (1.00–1.29) | 1.08 (0.90–1.29) | 0.141 | 0.183 |
| rs3217901 (18) | 0.43 | 1.01 (0.89–1.15) | 0.90 (0.76–1.07) | 0.351 | 0.317 |
| rs3217906 (14) | 0.26 | 0.97 (0.85–1.10) | 0.93 (0.74–1.18) | 0.781 | 0.483 |
| rs3217916 (15) | 0.27 | 1.02 (0.90–1.15) | 1.02 (0.81–1.29) | 0.952 | 0.764 |
| rs3217925 (16) | 0.25 | 1.04 (0.92–1.18) | 1.00 (0.78–1.28) | 0.796 | 0.678 |
| rs3217926 (06) | 0.40 | 1.06 (0.94–1.21) | 0.89 (0.74–1.06) | 0.101 | 0.404 |
| rs3217933 (17) | 0.26 | 1.00 (0.88–1.13) | 0.91 (0.72–1.16) | 0.751 | 0.620 |
| rs3217936 (07) | 0.32 | 1.04 (0.92–1.18) | 1.11 (0.91–1.35) | 0.570 | 0.293 |
| CCND3 | |||||
| rs3218114 (08) | 0.17 | 1.07 (0.94–1.22) | 0.88 (0.60–1.27) | 0.445 | 0.673 |
| rs3218110 (07) | 0.25 | 1.08 (0.95–1.22) | 0.99 (0.78–1.26) | 0.488 | 0.488 |
| rs9529 (06) | 0.28 | 0.90 (0.79–1.01) | 0.98 (0.78–1.24) | 0.206 | 0.239 |
| rs1051130 (03)b | 0.45 | 0.93 (0.82–1.07) | 0.92 (0.78–1.08) | 0.507 | 0.282 |
| rs2479717 (02) | 0.27 | 0.90 (0.80–1.02) | 0.96 (0.76–1.22) | 0.264 | 0.217 |
| rs3218092 (04) | 0.17 | 1.02 (0.90–1.17) | 0.87 (0.61–1.25) | 0.690 | 0.914 |
| rs1410492 (01) | 0.27 | 0.97 (0.86–1.10) | 0.88 (0.70–1.11) | 0.554 | 0.321 |
| CCNE1 | |||||
| rs997669 (02) | 0.39 | 1.13 (1.03–1.24) | 1.18 (1.04–1.34) | 0.008 | 0.003 |
| rs3218036 (12) | 0.32 | 1.09 (0.96–1.23)) | 1.12 (0.92–1.36) | 0.326 | 0.150 |
| rs3218038 (05) | 0.04 | 0.96 (0.77–1.21) | 103.75 (0.00–37209) | 0.573 | 0.836 |
| rs3218076 (08)a | 0.27 | 1.06 (0.94–1.20) | 0.82 (0.65-1.05) | 0.112 | 0.647 |
| CDK2 | |||||
| rs2069408 (02) | 0.33 | 1.07 (0.94–1.21) | 0.96 (0.79-1.17) | 0.447 | 0.866 |
| rs1045435 (04) | 0.08 | 0.99 (0.84–1.17) | 1.30 (0.67–2.51) | 0.731 | 0.820 |
| CDK4 | |||||
| rs2270777 (01) | 0.43 | 1.14 (0.99–1.31) | 1.08 (0.91–1.29) | 0.169 | 0.233 |
| rs2069506 (02)b | 0.34 | 1.01 (0.88–1.15) | 0.86 (0.71–1.05) | 0.299 | 0.285 |
| CDK6 | |||||
| rs8179 (09)b | 0.20 | 1.13 (0.99–1.28) | 0.95 (0.71–1.26) | 0.156 | 0.294 |
| rs2285332 (12) | 0.25 | 0.91 (0.80–1.03) | 1.08 (0.84–1.37) | 0.216 | 0.580 |
| rs42046 (08) | 0.26 | 1.08 (0.96–1.22) | 1.03 (0.82–1.31) | 0.454 | 0.335 |
| rs3731348 (11) | 0.05 | 1.16 (0.96–1.40) | 0.79 (0.18–3.55) | 0.292 | 0.157 |
| rs2237570 (13) | 0.11 | 0.94 (0.85–1.05) | 0.92 (0.64–1.31) | 0.512 | 0.251 |
| rs3731343 (01) | 0.47 | 0.94 (0.82–1.08) | 0.94 (0.80–1.12) | 0.665 | 0.469 |
| rs3757823 (02) | 0.09 | 1.09 (0.98–1.22) | 1.24 (0.76–2.02) | 0.211 | 0.079 |
| rs2079147 (03) | 0.46 | 0.99 (0.87–1.14) | 1.04 (0.88–1.23) | 0.801 | 0.639 |
| rs2282991 (10) | 0.10 | 0.91 (0.81–1.02) | 0.90 (0.58–1.40) | 0.243 | 0.100 |
| rs4729049 (04) | 0.09 | 1.00 (0.85–1.17) | 0.73 (0.37–1.44) | 0.655 | 0.703 |
| rs8 (05)b | 0.21 | 0.92 (0.81–1.04) | 1.20 (0.88–1.65) | 0.168 | 0.719 |
| rs445 (06) | 0.10 | 1.04 (0.89–1.21) | 0.93 (0.54–1.62) | 0.861 | 0.758 |
| rs992519 (07) | 0.14 | 0.91 (0.80–1.05) | 1.31 (0.84–2.02) | 0.188 | 0.631 |
| CDKN1A | |||||
| rs762624 (07) | 0.27 | 1.02 (0.93–1.11) | 1.22 (1.04–1.44) | 0.051 | 0.063 |
| rs2395655 (06) | 0.39 | 0.99 (0.87–1.12) | 1.11 (0.93–1.32) | 0.393 | 0.372 |
| rs3176326 (17) | 0.21 | 0.98 (0.87–1.11) | 1.13 (0.83–1.53) | 0.676 | 0.811 |
| rs3176331 (11) | 0.13 | 0.97 (0.84–1.12) | 1.13 (0.70–1.81) | 0.807 | 0.927 |
| rs3176336 (12) | 0.39 | 1.01 (0.92–1.11) | 1.25 (1.11–1.42) | 0.00078 | 0.0026 |
| rs3176343 (14) | 0.05 | 1.09 (0.89–1.32) | 2.10 (0.72–6.16) | 0.283 | 0.217 |
| rs1801270 (01) | 0.06 | 1.08 (0.95–1.23) | 2.08 (1.18–3.68) | 0.021 | 0.040 |
| rs3176352 (02) | 0.26 | 1.04 (0.95–1.14) | 1.18 (1.00–1.40) | 0.124 | 0.063 |
| rs1059234 (03) | 0.06 | 1.09 (0.90–1.32) | 3.28 (1.39–7.73) | 0.011 | 0.039 |
| rs6457937 (04)a | 0.09 | 1.07 (0.91–1.25) | 1.56 (0.89–2.74) | 0.224 | 0.151 |
| CDKN1B | |||||
| rs3759216 (04) | 0.46 | 0.86 (0.75–0.99) | 0.96 (0.81–1.13) | 0.084 | 0.417 |
| rs3759217 (05) | 0.13 | 0.91 (0.79–1.05) | 1.02 (0.61–1.70) | 0.405 | 0.262 |
| rs34330 (01) | 0.24 | 1.08 (0.99–1.18) | 1.22 (1.02–1.47) | 0.044 | 0.013 |
| rs2066827 (02) | 0.24 | 0.98 (0.86–1.12) | 0.95 (0.72–1.25) | 0.908 | 0.668 |
| rs34329 (06) | 0.31 | 0.89 (0.79–1.01) | 1.12 (0.92–1.38) | 0.043 | 0.934 |
| rs3093736 (07) | 0.03 | 0.94 (0.73–1.21) | 2.08 (0.52–8.33) | 0.508 | 0.943 |
| rs7330 (03) a | 0.40 | 1.04 (0.94–1.14) | 1.10 (0.97–1.24) | 0.354 | 0.155 |
| rs1420023 (08) | 0.11 | 0.96 (0.82–1.12) | 0.93 (0.56–1.56) | 0.842 | 0.559 |
| CDKN2A/2B | |||||
| rs3731257 (2A–13) | 0.25 | 1.10 (0.97–1.25) | 0.95 (0.74–1.20) | 0.232 | 0.514 |
| rs3088440 (2A–11) | 0.09 | 0.93 (0.79–1.10) | 0.70 (0.36–1.35) | 0.409 | 0.234 |
| rs11515 (2A–10) | 0.14 | 1.03 (0.89–1.18) | 1.44 (0.94–2.21) | 0.227 | 0.246 |
| rs3731249 (2A–12)a | 0.03 | 0.96 (0.74–1.23) | 1.04 (0.15–7.41) | 0.939 | 0.742 |
| rs3731239 (2A–09) | 0.37 | 0.86 (0.79–0.94) | 0.90 (0.79–1.03) | 0.005 | 0.013 |
| rs4074785(2A–14)a | 0.10 | 0.94 (0.80–1.10) | 0.71 (0.38–1.35) | 0.442 | 0.256 |
| rs3731222 (2A–01)ab | 0.14 | 0.94 (0.82–1.08) | 1.52 (0.96–2.39) | 0.119 | 0.861 |
| rs3731211(2A–02)b | 0.28 | 1.00 (0.92–1.09) | 1.25 (1.07–1.47) | 0.018 | 0.059 |
| rs3731197 (2A–15) | 0.39 | 0.97 (0.85–1.10) | 1.08 (0.90–1.29) | 0.488 | 0.603 |
| rs3218020 (2A–03) | 0.34 | 0.98 (0.86–1.11) | 1.04 (0.86–1.26) | 0.823 | 0.855 |
| rs2811712(2A–04) | 0.10 | 1.06 (0.95–1.17) | 1.64 (1.11–2.42) | 0.030 | 0.045 |
| rs3218012(2B–04) | 0.44 | 0.92 (0.81–1.05) | 0.96 (0.81–1.14) | 0.492 | 0.505 |
| rs3218009 (2B–03) | 0.12 | 0.99 (0.86–1.14) | 1.24 (0.74–2.08) | 0.701 | 0.832 |
| rs3218005 (2A–05) | 0.09 | 1.11 (0.99–1.24) | 1.55 (1.02–2.37) | 0.027 | 0.013 |
| rs3217992 (2A–06) | 0.37 | 1.04 (0.91–1.18) | 1.00 (0.84–1.21) | 0.837 | 0.796 |
| rs1063192 (2B–02) | 0.45 | 0.93 (0.81–1.06) | 0.94 (0.80–1.12) | 0.538 | 0.421 |
| CDKN2C | |||||
| rs3176459 (02) | 0.33 | 1.02 (0.90–1.16) | 1.09 (0.89–1.32) | 0.698 | 0.431 |
| rs12855 (01) | 0.10 | 0.85 (0.73–0.99) | 1.19 (0.63–2.24) | 0.105 | 0.111 |
| CDKN2D | |||||
| rs3218222 (02) | 0.23 | 1.10 (0.98–1.25) | 1.00 (0.78–1.30) | 0.284 | 0.290 |
| rs1465701 (01) | 0.05 | 0.98 (0.81–1.20) | 1.46 (0.46–4.62) | 0.795 | 0.957 |
SNPs shaded grey were taken through into set 2. The results presented here refer to the combined data for set 1 and set 2.
Extra SNPs genotyped that were not part of the tagging set.
Controls are out of Hardy–Weinberg.
The AML method (36) using all the tag SNPs assessed in this study showed evidence for a significant association with breast cancer susceptibility, compared with the global null hypothesis (P-heterogeneity = 0.010, P-trend = 0.048). Most of this effect came from eight SNPs in four genes (CCNE1, CDKN1A, CDKN1B and CDKN2A/2B) that were associated with breast cancer risk at the P < 0.05 level for either the trend test or heterogeneity test. Three SNPs within CDKN1A conferred a significantly elevated risk of breast cancer. The most strongly associated variant was rs3176336 (CDKN1A-12), (P-heterogeneity = 0.00078, P-trend = 0.0026). This had a recessive mode of action with an OR for the rare homozygote of 1.25 (95% CI 1.11–1.42) compared with the common homozygote (TT versus AA). The other two associated SNPs, rs1801270 (CDKN1A-01) and rs1059234 (CDKN1A-03), are in strong LD (rp2 = 0.97). Stepwise logistic regression including both CDKN1A-01 and CDKN1A-03 demonstrated that the associations observed with these two tag SNPs could be explained by CDKN1A-01 alone. SNP rs1801270 (CDKN1A-01) confers an increased risk of breast cancer (P-heterogeneity = 0.020, P-trend = 0.040) with an apparent recessive mode of action—OR = 2.08 (95% CI 1.18–3.68) for the rare homozygotes versus the common homozygotes (AA versus CC). One SNP in the other CIP/KIP CKI gene (CDKN1B) was also associated with an increased breast cancer risk: rs34330 (CDKN1B-01) (P-trend = 0.013) in a dose-dependent manner [minor allele per allele OR = 1.09 (95% CI 1.02–1.17)]. rs3759216 (CDKN1B-04) and rs34329 (CDKN1B-06) were not taken through to set 2, as multiple logistic regression showed they were not independent of rs34330 (CDKN1B-01). SNP rs997669 (CCNE1-02) located in CCNE1 was also significantly associated with an increased breast cancer risk, OR (GG/AA) = 1.18 (95% CI 1.04–1.34) P-trend = 0.003.
Nominally significant associations with breast cancer risk were also found for four SNPs within the region of CDKN2A/2B. These two genes were considered as one region because they lie close together on chromosome 9 in a single LD block. The strongest association was observed with rs3731239 (CDKN2A-09), in which the minor allele conferred a protective effect [OR (CC/TT) = 0.90 (95% CI 0.79–1.03) P-trend = 0.013]. The minor alleles of three additional SNPs were associated with an increased risk of breast cancer: rs3731211 (CDKN2A-02), rs2811712 (CDKN2A-04) and rs3218005 (CDKN2A-05). rs2811712 (CDKN2A-04) and rs3218005 (CDKN2A-05) are in perfect LD (rp2 = 1.0). After adjustment for rs3731239 (CDKN2A-09), rs3218005 (CDKN2A-05) (or equivalently CDKN2A-04) was of borderline significance (P = 0.051), but CDKN2A-02 was no longer significant.
We found no evidence of association with breast cancer, at the P < 0.05 level, for any of the SNPs in CDKN2C, CDKN2D, CDK2, CDK4 and CDK6 (Table II), nor any evidence of an association with any of the multimarker tags (Supplementary Table III, supplementary data are available at Carcinogenesis Online), nor any difference in the haplotype frequencies in cases and controls for SNPs in these genes (Table III).
Table III. Haplotype analysis of all tag SNPs genotyped in set 1.
| Genea | Haplotype | Frequency | P-value | OR | 95% CI |
|---|---|---|---|---|---|
| CCND1 | h1010000 | 0.343 | 0.256 | ||
| 07, 02, 03, 08, 10, 04, 01 | h0001110 | 0.296 | 0.038 | 1.105 | 1.006–1.214 |
| h0001100 | 0.098 | 0.163 | |||
| h0000000 | 0.085 | 0.166 | |||
| h1010001 | 0.070 | 0.629 | |||
| Combined rareb | 0.102 | ||||
| CCND2 | h100000 | 0.3496 | 0.636 | ||
| Block 1—03, 09, 10, 11, 05, 18 | h010001 | 0.2203 | 0.198 | ||
| h001010 | 0.1536 | 0.274 | |||
| h000011 | 0.1113 | 0.467 | |||
| Combined rare | 0.698 | ||||
| CCND2 | h000100 | 0.3653 | 0.740 | ||
| Block 2—14, 15, 16, 06, 17, 07 | h011001 | 0.2276 | 0.752 | ||
| h100010 | 0.1925 | 0.272 | |||
| Combined rareb | 0.239 | ||||
| h000010 | 0.0443 | 0.050 | 1.234 | 1.000–1.523 | |
| CCND3 | h0011100 | 0.2515 | 0.211 | ||
| 08, 07, 06, 03, 02, 04, 01 | h0000001 | 0.2499 | 0.482 | ||
| h0100000 | 0.2352 | 0.221 | |||
| h1001010 | 0.1640 | 0.544 | |||
| Combined rareb | 0.731 | ||||
| h0000000 | 0.0362 | 0.048 | 1.254 | 1.002–1.568 | |
| CCNE1 | h0000 | 0.3353 | 0.169 | ||
| 02, 12, 05, 08 | h1100 | 0.3211 | 0.187 | ||
| h0001 | 0.2291 | 0.719 | |||
| h1000 | 0.0763 | 0.479 | |||
| Combined rareb | 0.990 | ||||
| CDK2 | h00 | 0.6091 | 0.806 | ||
| 02, 04 | h10 | 0.3078 | 0.903 | ||
| h01 | 0.0601 | 0.858 | |||
| Combined rareb | 0.847 | ||||
| CDK4 | h10 | 0.4318 | 0.209 | ||
| 01, 02 | h01 | 0.3319 | 0.225 | ||
| h00 | 0.2352 | 0.929 | |||
| Combined rareb | 0.796 | ||||
| CDK6 | h000001 | 0.4634 | 0.552 | ||
| Block 1—09, 12, 08, 11,13, 01 | h101000 | 0.2041 | 0.304 | ||
| h010010 | 0.0965 | 0.034 | 0.860 | 0.748–0.989 | |
| h010000 | 0.0921 | 0.654 | |||
| h001000 | 0.0629 | 0.676 | |||
| h010100 | 0.0554 | 0.142 | |||
| Combined rareb | 0.741 | ||||
| CDK6 | h000 | 0.5303 | 0.662 | ||
| Block 2—02, 03, 10 | h010 | 0.2818 | 0.253 | ||
| h110 | 0.0969 | 0.167 | |||
| h011 | 0.0883 | 0.024 | 0.843 | 0.726–0.978 | |
| Combined rareb | 0.239 | ||||
| CDK6 | h0000 | 0.5197 | 0.708 | ||
| Block 3—04, 05, 06, 07 | h0100 | 0.2049 | 0.754 | ||
| h0010 | 0.1037 | 0.742 | |||
| h0001 | 0.0789 | 0.893 | |||
| h1001 | 0.0602 | 0.480 | |||
| Combined rareb | 0.824 | ||||
| CDKN1A | h0000 | 0.5874 | 0.198 | ||
| Block 1—07, 06, 17, 11 | h1110 | 0.2055 | 0.635 | ||
| h0101 | 0.1279 | 0.954 | |||
| h1100 | 0.0551 | 0.346 | |||
| Combined rareb | 0.092 | ||||
| CDKN1A | h0000 | 0.5690 | 0.063 | ||
| Block 2—12, 14, 01, 02 | h1001 | 0.1708 | 0.454 | ||
| h1000 | 0.1609 | 0.948 | |||
| h1111 | 0.0502 | 0.289 | |||
| Combined rareb | 0.047 | 1.238 | 1.003–1.529 | ||
| CDKN1A | h00 | 0.8418 | 0.014 | 0.864 | 0.769–0.971 |
| Block 3—03, 04 | h01 | 0.0942 | 0.182 | ||
| h10 | 0.0587 | 0.050 | 1.199 | 1.000–1.438 | |
| Combined rareb | 0.361 | ||||
| CDKN1B | h10000000 | 0.2731 | 0.552 | ||
| 04, 05, 01, 02, 06, 07, 03, 08 | h01001010 | 0.0927 | 0.186 | ||
| h00100010 | 0.0840 | 0.218 | |||
| h10010000 | 0.0816 | 0.356 | |||
| h00101010 | 0.0611 | 0.338 | |||
| h00100000 | 0.0576 | 0.323 | |||
| h00000001 | 0.0571 | 0.448 | |||
| Combined rareb | 0.557 | ||||
| CDKN2A2B | h1000000001010010 | 0.1943 | 0.192 | ||
| CDKN2A—13, 11, 10, 12, 09, | h0000100000000001 | 0.1682 | 0.724 | ||
| 14, 01, 02, 15, 03, 04; | h0000100000001001 | 0.1161 | 0.994 | ||
| CDKN2B-04, CDKN2B-03, | h0000001110000001 | 0.0911 | 0.886 | ||
| CDKN2A-05, 06, CDKN2B-02 | h0100010010010000 | 0.0828 | 0.175 | ||
| h0010000110100100 | 0.0660 | 0.741 | |||
| Combined rareb | 0.120 | ||||
| CDKN2C | h00 | 0.5685 | 0.857 | ||
| 02, 01 | h10 | 0.3360 | 0.454 | ||
| h01 | 0.0950 | 0.130 | |||
| Combined rareb | 0.915 | ||||
| CDKN2D | h00 | 0.7629 | 0.331 | ||
| 02, 01 | h10 | 0.1865 | 0.289 | ||
| h11 | 0.0502 | 0.954 | |||
| Combined rareb | 0.601 |
SNPs used for haplotype analysis are arranged in chromosome order.
Rare haplotypes (<5%) were pooled.
Borderline evidence for an association with breast cancer susceptibility was observed in the variants of the D type cyclins (CCND1, CCND2 and CCND3). SNP rs678653 (CCND1-04) was associated with a marginally increased risk [OR (CC/GG) = 1.14 (95% CI 0.99–1.30) P-trend = 0.046] in combined sets 1 and 2 (Table II). The individual tag SNPs for CCND2 and CCND3 did not show any association with breast cancer risk, but both genes have haplotypes of tag SNPs associated with an elevated risk (Table III), suggesting that there may be as yet, undiscovered genetic variants associated with risk in these two genes.
None of the tested SNPs were associated with age in the controls and age-adjusted results were similar to the unadjusted results (data not shown).
Discussion
We have found some evidence that common genetic variation in the cell cycle genes is associated with breast cancer using the global AML test (P = 0.010). Specific associations were identified for tag SNPs in CCNE1, CDKN1A, CDKN1B and the region CDKN2A/2B. In total, 8 of 87 (79 tag SNPs plus 8 additionally genotyped) SNPs (9.2%) showed a significant association with breast cancer at the P ≤ 0.05 threshold. This is approximately double the number of tag SNPs we would have expected to show an association by chance alone. However, none of the individual univariate associations were highly significant, so it is not possible to be certain at this stage whether any specific associations are true positives. The most significant association (with rs3176336 in CDKN1A) reached P = 0.0026, whereas thresholds of P < 10−4 for candidate gene studies and P < 10−7 for genome-wide studies have been suggested as appropriate to overcome the multiple testing problem (2,37). It is also possible that some of the observed effect is due to effects of population stratification and/or cryptic relatedness, leading to an inflation of the test statistics, although this effect is likely to be small. Using the genomic control method, we have previously shown that there was an inflation of approximately 6% in the median chi-squared test statistic for our study (38). The P-value for the most significantly associated SNP (rs3176336) is attenuated from P = 0.0026 to P = 0.0028 after adjusting for this.
The CCNE1 protein is a cyclin, which binds to CDK2, and is involved with surpassing the restriction point (39). The significantly associated tag SNP within CCNE1 is rs997669 (CCNE1-02), which is mapped to intron 4 of the gene. This SNP also tags rs3218069 (rp2 = 0.95) and rs3218070 (rp2 = 0.95) both located in intron 11. Neither of these regions appear to be conserved across species (data from http://www.genome.ucsc.edu). We have considered conservation across species for the common alleles as it is more likely that a SNP in a conserved area will have a functionally important effect (40). The lack of conservation in this case might mean that another, as yet undiscovered variant correlated with these directly increases risk of breast cancer. Eighty-four percent of the gene footprint has been sequenced by EGP, with only the repetitive sequences unscanned, indicating that almost all the common variants in this gene will already have been identified. The number of common variants quoted in Table I is lower than that suggested by EGP as 11 of their reportedly common polymorphisms, which are all strongly correlated with one another (rp2 > 0.8), do not appear to be polymorphic in our population. HapMap (http://www.hapmap.org) shows that these SNPs have a MAF of 0 in the CEU population and this is in agreement with our own findings. Although we excluded the subjects with the most African ancestry from the downloaded EGP data, we were unable to isolate samples of European ancestry. This does not detract from the significance of rs997669, but does suggest that further re-sequencing of more samples from individuals of western European ancestry may be needed to find the functional variant and possibly identify other common variants present that were too rare in the combined EGP populations for us to include.
The other three genes with significantly associated SNPs encode CKIs. CDKN2A is an INK4 CKI, which can bind to CDK4 and CDK6, to prevent their association with the catalytic subunit cyclin-D. This in turn prevents the phosphorylation of RB, which is the first significant event within G1 of the cell cycle (reviewed in ref. 31,41). The most significantly associated tag SNP in CDKN2A from our study is rs3731239 (CDKN2A-09). The SNP is located within intron 1, but does not tag any other SNPs with rp2 > 0.8, nor is this region highly conserved (conservation score of 0.002 from http://gvs.gs.washington.edu/GVS/). Other groups have also reported links with CDKN2A variants and breast cancer. A Polish case–control study (42) looked at the CDKN2A A148T variant, also known as rs3731249 (CDKN2A-12) (43). Carriers of this variant within their study appeared to have tumours with an excess of intraductal cancers (ductal carcinoma in situ) with microinvasion. We found no association with invasive breast cancer for this variant in our study population, and we specifically excluded ductal carcinoma in situ cases from our analysis, so we were not able to confirm or refute their finding.
CDKN1B and CDKN1A are from a family of CKIs called CIP/KIP inhibitors. Their main inhibitory effect is the prevention of RB phosphorylation by CDK2–Cyclin-E (31). One SNP within exon 1 of CDKN1B, rs34330 (CDKN1B-01), is significantly associated with an increased risk of breast cancer in this study [OR (TT/CC) = 1.22 (95% CI 1.02–1.47) P-trend = 0.013]. The SNP is a singleton (i.e. not correlated with any other known SNPs) and 100% of the gene has been sequenced by EGP. If this association is confirmed, it is likely that this is the functional variant.
The most significantly associated SNP of the study was rs3176336 (CDKN1A-12), which has an apparently recessive effect. This SNP tags rs3176333 (rp2 = 0.97) and rs3176337 (rp2 = 0.81), and all three are located in intron 1 of CDKN1A. Eighty-five percent of the gene has been re-sequenced by EGP with only the repetitive sequence unscanned, indicating that the majority of polymorphisms have been identified. The SNP rs3176333 is located in a highly conserved region (Figure 2), whereas rs3176336 and rs3176337 do not appear to be positioned in regions conserved across species. This provides some evidence that rs3176333 is more likely to be the functional variant as the common allele has been selectively maintained across species. The observed increase in breast cancer risk associated with these three SNPs could be related to how the different allelic forms affect pre-mRNA splicing: an important mechanism that controls eukaryotic gene expression (44). We used the splicing rainbow (http://www.ebi.ac.uk/asd-srv/wb.cgi?method = 8), which is a tool for the identification of binding sites of splicing factors, based mainly on position scoring matrices derived from SELEX data (45). The minor alleles of these three SNPs introduce additional binding sites for hnRNP I [also called polypyrimidine tract binding protein (PTB), one of the most common intronic splicing regulators] and some serine-arginine rich splicing factors (SR proteins) (namely SRp20, SC35, SRp40, ASF/SF2), which are common exonic splicing factors, but have also shown (for some genes) to bind and act at the intronic level (46,47). These alternative splicing changes brought about by the minor allele may alter the structure of the mRNAs and their encoded proteins, resulting in alterations in function, including binding, localization, stability, phosphorylation, etc. (44).
Fig. 2.
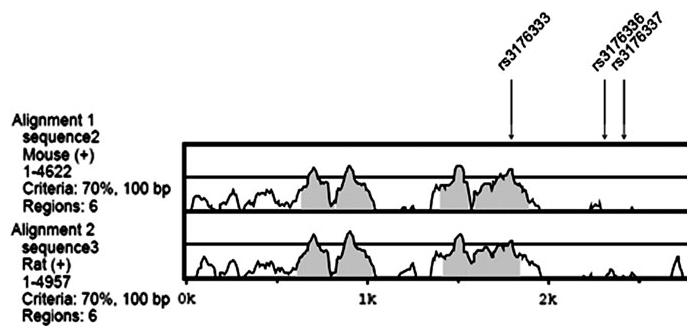
Conservation of SNPs tagged by rs3176336 (CDKN1A-12) across other species.
A Chinese population-based study by Ma et al. (48) reported associations with breast cancer for rs34330 (CDKN1B-01), consistent with our findings. A meta-analysis combining both sets of data showed the OR of the rare homozygote to be OR (TT/CC) = 1.29 (95% CI 1.03–1.62) P = 0.024. The Forest plot is shown in Figure 3. There was no significant heterogeneity between the two studies. Their results also supported the association observed with rs1801270 (CDKN1A-01) reported here. However, a larger study carried out by the Breast Cancer Association Consortium consisting of 18 290 cases and 22 670 controls (including the data used in this study) found no overall evidence for an association with breast cancer (P-trend = 0.28), but there was evidence of heterogeneity between the studies (P = 0.009) (5). In our own study, rs1801270 was not significantly associated with breast cancer risk after adjustment for rs3176336 (CDKN1A-12). Neither of these studies genotyped rs3176336, so it is likely that further genotyping of rs3176336 by other studies is needed to confirm an association that was missed with rs1801270 (CDKN1A-01).
Fig. 3.
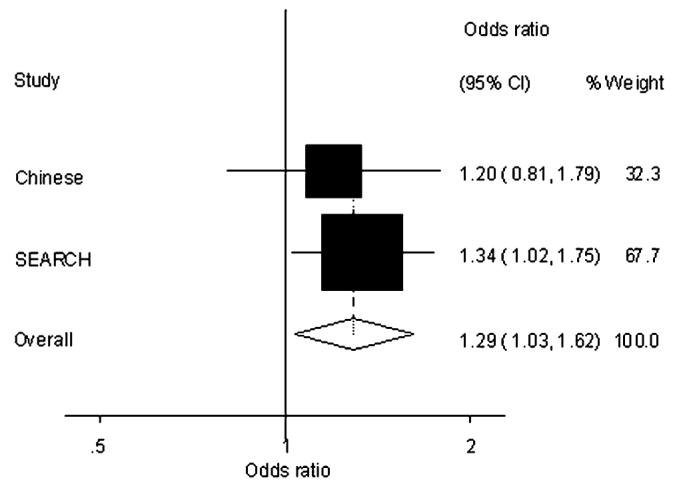
Meta-analysis combining data from this study (SEARCH) and a Chinese case–control study (48), to examine the association of the rare homozygote of rs34330 (CDKN1B-01) with breast cancer risk (P = 0.024). Heterogeneity P = 0.663.
Recent improvements in technology have made genome-wide association studies possible, and three such studies have now been conducted in breast cancer (12-14). Despite this, detailed candidate gene studies such as this study are still informative because they provide more detailed coverage of all the known polymorphisms in these regions. For example, we genotyped 79 tag SNPs plus 8 additional SNPs in this study across the cell cycle genes, compared with 65 tag SNPs in ref. (12). In addition, stage 1 of this study is larger than any of the genome-wide association studies, providing greater power to detect modest effects.
In conclusion, we found evidence that common genetic variation in the cell cycle genes is associated with susceptibility to breast cancer. Although no one individual SNP has demonstrated a highly significant association with breast cancer, the results of the global test suggest that multiple common variants within the cell cycle genes may each confer a small effect. This would conform to the polygenic model for cancer susceptibility, which proposes that much of the inherited risk of cancer is due to multiple risk alleles, each conferring a low to moderate risk (49). Larger studies will be needed to confirm these associations.
Supplementary Material
Acknowledgements
We would like to thank the Eastern Cancer Registration and Information Centre and the SEARCH team for recruitment of cases; the EPIC-Norfolk Investigators for recruitment of controls; Don Conroy, Craig Luccarini, Helen Field and Danielle Shadforth for their technical support. B.A.J.P. is a Gibb Fellow of Cancer Research, UK, D.F.E is a Cancer Research UK Principal Research Fellow and P.D.P.P. is a Senior Clinical Research Fellow.
Funding
Cancer Research United Kingdom (C20/A1639, C20/A3084, C490/A4341).
Abbreviations
- AML
admixture maximum likelihood
- 95% CI
95% confidence interval
- CDK
cyclin-dependent kinase
- CKI
cyclin-dependent kinase inhibitor
- CIP/KIP
cyclin-dependent kinase inhibitory protein/kinase inhibitor protein
- df
degree of freedom
- EGP
Environmental Genome Project
- EPIC
European Prospective Investigation of Cancer
- INK4
inhibitors of kinase 4
- LD
linkage disequilibrium
- MAF
minor allele frequency
- OR
odds ratio
- RB
retinoblastoma
- SNP
single-nucleotide polymorphism
Footnotes
Conflict of Interest Statement: None declared.
Supplementary material
Supplementary Tables I–III can be found at http://carcin.oxfordjournals.org/
References
- 1.Lichtenstein P, et al. Environmental and heritable factors in the causation of cancer—analyses of cohorts of twins from Sweden, Denmark, and Finland. N. Engl. J. Med. 2000;343:78–85. doi: 10.1056/NEJM200007133430201. [DOI] [PubMed] [Google Scholar]
- 2.Antoniou AC, et al. Models of genetic susceptibility to breast cancer. Oncogene. 2006;25:5898–5905. doi: 10.1038/sj.onc.1209879. [DOI] [PubMed] [Google Scholar]
- 3.Anglian Breast Cancer Study Group Prevalence and penetrance of BRCA1 and BRCA2 mutations in a population-based series of breast cancer cases. Br. J. Cancer. 83:1301–1308. doi: 10.1054/bjoc.2000.1407. [DOI] [PMC free article] [PubMed] [Google Scholar]
- 4.CHEK2 Breast Cancer Case-Control Consortium CHEK2*1100delC and susceptibility to breast cancer: a collaborative analysis involving 10,860 breast cancer cases and 9,065 controls from 10 studies. Am. J. Hum. Genet. 2004;74:1175–1182. doi: 10.1086/421251. [DOI] [PMC free article] [PubMed] [Google Scholar]
- 5.Cox A, et al. A common coding variant in CASP8 is associated with breast cancer risk. Nat. Genet. 2007;39:352–358. doi: 10.1038/ng1981. [DOI] [PubMed] [Google Scholar]
- 6.Erkko H, et al. A recurrent mutation in PALB2 in Finnish cancer families. Nature. 2007;446:316–319. doi: 10.1038/nature05609. [DOI] [PubMed] [Google Scholar]
- 7.Meijers-Heijboer H, et al. Low-penetrance susceptibility to breast cancer due to CHEK2(*)1100delC in noncarriers of BRCA1 or BRCA2 mutations. Nat. Genet. 2002;31:55–59. doi: 10.1038/ng879. [DOI] [PubMed] [Google Scholar]
- 8.Rahman N, et al. PALB2, which encodes a BRCA2-interacting protein, is a breast cancer susceptibility gene. Nat. Genet. 2007;39:165–167. doi: 10.1038/ng1959. [DOI] [PMC free article] [PubMed] [Google Scholar]
- 9.Renwick A, et al. ATM mutations that cause ataxia-telangiectasia are breast cancer susceptibility alleles. Nat. Genet. 2006;38:873–875. doi: 10.1038/ng1837. [DOI] [PubMed] [Google Scholar]
- 10.Seal S, et al. Truncating mutations in the Fanconi anemia J gene BRIP1 are low-penetrance breast cancer susceptibility alleles. Nat. Genet. 2006;38:1239–1241. doi: 10.1038/ng1902. [DOI] [PubMed] [Google Scholar]
- 11.Thompson D, et al. Cancer risks and mortality in heterozygous ATM mutation carriers. J. Natl Cancer Inst. 2005;97:813–822. doi: 10.1093/jnci/dji141. [DOI] [PubMed] [Google Scholar]
- 12.Easton DF, et al. Genome-wide association study identifies novel breast cancer susceptibility loci. Nature. 2007;447:1087–1093. doi: 10.1038/nature05887. [DOI] [PMC free article] [PubMed] [Google Scholar]
- 13.Hunter DJ, et al. A genome-wide association study identifies alleles in FGFR2 associated with risk of sporadic postmenopausal breast cancer. Nat. Genet. 2007;39:870–874. doi: 10.1038/ng2075. [DOI] [PMC free article] [PubMed] [Google Scholar]
- 14.Wellcome Trust Case Control Consortium Genome-wide association study of 14,000 cases of seven common diseases and 3,000 shared controls. Nature. 2007;447:661–678. doi: 10.1038/nature05911. [DOI] [PMC free article] [PubMed] [Google Scholar]
- 15.Easton DF, et al. How many more breast cancer predisposition genes are there? Breast Cancer Res. 1999;1:14–17. doi: 10.1186/bcr6. [DOI] [PMC free article] [PubMed] [Google Scholar]
- 16.Golias CH, et al. Cell proliferation and cell cycle control: a mini review. Int. J. Clin. Pract. 2004;58:1134–1141. doi: 10.1111/j.1742-1241.2004.00284.x. [DOI] [PubMed] [Google Scholar]
- 17.Bartek J, et al. Cell cycle. Order from destruction. Science. 2001;294:66–67. doi: 10.1126/science.1066237. [DOI] [PubMed] [Google Scholar]
- 18.Malumbres M, et al. To cycle or not to cycle: a critical decision in cancer. Nat. Rev. Cancer. 2001;1:222–231. doi: 10.1038/35106065. [DOI] [PubMed] [Google Scholar]
- 19.Park MT, et al. Cell cycle and cancer. J. Biochem. Mol. Biol. 2003;36:60–65. doi: 10.5483/bmbrep.2003.36.1.060. [DOI] [PubMed] [Google Scholar]
- 20.Li G, et al. Genetic polymorphisms of p21 are associated with risk of squamous cell carcinoma of the head and neck. Carcinogenesis. 2005;26:1596–1602. doi: 10.1093/carcin/bgi105. [DOI] [PubMed] [Google Scholar]
- 21.Zheng Y, et al. Cyclin D1 polymorphism and risk for squamous cell carcinoma of the head and neck: a case-control study. Carcinogenesis. 2001;22:1195–1199. doi: 10.1093/carcin/22.8.1195. [DOI] [PubMed] [Google Scholar]
- 22.Lukas J, et al. WAF1/Cip1 gene polymorphism and expression in carcinomas of the breast, ovary, and endometrium. Am. J. Pathol. 1997;150:167–175. [PMC free article] [PubMed] [Google Scholar]
- 23.Geradts J, et al. Abnormal expression of cell cycle regulatory proteins in ductal and lobular carcinomas of the breast. Mod. Pathol. 2000;13:945–953. doi: 10.1038/modpathol.3880172. [DOI] [PubMed] [Google Scholar]
- 24.Reed W, et al. Elevated levels of p27, p21 and cyclin D1 correlate with positive oestrogen and progesterone receptor status in node-negative breast carcinoma patients. Virchows Arch. 1999;435:116–124. doi: 10.1007/s004280050408. [DOI] [PubMed] [Google Scholar]
- 25.Woloschak M, et al. Frequent loss of the P16INK4a gene product in human pituitary tumors. Cancer Res. 1996;56:2493–2496. [PubMed] [Google Scholar]
- 26.Arber N, et al. Abnormalities in the expression of cell cycle-related proteins in tumors of the small bowel. Cancer Epidemiol. Biomarkers Prev. 1999;8:1101–1105. [PubMed] [Google Scholar]
- 27.Howard A, et al. Synthesis of nucleoprotein in bean root cells. Nature. 1951;167:599–600. doi: 10.1038/167599a0. [DOI] [PubMed] [Google Scholar]
- 28.Pardee AB. A restriction point for control of normal animal cell proliferation. Proc. Natl Acad. Sci. USA. 1974;71:1286–1290. doi: 10.1073/pnas.71.4.1286. [DOI] [PMC free article] [PubMed] [Google Scholar]
- 29.Lesueur F, et al. Single-nucleotide polymorphisms in the RB1 gene and association with breast cancer in the British population. Br. J. Cancer. 2006;94:1921–1926. doi: 10.1038/sj.bjc.6603160. [DOI] [PMC free article] [PubMed] [Google Scholar]
- 30.Ezhevsky SA, et al. Differential regulation of retinoblastoma tumor suppressor protein by G(1) cyclin-dependent kinase complexes in vivo. Mol. Cell Biol. 2001;21:4773–4784. doi: 10.1128/MCB.21.14.4773-4784.2001. [DOI] [PMC free article] [PubMed] [Google Scholar]
- 31.Sherr CJ, et al. CDK inhibitors: positive and negative regulators of G1-phase progression. Genes Dev. 1999;13:1501–1512. doi: 10.1101/gad.13.12.1501. [DOI] [PubMed] [Google Scholar]
- 32.Baynes C, et al. Common variants in the ATM, BRCA1, BRCA2, CHEK2 and TP53 cancer susceptibility genes are unlikely to increase breast cancer risk. Breast Cancer Res. 2007;9:R27. doi: 10.1186/bcr1669. [DOI] [PMC free article] [PubMed] [Google Scholar]
- 33.Pe'er I, et al. Evaluating and improving power in whole-genome association studies using fixed marker sets. Nat. Genet. 2006;38:663–667. doi: 10.1038/ng1816. [DOI] [PubMed] [Google Scholar]
- 34.de Bakker PI, et al. Efficiency and power in genetic association studies. Nat. Genet. 2005;37:1217–1223. doi: 10.1038/ng1669. [DOI] [PubMed] [Google Scholar]
- 35.Stram DO, et al. Choosing haplotype-tagging SNPS based on unphased genotype data using a preliminary sample of unrelated subjects with an example from the Multiethnic Cohort Study. Hum. Hered. 2003;55:27–36. doi: 10.1159/000071807. [DOI] [PubMed] [Google Scholar]
- 36.Tyrer J, et al. The admixture maximum likelihood test: a novel experiment-wise test of association between disease and multiple SNPs. Genet. Epidemiol. 2006;30:636–643. doi: 10.1002/gepi.20175. [DOI] [PubMed] [Google Scholar]
- 37.Freimer NB, et al. Guidelines for association studies in Human Molecular Genetics. Hum. Mol. Genet. 2005;14:2481–2483. doi: 10.1093/hmg/ddi251. [DOI] [PubMed] [Google Scholar]
- 38.Pharoah PD, et al. Association between common variation in 120 candidate genes and breast cancer risk. PLoS Genet. 2007;3:e42. doi: 10.1371/journal.pgen.0030042. [DOI] [PMC free article] [PubMed] [Google Scholar]
- 39.Ohtsubo M, et al. Human cyclin E, a nuclear protein essential for the G1-to-S phase transition. Mol. Cell Biol. 1995;15:2612–2624. doi: 10.1128/mcb.15.5.2612. [DOI] [PMC free article] [PubMed] [Google Scholar]
- 40.Drake JA, et al. Conserved noncoding sequences are selectively constrained and not mutation cold spots. Nat. Genet. 2006;38:223–227. doi: 10.1038/ng1710. [DOI] [PubMed] [Google Scholar]
- 41.Ortega S, et al. Cyclin D-dependent kinases, INK4 inhibitors and cancer. Biochim. Biophys. Acta. 2002;1602:73–87. doi: 10.1016/s0304-419x(02)00037-9. [DOI] [PubMed] [Google Scholar]
- 42.Debniak T. CDKN2A-positive breast cancers in young women from Poland. Breast Cancer Res Treat. 2006;103:355–359. doi: 10.1007/s10549-006-9382-x. [DOI] [PubMed] [Google Scholar]
- 43.Wang SS, et al. Cyclin D1 splice variant and risk for non-Hodgkin lymphoma. Hum. Genet. 2006;120:297–300. doi: 10.1007/s00439-006-0212-3. [DOI] [PubMed] [Google Scholar]
- 44.Stamm S, et al. Function of alternative splicing. Gene. 2005;344:1–20. doi: 10.1016/j.gene.2004.10.022. [DOI] [PubMed] [Google Scholar]
- 45.Stamm S, et al. ASD: a bioinformatics resource on alternative splicing. Nucleic Acids Res. 2006;34:D46–D55. doi: 10.1093/nar/gkj031. [DOI] [PMC free article] [PubMed] [Google Scholar]
- 46.Kanopka A, et al. Inhibition by SR proteins of splicing of a regulated adenovirus pre-mRNA. Nature. 1996;381:535–538. doi: 10.1038/381535a0. [DOI] [PubMed] [Google Scholar]
- 47.Simard MJ, et al. SRp30c is a repressor of 3' splice site utilization. Mol. Cell Biol. 2002;22:4001–4010. doi: 10.1128/MCB.22.12.4001-4010.2002. [DOI] [PMC free article] [PubMed] [Google Scholar]
- 48.Ma H, et al. Variant genotypes of CDKN1A and CDKN1B are associated with an increased risk of breast cancer in Chinese women. Int. J. Cancer. 2006;119:2173–2178. doi: 10.1002/ijc.22094. [DOI] [PubMed] [Google Scholar]
- 49.Pharoah PD, et al. Association studies for finding cancer-susceptibility genetic variants. Nat. Rev. Cancer. 2004;4:850–860. doi: 10.1038/nrc1476. [DOI] [PubMed] [Google Scholar]
Associated Data
This section collects any data citations, data availability statements, or supplementary materials included in this article.