Abstract
Large, complex datasets that are generated from microarray experiments create a need for systematic analysis techniques to unravel the underlying connectivity of gene regulatory networks. A modular approach, previously proposed by Kholodenko and co-workers, helps to scale down the network complexity into more computationally manageable entities called modules. A functional module includes a gene’s mRNA, promoter and resulting products, thus encompassing a large set of interacting states. The essential elements of this approach are described in detail for a three-gene model network and later extended to a ten-gene model network, demonstrating scalability. The network architecture is identified by analyzing in silico steady-state changes in the activities of only the module outputs -communicating intermediates- that result from specific perturbations applied to the network modules one at a time. These steady-state changes form the system response matrix, which is used to compute the network connectivity or network interaction map. By employing a known biochemical network, we are able to evaluate the accuracy of the modular approach and its sensitivity to key assumptions.
Keywords: gene networks, reverse engineering, modular approach, connection coefficients
1. INTRODUCTION
The advent of high-throughput microarray technologies has paved the way for large-scale characterization of the expression of thousands of genes as well as proteins simultaneously on a single chip [1, 2, 4, 5]. These technologies have made it possible to tackle long-standing challenges associated with the study of genetics and complex cellular control systems. Because of the fundamental nature of the biological processes in a living cell, changes in the cellular environment result in the co-regulation and co-expression of many genes and proteins [3]. Proper and efficient analysis of the resulting large number of genomic and proteomic data sets requires the development of robust mathematical algorithms and statistical models. These models help researchers extract valuable information from the large data sets and provide insight into how regulatory information is processed in the living cell by identifying functional roles for the participating genes and proteins.
There are numerous examples of computational modeling applications in the study of biochemical systems [6-12]. One of the earlier methods suggested involves the mechanistic “bottom-up” approach used to build a biochemical network with the data obtained from specially designed experiments [13]. Reaction kinetic parameters, which are required for a kinetic network model, are either obtained from the literature or estimated from appropriate experimental data [12]. The “bottom-up” approach requires that molecular processes be considered exhaustively, resulting in a network structure, which while physically accurate, suffers from two major problems: the need to determine a large number of parameters, and its inability to discover new interactions.
Unlike the “bottom-up” approach, top-down/modular analysis does not require complete information on the molecular interactions and has proven advantageous both for discovering unknown interactions and for estimating unknown kinetic parameters [14, 15]. Such techniques include clustering of genes and other statistical algorithms based on similarity in expression profiles [16-20]. Associations found among genes, however, did not reveal magnitude and direction of functional interactions between them [15]. Methods based on Boolean networks, where genes and proteins are either “ON” or “OFF” have been postulated to reveal the interactions between them [21]. While these approaches reveal the functional interactions qualitatively at a macroscopic level [22], they lack detailed quantitative information on the biochemical reality of cellular regulation [23]. Other steady-state reverse engineering methods include ARACNE [24] and the methods that are based on Dynamic Bayesian Networks (DBN) to quantify the network interactions [25, 26]. The ARACNE method does not require perturbations, but it is less informative and precise than the DBN methods [25, 27]. However, a comprehensive model of chemical reactions that directly provides the structure of a biochemical network is desirable [28].
The present work is based on the so-called “top-down” approach to inferring the network interaction map that was recently proposed [29]. In this approach, the sensitivity analysis is used to relate the output properties of a model biochemical network to the changes in its reaction parameters. These changes in the reaction parameters also known as systemic perturbations are generally applied to mathematical models of gene networks in order to mimic responses that would otherwise have had to be obtained experimentally through the use of antisense RNA to silence specific genes or by introducing an external ligand or an enzyme. Theoretically, perturbations applied to the network are considered to be of infinitesimal size; in practice, they are finite. Similarly, the reverse engineering method proposed in [30] is based on steady state responses to perturbations. This method, however, requires both the size of perturbation applied and the steady state measurements of mRNA concentrations (for an in-depth comparison of methods proposed in [14, 30 and 31] see Ref. [32]).
Our approach is modular (Figure 1), where a functional module is defined as an entity of known/unknown genes, proteins or metabolites, grouped together and internally connected by complex physico-chemical interactions [14, 33]. Without prior knowledge of the network architecture, known species may be grouped in the simplest possible way to form modules. The design of the modules need not be rigid: a module may contain mRNAs of a specific gene or a cluster of genes connected by regulatory elements in the signaling pathway. The modular approach endows the individual network units that execute one or more biological function with functional independence [14, 33]. Although several known and unknown complex inter-modular interactions might exist, only one inter-modular interaction is considered, and therefore only one output/communicating intermediate per module is selected in the present work. In practice, this selection is based on the available experimental data. For a transcript/protein expression profile, mRNA/protein species form the communicating intermediate. Thus, the modular approach reduces the number of species to be assayed without having to be concerned about the intra-modular interactions explicitly [33, 34]. Physically no mRNA directly affects another mRNA and the proteins and metabolites present in the biochemical network function as intermediate agents [29, 35]. Gene networks based on gene expression alone are thus concise representations of various interacting species [15].
Fig. 1.
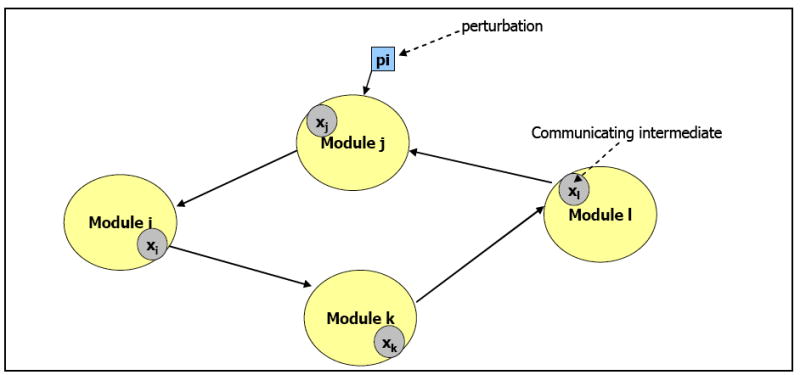
Conceptual representation of the modular approach. Network elements are grouped into four modules: i, j, k & l; the corresponding communicating intermediates are xi, xj, xk and xl respectively
In order to benchmark the modular approach, it is applied to a mechanistic detailed transcript regulatory network [36] (Figure 2). In this model, gene regulation takes place via several transcription factors and proteins in the biochemical network. Figure 2 shows the binding of transcription factors to the promoters and the consequent formation of mRNA through the transcription process, followed by the translation of mRNA to protein. Translated proteins dimerize and then function as transcription factors in the transcriptional regulatory mechanism. This mechanism forms the basic structure of each of the four regulatory motifs, which were assembled to construct the ten-gene network. For instance, the dimer D2 activates the promoter of gene E (PE) to form the dimer-promoter complex D2-PE, which facilitates the formation of the transcript ME. In another instance, the ligand bound to protein E activates the promoter of gene F and forms the active promoter of gene F (EQ-PF), which in turn helps in the formation of the transcript MF. Each regulatory motif in the network is a cluster of two to four interacting genes whose topology and reaction parameters were obtained from the literature. The four regulatory motifs used in the construction of the ten-gene network were: (a) gene cascade, (b) mutual repression, (c) auto-activation and sequestration, and (d) agonist-induced receptor down-regulation.
Fig. 2.
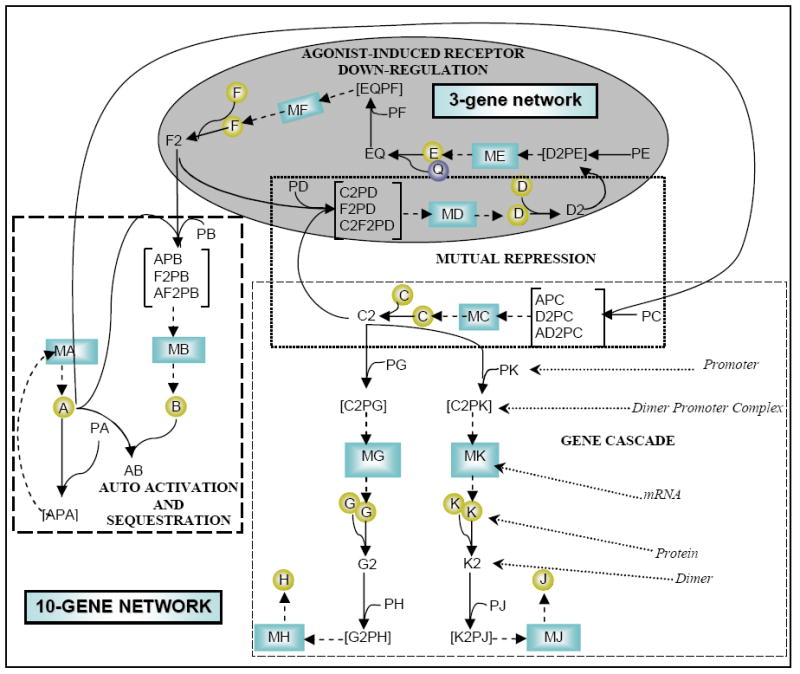
Topology of a ten-gene regulatory, metabolic network, published in [24], used to illustrate the modular approach. The irreversible transcription and translation reactions are represented with dashed arrows and perturbations were applied to these processes. Reversible dimerization and promoter binding reactions are represented with solid arrows. The highlighted area contains three genes that form a three-gene network.
In our benchmarking study, we were interested in the scalability and accuracy of the modular approach. To test scalability, we first implemented the approach using the agonist-induced receptor down-regulatory motif (shaded region in Figure 2), which is a network of three genes and a subset of the full network. Subsequently, we applied the approach to the complex ten-gene regulatory network and identified the conditions under which the majority of the interconnections could be uncovered. For cases where the modular approach was unsuccessful, we sought the root cause and provide guidelines for its general application. Since the true underlying network was known for these in silico networks, it was possible to estimate the accuracy of the reverse engineering approach. Benchmarking the modular analysis in this way is an important step that will aid the interpretation of results obtained from applying it to experimental data. Although detailed gene regulatory networks have been published for some systems [3, 46, 47], it is impossible to be certain whether the inferred network matches the true underlying network without extensive experimental validation. For this reason, we feel that computational benchmarking plays an indispensable role in the development and application of the modular approach.
2. METHODS
2.1. Modularization of the gene regulatory network and selection of the communicating intermediates
An application of the modular approach to the agonist–induced receptor down-regulatory motif resulted in the three modules shown in Figure 3. In our modular design, a functional module consisted of a gene, its promoter, and products (transcription factors). The species, once grouped into specific modules, were not repeated in other modules. mRNA and protein species from each module was selected one at a time as a module output/communicating intermediate. Mass flow between the communicating intermediates was considered to be negligible. A system of differential equations consisting of 12 variables and 32 parameters (Appendix 5.1 and 5.2) was used to simulate the dynamic behavior of a three-gene motif. Subsequently, the modular approach was applied to a larger ten-gene regulatory network.
Fig. 3.
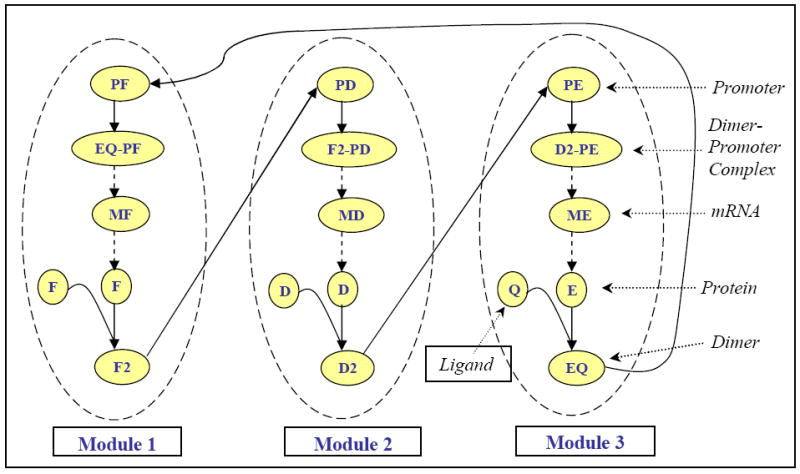
Modular scheme of a three-gene regulatory network
2.2. Calculation of a local response matrix/network interaction map
Initial conditions for all the variables in the model biochemical system were defined and then the system was allowed to reach equilibrium. A biochemical network, when perturbed, attains a new steady state different from the one before perturbation. Therefore, steady state activities of the communicating intermediates were computed to have reference activities before the application of perturbation. The reaction rates were changed by 10% (in practice, such finite perturbations are feasible as opposed to infinitesimal perturbations) to simulate the experimental perturbations. The number of perturbations was always equal to the number of communicating intermediates in the present work. Following this, the new steady state activities of the communicating intermediates were computed. The fractional changes in the steady state of the communicating intermediates before and after the application of perturbation were calculated using equation 1 to obtain the system response matrix.
System response matrix
| (1) |
where is the activity of the communicating intermediate after the perturbation and is the activity of the communicating intermediate prior to the perturbation. These values form the column of matrix Rp (Δilnx1… Δilnxm)T and characterize the response of the entire system to the parameter perturbation of a specific module. Equation 2 was applied to the Rp matrix to obtain the network interaction map/r-matrix.
Local response matrix
| (2) |
The elements of the r-matrix are dimensionless coefficients obtained from the Jacobian matrix normalized by its diagonal elements [29]. Thus the r-matrix contains only the first-order sensitivities and biologically it represents the direct effect of one communicating intermediate on the other, with the remaining species mediating in the network module. Each coefficient rij quantifies the strength and nature (stimulatory/inhibitory) of the corresponding network interaction, and when ∣ rij ∣ ≥ 0.1 the interaction is considered to be significant.
2.3. In silico testing of the predicted network
The network interaction map was determined on the basis of finite parameter perturbation applied to each of the network modules. We tested the accuracy of this prediction against the known (“theoretical”) interaction map r. The connection coefficient rij quantifies the fractional change (Δxi/ xi) in the activity of communicating intermediate xi of module i brought about by the change (Δxj/ xj) in the activity of communicating intermediate xj of module j (in the limit of infinitesimal changes) when modules i and j are conceptually considered in isolation of the network [14]. Using this definition, the coefficients rij were calculated by applying a 1% perturbation to communicating intermediate xj [14].
3. CASE STUDIES
3.1. Three-gene network
In the first case study, the reverse engineering method was applied to a three-gene model. Two scenarios were simulated in our in silico studies: (1) assuming that gene expression data (mRNA concentrations) were monitored experimentally, the network was conceptually modularized with mRNA species as communicating intermediates, and perturbations were applied to mRNA degradation rate constants; and (2) assuming that protein expression data were monitored experimentally, protein species were considered as communicating intermediates in the modularized scheme, and protein degradation rate constants were perturbed. In either case, a finite perturbation of 10% increase in magnitude was applied. The network interconnections recovered for the two scenarios after applying the reverse engineering approach are shown in Tables 1a and b. The perturbation effect of a gene on the remaining genes is illustrated by the r-values down the column corresponding to that gene in the 3×3 interaction map. For example, in the case where mRNA levels were used, module D had an inhibitory effect on module E (r-value = -0.92), while module D had no effect on module F (r-value ~ 0). In both scenarios, similar results were obtained: we found that module D inhibited module E, module E stimulated module F, and module F stimulated module D. The directionality of these interactions was in agreement with the topology of the true network. Furthermore, the interaction magnitudes that we recovered were very close to the theoretical values (Table 1c). Details for computing the theoretical r-values are given in Appendix 5.3. These results demonstrate that the modular reverse engineering approach described above successfully identified the three-gene network for the two scenarios considered using 10% perturbations.
Table 1a.
Three-gene interaction map for the simulated scenario in which mRNA species were considered as communicating intermediates and 10% perturbations were applied to their degradation rate constants. X-axis corresponds to regulating modules and y-axis corresponds to regulated modules.
| mRNA | MD | ME | MF |
|---|---|---|---|
| MD | -1.00 | 0.00 | 0.81 |
| ME | -0.92 | -1.00 | 0.00 |
| MF | 0.00 | 0.92 | -1.00 |
Table 1b.
Three-gene interaction map for the simulated scenario in which protein species were considered as communicating intermediates and 10% perturbations were applied to their degradation rate constants. X-axis corresponds to regulating modules and y-axis corresponds to regulated modules.
| Protein | D | E | F |
|---|---|---|---|
| D | -1.00 | 0.00 | 0.71 |
| E | -1.66 | -1.00 | 0.00 |
| F | 0.00 | 0.59 | -1.00 |
Table 1c.
Comparison of the r-values computed using the reverse engineering approach (c.v) with the theoretical r-values (t.v)
| RNA | c.v | t.v |
|---|---|---|
| rMD-MF | 0.81 | 0.79 |
| rME-MD | -0.92 | -0.90 |
| rMF-ME | 0.92 | 0.91 |
| Protein | c.v | t.v |
| rD-F | 0.71 | 0.69 |
| rE-D | -1.66 | -1.64 |
| rF-E | 0.59 | 0.59 |
3.2. Ten-gene network
Following the three-gene network example, we simulated scenarios for the ten-gene network for which both mRNA and protein data were assumed to be available experimentally, and the modules and communicating intermediates were defined accordingly. As before, perturbations to the communicating intermediate degradation rate constant were considered experimentally accessible and perturbations of magnitude 10% increase were applied. The interactions maps recovered for both the scenarios are shown as 10×10 matrices in Tables 2a and b. Computations of theoretical r-values were performed in the same manner as for the three-gene network. The r-values computed using the reverse engineering algorithm was very close to theoretical values, as shown in Table 2c for the case where mRNA species were used as communicating intermediates.
Table 2a.
Ten-gene interaction map for the simulated scenario in which mRNA species were considered as communicating intermediates and 10% perturbations were applied to their degradation rate constants. X-axis corresponds to regulating modules and y-axis corresponds to regulated modules.
| MA | MB | MC | MD | ME | MF | MG | MH | MJ | MK | |
|---|---|---|---|---|---|---|---|---|---|---|
| MA | -1.00 | -0.07 | 0.00 | 0.00 | 0.00 | 0.00 | 0.00 | 0 | 0 | 0.00 |
| MB | 0.07 | -1.00 | 0.00 | 0.01 | 0.00 | 0.66 | 0.00 | 0 | 0 | 0.00 |
| MC | 0.37 | -0.15 | -1.00 | -0.65 | 0.00 | -0.01 | 0.00 | 0 | 0 | 0.00 |
| MD | 0.00 | 0.00 | 0.00 | -1.00 | 0.00 | 0.79 | 0.00 | 0 | 0 | 0.00 |
| ME | 0.00 | 0.00 | 0.00 | -0.96 | -1.00 | 0.00 | 0.00 | 0 | 0 | 0.00 |
| MF | 0.00 | 0.00 | 0.00 | 0.00 | 0.92 | -1.00 | 0.00 | 0 | 0 | 0.00 |
| MG | 0.00 | 0.00 | -0.91 | 0.00 | 0.00 | 0.00 | -1.00 | 0 | 0 | 0.00 |
| MH | 0.00 | 0.00 | 0.02 | 0.00 | 0.00 | 0.00 | -0.76 | -1.00 | 0 | 0.00 |
| MJ | 0.00 | 0.00 | 0.02 | 0.01 | 0.00 | 0.00 | 0.00 | 0 | -1.00 | 0.40 |
| MK | 0.00 | 0.00 | -0.91 | 0.00 | 0.00 | 0.00 | 0.00 | 0 | 0 | -1.00 |
Table 2b.
Ten-gene interaction map for the simulated scenario in which protein species were considered as communicating intermediates and 10% perturbations were applied to their degradation rate constants. X-axis corresponds to regulating modules and y-axis corresponds to regulated modules. One can see the r-values representing the mutual repression of protein species A and B in blue and purple boxes.
| A | B | C | D | E | F | G | H | J | K | |
|---|---|---|---|---|---|---|---|---|---|---|
| A | -1.00 | -0.58 | 0.00 | 0.01 | 0.00 | 0.00 | 0.00 | 0 | 0 | 0.00 |
| B | -0.93 | -1.00 | 0.00 | 0.00 | 0.00 | 1.10 | 0.00 | 0 | 0 | 0.00 |
| C | 0.09 | 0.00 | -1.00 | -0.62 | 0.00 | 0.00 | 0.00 | 0 | 0 | 0.00 |
| D | 0.00 | 0.00 | 0.00 | -1.00 | 0.00 | 0.73 | 0.00 | 0 | 0 | 0.00 |
| E | 0.00 | 0.00 | 0.00 | -1.65 | -1.00 | 0.00 | 0.00 | 0 | 0 | 0.00 |
| F | 0.00 | 0.00 | 0.00 | 0.00 | 0.58 | -1.00 | 0.00 | 0 | 0 | 0.00 |
| G | 0.00 | 0.00 | -0.97 | 0.00 | 0.00 | 0.00 | -1.00 | 0 | 0 | 0.00 |
| H | 0.00 | 0.00 | 0.01 | 0.00 | 0.00 | 0.00 | -1.32 | -1.00 | 0 | 0.00 |
| J | 0.00 | 0.00 | 0.01 | 0.00 | 0.00 | 0.00 | 0.00 | 0 | -1.00 | 0.67 |
| K | 0.00 | 0.00 | -0.97 | 0.00 | 0.00 | 0.00 | 0.00 | 0 | 0 | -1.00 |
Table 2c.
Comparison of theoretical (top number in the box) and calculated (bottom number in the box) r-values of the ten-gene regulatory network with mRNA species as the communicating intermediates.
| MA | MB | MC | MD | ME | MF | MG | MH | MJ | MK | |
|---|---|---|---|---|---|---|---|---|---|---|
| MA | -1 | -0.08 | 0 | 0 | 0 | 0 | 0 | 0 | 0 | 0 |
| -1 | -0.07 | 0 | 0 | 0 | 0 | 0 | 0 | 0 | 0 | |
| MB | 0.06 | -1 | 0 | 0 | 0 | 0.66 | 0 | 0 | 0 | 0 |
| 0.07 | -1 | 0 | 0 | 0 | 0.66 | 0 | 0 | 0 | 0 | |
| MC | 0.32 | -0.18 | -1 | -0.65 | 0 | 0 | 0 | 0 | 0 | 0 |
| 0.37 | -0.15 | -1 | -0.65 | 0 | 0 | 0 | 0 | 0 | 0 | |
| MD | 0 | 0 | 0 | -1 | 0 | 0.77 | 0 | 0 | 0 | 0 |
| 0 | 0 | 0 | -1 | 0 | 0.79 | 0 | 0 | 0 | 0 | |
| ME | 0 | 0 | 0 | -0.95 | -1 | 0 | 0 | 0 | 0 | 0 |
| 0 | 0 | 0 | -0.96 | -1 | 0 | 0 | 0 | 0 | 0 | |
| MF | 0 | 0 | 0 | 0 | 0.92 | -1 | 0 | 0 | 0 | 0 |
| 0 | 0 | 0 | 0 | 0.92 | -1 | 0 | 0 | 0 | 0 | |
| MG | 0 | 0 | -0.91 | 0 | 0 | 0 | -1 | 0 | 0 | 0 |
| 0 | 0 | -0.91 | 0 | 0 | 0 | -1 | 0 | 0 | 0 | |
| MH | 0 | 0 | 0 | 0 | 0 | 0 | -0.76 | -1 | 0 | 0 |
| 0 | 0 | 0 | 0 | 0 | 0 | -0.76 | -1 | 0 | 0 | |
| MJ | 0 | 0 | 0 | 0 | 0 | 0 | 0 | 0 | -1 | 0.38 |
| 0 | 0 | 0 | 0 | 0 | 0 | 0 | 0 | -1 | 0.40 | |
| MK | 0 | 0 | -0.91 | 0 | 0 | 0 | 0 | 0 | 0 | -1 |
| 0 | 0 | -0.91 | 0 | 0 | 0 | 0 | 0 | 0 | -1 |
For the simple three-gene network, the entire network interaction map was identified accurately. For the more complex ten-gene network, however, some of interactions were identified incorrectly. For example, when mRNA measurements were considered (Table 2a), the regulatory effect of module A on module B was very weak and insignificant using our threshold (r < 0.1). In the actual network, module A positively regulates module B. Also an inhibitory effect of module B on module C with connectivity strength of -0.15 was observed (Table 2a), when in fact module B does not directly regulate module C. Lastly, the effect of module C on module D was not significant (r < 0.1), when in reality modules C and D are co-repressive. These results demonstrate that the reverse engineering approach may not identify network interactions accurately when applied to systems as complex as the ten-gene network. The following sections examine the causes of the incorrect interactions and identify possible remedies.
3.2.1 Violation of assumptions by unknown protein-protein interactions
Following the modular design, a gene, its promoter and products were grouped into a functional module. However, while grouping known network species, certain a-priori unknown hetero-dimers that are formed by protein products of two different genes were not considered. In the ten-gene regulatory network analyzed, the hetero-dimer AB is a product of two genes A and B. Since the presence of the hetero-dimer AB was not known and hence not taken into consideration, this led to a marked difference between the connection-coefficients of mRNAs and proteins for modules A and B. On the contrary, if the presence of the hetero-dimer AB was known, we could include both genes A and B and their products into a single module. The development of a network inference approach that could determine a-priori which measurements are derived from hetero-dimers in a single module or involve hetero-dimers between the proteins of separate modules would be an important achievement for the Systems Biology.
It follows from Table 2a that gene A had a weak stimulatory effect on gene B (rBA = 0.07). Therefore, an increase in the concentration of protein A should increase the concentration of protein B. However, we observed in Figure 4 that as the concentration of protein A increased, the concentration of protein Bfree (freely available concentration of protein B in the system), did not change initially, but eventually decreased. The interpretation of this process and the cause of the weak regulatory strength of module A on module B is as follows: With increasing concentration of protein A, the concentration of dimer AB increased while the concentration of protein Btotal (sum of freely available concentration of protein B and dimer AB) and Bfree remained constant (Figure 4). The initial concentration of protein A might have been so small that the amount of protein B that was utilized in the formation of the AB dimer was negligible. Subsequently, the concentration of dimer AB stabilized and that of Btotal continued to be constant, while amount of protein Bfree decreased. This shows that protein Bfree was incorporated in the formation of dimer AB, and thus explains the constant formation of dimer AB. It is important to note that the concentration of protein Btotal remained constant throughout. This reveals a special case where the entire promoter region of gene B could have been saturated with the transcription factor A and thus an additional amount of protein A did not increase the transcription rate of protein B. Due to this steady concentration of protein Btotal, the strength of this interaction was not significant. Moreover, a significant interaction between protein states A and B, which was evident from a protein interaction map, strengthened the prediction of an unknown molecule, which in this case was a hetero-dimer AB. It was observed that with protein molecules as the communicating intermediates, module A inhibited module B with a regulatory strength of -0.93 and module B inhibited module A with a regulatory strength of −0.58 (Table 2b).
Fig. 4.
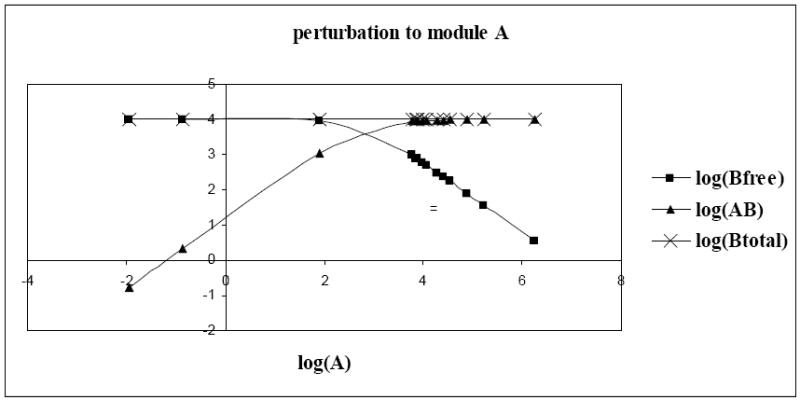
Effect of increasing concentration of protein A on hetero-dimer AB, freely available protein B [Bfree] and the total amount of B in the system [Btotal = Bfree + AB]
Applying perturbations to module B, the concentrations of protein B, Afree (freely available protein A in the system), AB and Atotal (Atotal = Afree + AB + APA) can be quantified. As the concentration of protein B increased, more and more of protein Afree was aggregated for the AB complex (Figure 5). Hence, we initially noticed an increase in the concentration of AB and a decrease in the concentration of Afree. Subsequently however, the amount of free protein A decreased along with a decline in the concentration of AB complex. The amount of protein A used in the formation of AB complex might have been significant enough, thus limiting its self-activation i.e. a negligibly small concentration of protein-promoter complex (APA). The sharp transition from one saturated state to another of the promoter of gene A (Figure 6) explained the total concentration reduction of protein A. Switching the promoter of gene A from a saturated active state to a complete inactive state, limited the formation of AB complex and gave rise to a negative r-value. We noticed that the mRNA interaction map was inadequate to quantify the network connectivity but the protein interaction map greatly added to the information. Extrapolation of the protein expression levels from the experimentally acquired and quantified mRNA data is not feasible [37]. In conclusion, analyzing both mRNA and protein expression data provided a better insight to the network connectivity [38].
Fig. 5.
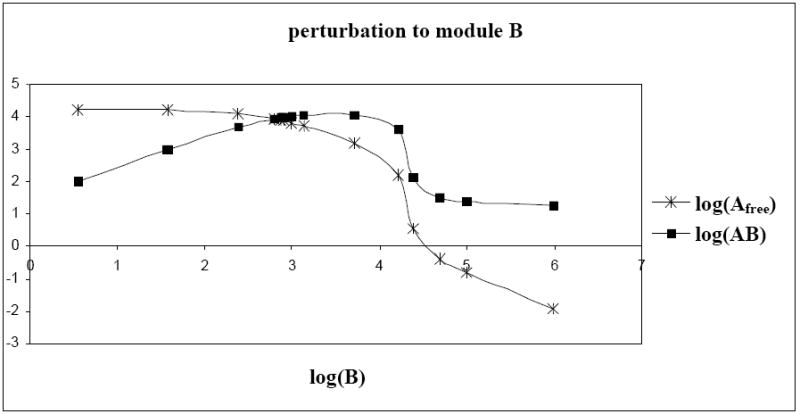
Effect of increasing concentration of protein B on protein Afree (freely available protein A in the system) and hetero-dimer AB
Fig. 6.
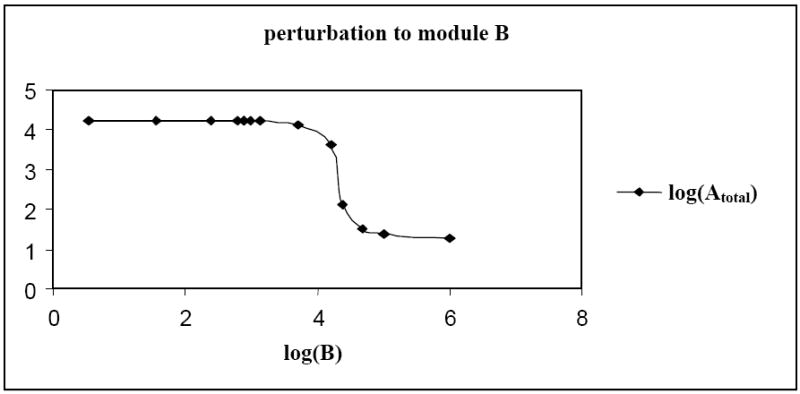
Effect of increasing concentration of protein B on the total amount of protein A in the system
3.2.2. Detection of an indirect interaction
From the previous discussion, we know that module B has an inhibitory effect on module A and the calculated interaction map illustrated that module A has a stimulatory effect on module C. Combining both of these effects; module B might have an inhibitory effect on module C (Figure 7). An indirect interaction between modules B and C from the mRNA interaction map with a regulatory strength of -0.15 was observed, i.e. B influenced C only through its influence on A (Table 2a).
Fig. 7.
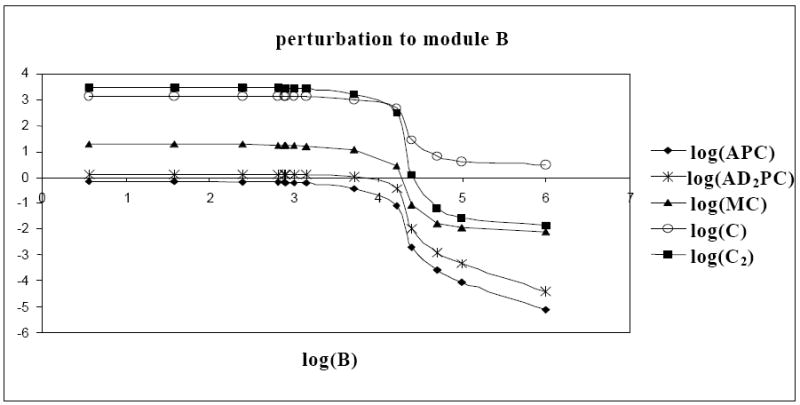
Effect of increasing concentration of protein B on states of module A and C
3.2.3. Variation of the perturbation size helps unravel network interactions
In gene networks, saturation of the promoter regions by transcription factors might require large perturbation magnitudes to see detectable changes in the network responses. For instance, connections between modules C and D in the ten-gene regulatory network could be revealed by application of large perturbations. Indeed, from the known model, it is apparent that modules C and D are mutually repressive. However, the r-value indicating the effect of module C on module D was not consistent with the known model (Table 2a and 2b) i.e., the perturbation to module C did not reveal its direct effect on module D. When analysis at the molecular level was done, it was observed that the concentrations of protein C and dimer C2 increased with increasing concentration of MC (Figure 8). However, the concentrations of mRNA MD and protein D remained constant. Also, it was observed that with an increase in the concentration of mRNA MC, the concentration of dimer-promoter complex C2PD increased exponentially and reached the saturation value of two (due to saturation of the promoter region of gene D, Figure 9).
Fig. 8.
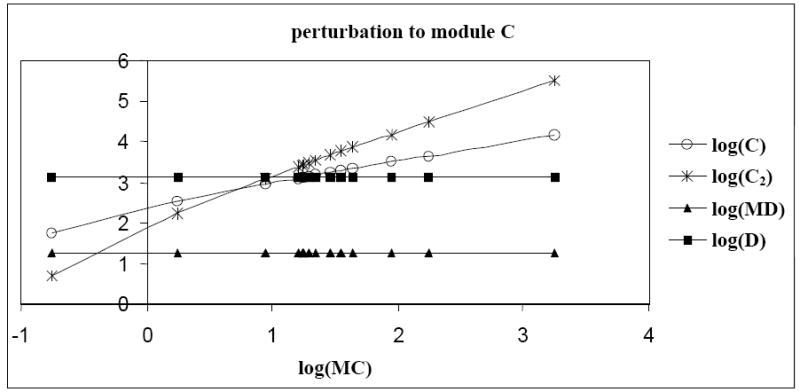
Effect of increasing concentration of mRNA MC on protein C, dimer C2, mRNA MD and protein D
Fig. 9.
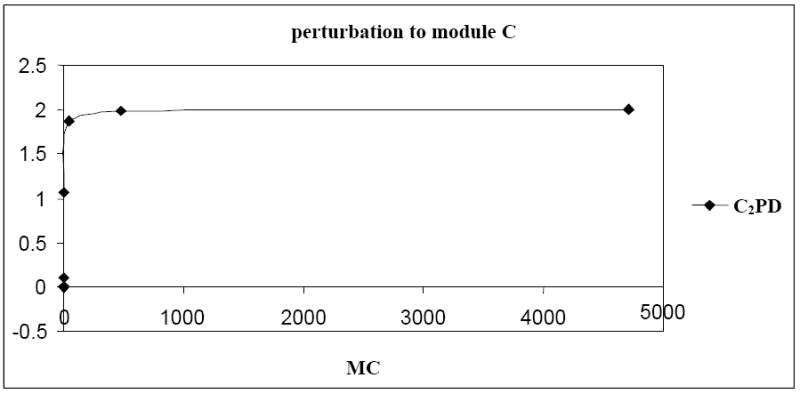
Saturation at the promoter region of gene D
The hypothesis made was that gene D might be regulated by many other genes and as a result its promoter region was getting saturated. To test this effect, C and D modules were separated from the larger ten-gene network and perturbation size ranging from 1 to 99% decrease in mRNA degradation rate constant was applied. As the magnitude of perturbation increased to 99% (reduction in mRNA degradation rate constant), the response co-efficient increased to -0.36 (Table 3).
Table 3.
Sensitivity of module D to a range of perturbations applied to module C
| % Perturbation applied to module C | Sensitivity of module D |
|---|---|
| 99% increase | -0.0009 |
| 95% increase | -0.0010 |
| 90% increase | -0.0010 |
| 85% increase | -0.0010 |
| 50% increase | -0.0012 |
| 10% increase | -0.0015 |
| 01% increase | -0.0016 |
| 01% decrease | -0.0016 |
| 10% decrease | -0.0018 |
| 50% decrease | -0.0034 |
| 85% decrease | -0.0164 |
| 90% decrease | -0.0285 |
| 95% decrease | -0.0703 |
| 99% decrease | -0.3668 |
This behavior was understood by considering the differential equations that governed the transcription reaction of transcript MD in the C and D module sub-network (equation 3) as well as in the large ten-gene model network (equation 4).
| (3) |
| (4) |
In the sub-network, the promoter of gene D shifts from an unbound state (PD) to a bound state (C2PD) and the transcription rate constants were kRPD = 0.00073 and kRC2PD = 0. If kRC2PD < kRPD, dimer C2 represses the formation of mRNA MD. Because there is only a slight difference between the rate constant values, we observed sensitivity of module D to extremely high perturbations subjected to module C. However, in case of the large ten-gene regulatory network, the promoter of D shifts from a dimer-promoter bound level of F2PD to C2F2PD and the transcription rate constants are kRF2PD = 0.73 and kRC2F2PD = 0.73. Since there is no change in the rate constant values, sensitivity of module D was not observed for any magnitude of perturbation to module C. Therefore, the invisibility of the C-D interaction in the large ten-gene network was due to multiple regulations of gene D and saturation of its promoter region.
4. DISCUSSION
In engineering systems, complexity involving redundancy, feedback loops and modular organization provides robustness, stability and reliability [13]. The analysis and prediction of the behavior of complex biological systems analogous to such engineering systems requires understanding molecular level properties and interactions [34]. High-throughput experimental datasets reveal the effects of lower level molecular mechanisms on cellular function [15]. Thus scalable and accurate computational models that predict network interactions from the high-throughput experiments are required. Biological network models have generally been based on mathematical frameworks that describe topological connections [3, 15, 39, 40], or describe the complete dynamic behavior of the system [8, 12]. The former approach is often based on correlations between expression profiles and is typically unable to determine the strength and direction of network interactions. The latter is often formulated in terms of differential equations with the objective of integrating experimental data with the models to quantitatively unravel network properties [41].
An “unraveling” algorithm based on sensitivity analysis combined with modularization concepts was recently proposed to quantify the strength of network connections from experimental data [14, 29, 31]. The output of the algorithm is interaction map/network connectivity, with elements that represent the direct effect of one network species on another when subject to individual perturbations and holding the concentrations of the remaining network species constant. In an experimental setting, errors in inferred network connectivity matrix/interaction maps may arise from data limitations, violations of the reverse engineering assumptions, or insufficient network perturbations. To gain an understanding of these sources of error, we performed in silico benchmarking studies. We investigated both the accuracy of the inferred interactions as well as scaling properties by applying the modular approach to realistic gene regulatory network models of varying complexity, specifically three-gene ten-gene regulatory networks described in [36].
The interaction map of the three-gene network was obtained accurately. Importantly, interactions of similar strength and directionality were obtained regardless of whether protein or mRNA species were used as communicating intermediates. While most of the network interconnections were successfully recovered for the more complex ten-gene network, some limitations of the reverse engineering method were also revealed. We found that our ability to reverse engineer the network was strongly influenced by promoter saturation, a phenomenon in which small variations in transcription factor levels no longer lead to changes in transcription initiation rates. This is a direct result of the non-linear nature of transcriptional regulation that involves recruitment of the Pol II complex to transcription factor bound promoters. When increasing a transcription factor concentration only marginally increases its probability of promoter binding, it will have a marginal effect on the target gene transcription rate. In the ten-gene model, increasing the concentration of protein A did not markedly change the total concentration of protein B, giving rise to an insignificant inferred A-B regulatory interaction strength when mRNA levels were used as communicating intermediates. Interestingly, when protein levels were used as communicating intermediates, a mutual repression of modules A and B was inferred, which led to the correct prediction of the AB hetero-dimer. These results demonstrate that transcript and protein interaction maps would serve complementary roles in the modular analysis. Promoter saturation also had an interesting impact on genes with multiple regulatory inputs, given that saturation with respect to one regulator may conceal its regulation by others. In the mutual repression motif (C and D modules) of the ten-gene network, module D was not sensitive to perturbations in module C, regardless of the perturbation magnitude, when the dimer F2 was present in high concentrations. Only by decoupling these modules from the complete network did it become possible to unravel their co-repressive interaction. Yet even in this case it was necessary to apply very large perturbations to module C to observe any response in module D. This result also illustrates the potential importance of large perturbations for generating detectable responses, even though the modular approach was derived for the theoretical case of infinitesimal perturbations. Additionally, the implementation of large perturbations may provide some robustness to measurement noise, given that larger responses will be easier to distinguish from background variation.
The aim of our paper was to examine the scalability and accuracy of the reverse engineering method by performing in silico benchmark analyses. It was instructive to consider the noise-free case, since this represents the “ideal” situation. A natural extension of this work is to perform additional in silico benchmark studies using models that address the stochastic nature of gene expression [36], as well as studies including simulated measurement noise. In these cases, noise-robust variations on the current modular approach [35] will be suitable. Furthermore, the application of the reverse engineering approach presented here to experimental systems for which a large number of regulatory interactions are known a’ priori would be a productive area for future work. In particular, compendiums of expression profiles for single gene knockouts [48], transcriptional network structures [3, 46], and partial protein-protein interaction network data [49] are available for the model organism Saccharomyces cerevisiae and present excellent opportunities for reverse engineering studies. The use of expression data from knockout perturbations that cover a small fraction of the genome, as opposed to the genome-wide finite perturbations considered here, and the formation of network modules from incomplete interaction data, however, present additional theoretical challenges for the modular reverse engineering approach that remain to be addressed. Additionally, the modular approach may inspire experimental designs that seek system-wide finite perturbations and therefore yield data more amenable to reverse engineering, as opposed to being restricted to datasets collected for other purposes. Through additional generalization of our method, and the collection of experimental data designed with reverse engineering in mind, we expect the modular reverse engineering approach will be fruitfully utilized in many future applications.
Acknowledgments
We gratefully acknowledge the Greater Philadelphia Bioinformatics Alliance for funding this project through the graduate level internship award. This work was supported by Grant GM59570 from the National Institute of Health, the Daniel Baugh Institute for Functional Genomics and Computational Biology at Thomas Jefferson University and the School of Biomedical Engineering and Health Sciences at Drexel University.
APPENDIX
5.1) Table 5: Parameters in the ten-gene regulatory network (p = proteins, t = transcripts, m = molecules, c = cell) [11, 42-45].
| Parameter | Value with units | value with units |
|---|---|---|
| Transcription rate constant | t/p/minute | 1/second |
| kRPA, kRPC, kRPD, kRPF, kRC2PG, kRPJ, kRC2PK | 7.3×10⁻⁴ | 1.22×10⁻⁵ |
| kRAPA, kRAF2PB, kRAPC, kRF2PD, kRC2F2PD, KREQPF, kRPG, kRK2PJ, kRPK | 7.3×10⁻¹ | 1.22×10⁻² |
| kRPE, kRPH | 4.2×10⁻³ | 7×10⁻⁵ |
| KRPB | 3.6×10⁻⁴ | 6×10⁻⁶ |
| KRAPB | 3.6×10⁻² | 6×10⁻⁴ |
| kRF2PB | 3.6×10⁻¹ | 6×10⁻³ |
| kRD2PC, kRC2PD | 0 | 0 |
| kRAD2PC | 7.3×10⁻² | 1.22×10⁻³ |
| kRD2PE | 4.2×10⁻⁷ | 7×10⁻⁹ |
| Transcript degradation rate constant | 1/minute | 1/second |
| kDMA, kDMC, kDMD, kDMF, kDMG, kDMK | 3.1×10⁻² | 5.1×10⁻⁴ |
| KDMB | 1.1×10⁻² | 1.8×10⁻⁴ |
| kDME | 1.4×10⁻³ | 2.3×10⁻⁵ |
| kDMH | 4.8×10⁻⁴ | 8×10⁻⁶ |
| kDMJ | 9.7×10⁻³ | 1.62×10⁻⁴ |
| Translation rate constant | p/t/minute | 1/second |
| KTA, kTC, kTD, kTF, kTG, kTK | 2.5 | 4.17×10⁻² |
| KTB | 1.2 | 2×10⁻² |
| KTE, kTH | 18.9 | 3.15×10⁻¹ |
| KTJ | 24.5 | 4.08×10⁻¹ |
| Protein degradation rate constant | 1/minute | 1/second |
| KDA, kDC, kDegD, kDF, kDG, kDK | 6.6×10⁻³ | 1.1×10⁻⁴ |
| KDB | 2.9×10⁻³ | 4.83×10⁻⁵ |
| KDE | 7.8×10⁻⁴ | 1.3×10⁻⁵ |
| KDH | 1.6×10⁻⁴ | 2.67×10⁻⁶ |
| KDJ | 7.7×10⁻³ | 1.28×10⁻⁴ |
| Dimer association rate constant | c/m/minute | 1/ (nM * sec) |
| kC2, kD2, kF2, kG2, kK2, kAB | 5.9×10⁻³ | 7.4×10⁻³ |
| KEQ | 2.4×10⁻³ | 3×10⁻³ |
| Dimer dissociation rate constant | 1/minute | 1/second |
| kUC2, kUD2, kUF2, kUG2, kUK2, kUAB | 3.8 | 6.3×10⁻² |
| KUEQ | 3.6 | 6×10⁻² |
| Dimer degradation rate | 1/minute | 1/second |
| kDC2, kDD2, kDF2, kDEQ, kDG2, kDK2, kDAB | 6.6×10⁻³ | 1.1×10⁻⁴ |
| Promoter-transcription factor association rate constant | c/m/minute | 1/ (nM * sec) |
| kPA, kPB, kPC, kPD, kPG, kPK, kPE, kPF, kPH, kPJ | 7.5×10⁻⁴ | 9.4×10⁻⁴ |
| Promoter-transcription factor dissociation rate constant | 1/minute | 1/second |
| kUPA, kUPB, kUPC, kUPD, kUPG, kUPK, kUPE, kUPF, kUPH, kUPJ | 0.39 | 6.5×10⁻³ |
Ligand concentration, Q = 2 molecules/cell or 2.66×10⁻² nM
Total number of promoters per gene, PT = 2
Avogadro’s number: 6.02*1023 molecules/mole
Assumed cell volume: 125 μm3/cell = 125*10-18 m3/cell = 1.25*10-13 Liters/cell since 1M = 1 mole/Liter, 1 cell/ (molecule*minute) = 1.2542*109 1/ (M*sec)
5.2.1) Differential Equations of the three-gene regulatory network.
| Transcripts | |
|
| |
|
| |
|
| |
| Proteins | |
|
| |
|
| |
|
| |
| Dimers/Heterodimers | |
|
| |
|
| |
|
| |
| Bound Promoters | |
|
| |
|
| |
|
|
5.2.2) Applying the modular design, the differential equations of the three-gene network.
| Module 1 | |
|
| |
|
| |
|
| |
|
| |
| Module 2 | |
|
| |
|
| |
|
| |
|
| |
| Module 3 | |
|
| |
|
| |
|
| |
|
|
where, ME, MF and MD are the mRNAs, EQPF, F2PD and D2PE are the bound promoters, EQ, F2 and D2 are hetero-dimer and dimers, E, F and D are proteins, kDME, kDMF and kDMD are mRNA degradation rate constants, kRPE, kRDPE, kRPF, kREQPF and kRFPD are transcription rate constants, kEQ, kF2 and kD2 are dimerization and heterodimerizatiuon rates, kDegD, kDE and kDF are protein degradation rates, kTD, kTE and kTF are translation rates, kUD2, kUF2 and kUEQ are undimerization and unheterodimerization rates, kDD2 , kDF2 and kDEQ are dimer and heterodimer degradation rates, kPD, kPE and kPF are promoter binding rates, kUPD, kUPE and kUPF are promoter unbinding rates, Q is a ligand and PE, PD and PF are promoters.
5.3) In silico testing of a gene regulatory network
Theoretically, we quantify the inter-modular connections in terms of fractional changes (Δxi/ xi) in the activity of communicating intermediate (xi) of a particular module (i) brought about by an infinitesimal change in the activity (xj) of another module (j), when activities of all other modules (xk, k ≠ i, j) are assumed to be fixed and the affected module (i) is allowed to reach equilibrium. The ratio of the change in mRNA concentration in module i over module j gives the theoretical r-value for that particular modular interaction. The perturbation size applied is 1% change in the activity of the communicating intermediate and this analysis was performed on both the three- and ten-gene regulatory networks. An example of application of this in silico testing on two modules of a model three-gene network is shown below:
Consider the modules D and E of the model three-gene regulatory network:
Apply disturbance to module D i.e. 1% increase in concentration of state MD. Fix all the other communicating intermediates except state ME. Relax rest of the states in the network. Observe the percentage change in concentration value of state ME.
This tested value is very close the calculated r-value of -0.92.
References
- 1.Joos L, Eryüksel E, Brutsche MH. Functional genomics and gene micro arrays – the use in research and clinical medicine. Swiss Med Wkly. 2003;133:31–38. doi: 10.4414/smw.2003.10007. [DOI] [PubMed] [Google Scholar]
- 2.Xiang CC, Chen Y. cDNA microarray technology and its applications. Biotechnology Advances. 2000;18:35–46. doi: 10.1016/s0734-9750(99)00035-x. [DOI] [PubMed] [Google Scholar]
- 3.Lee TI, Rinaldi NJ, Robert F, Odom DT, Bar-Joseph Z, Gerber GK, Hannett NM, Harbison CT, Thompson CM, Simon I, Zeitlinger J, Jennings EG, Murray HL, Gordon DB, Ren B, Wyrick JJ, Tagne JB, Volkert TL, Fraenkel E, Gifford DK, Young RA. Transcriptional regulatory networks in Saccharomyces cerevisiae. Science. 2002;298:799–804. doi: 10.1126/science.1075090. [DOI] [PubMed] [Google Scholar]
- 4.Lockhart DJ, Dong H, Byrne MC, Follettie MT, Gallo MV, Chee MS, Mittmann M, Wang C, Kobayashi M, Horton H, Brown EL. Expression monitoring by hybridization to high- density oligonucleotide arrays. Nat Biotechnol. 1996;14:1675–1680. doi: 10.1038/nbt1296-1675. [DOI] [PubMed] [Google Scholar]
- 5.Schena M, Shalon D, Davis RW, Brown PO. Quantitative monitoring of gene expression patterns with a complementary DNA microarray. Science. 1995;270:467–470. doi: 10.1126/science.270.5235.467. [DOI] [PubMed] [Google Scholar]
- 6.Crampin EJ, Schnell S, McSharry PE. Mathematical and computational techniques to deduce complex biochemical reaction mechanisms. Progress in Biophysics and Molecular Biology. 2004;86(1):77–112. doi: 10.1016/j.pbiomolbio.2004.04.002. [DOI] [PubMed] [Google Scholar]
- 7.Noble D. The rise of computational biology. Nat Rev Mol Cell Biol. 2002;3:459–463. doi: 10.1038/nrm810. [DOI] [PubMed] [Google Scholar]
- 8.Hasty J, McMillen D, Isaacs F, Collins JJ. Computational studies of gene regulatory networks: in numero molecular biology. Nature Genet. 2001;2:268–279. doi: 10.1038/35066056. [DOI] [PubMed] [Google Scholar]
- 9.Tyson JJ, Chen K, Novak B. Network dynamics and cell physiology. Nat Rev Mol Cell Biol. 2001;2:908–916. doi: 10.1038/35103078. [DOI] [PubMed] [Google Scholar]
- 10.Haugh JM, Wells A, Lauffenburger DA. Mathematical modeling of epidermal growth factor receptor signaling through the phospholipase C pathway: mechanistic insights and predictions for molecular interventions. Biotechnol Bioeng. 2000;70:225–238. [PubMed] [Google Scholar]
- 11.Kholodenko BN, Demin OV, Moehren G, Hoek JB. Quantification of short term signaling by the epidermal growth factor receptor. J Biol Chem. 1999;274(42):30169–30181. doi: 10.1074/jbc.274.42.30169. [DOI] [PubMed] [Google Scholar]
- 12.Neves SR, Iyengar R. Modeling of signaling networks. BioEssays. 2002;24:1110–1117. doi: 10.1002/bies.1154. [DOI] [PubMed] [Google Scholar]
- 13.Kitano H. Perspectives on Systems Biology. New Generation Computing. 2000;18:199–216. [Google Scholar]
- 14.Kholodenko BN, Kiyatkin A, Bruggeman FJ, Sontag E, Westerhoff HV, Hoek JB. Untangling the wires: a strategy to trace functional interactions in signaling and gene networks. Proc Natl Acad Sci U S A. 2002;99:12841–12846. doi: 10.1073/pnas.192442699. [DOI] [PMC free article] [PubMed] [Google Scholar]
- 15.Brazhnik P, de la Fuente A, Mendes P. Gene networks: how to put the function in genomics. Trends in Biotechnology. 2002;20:467–472. doi: 10.1016/s0167-7799(02)02053-x. [DOI] [PubMed] [Google Scholar]
- 16.Bassett DE, Jr, Eisen MB, Boguski MS. Gene expression informatics—it’s all in your mine. Nature Genetics Supplement. 1999;21:51–55. doi: 10.1038/4478. [DOI] [PubMed] [Google Scholar]
- 17.Eisen MB, Spellman PT, Brown PO, Botstein D. Cluster analysis and display of genome-wide expression patterns. Proc Natl Acad Sci USA. 1998;95:14863–14868. doi: 10.1073/pnas.95.25.14863. [DOI] [PMC free article] [PubMed] [Google Scholar]
- 18.Hibbs MA, Dirksen NC, Li K. Visualization methods for statistical analysis of microarray clusters. BMC Bioinformatics. 2005 doi: 10.1186/1471-2105-6-115. [DOI] [PMC free article] [PubMed] [Google Scholar]
- 19.Quackenbush J. Computational analysis of microarray data. Nat Rev Genet. 2001;2:418–427. doi: 10.1038/35076576. [DOI] [PubMed] [Google Scholar]
- 20.Datta S, Datta S. Comparisons and validation of statistical clustering techniques for microarray gene expression data. Bioinformatics. 2003;19(4):459–66. doi: 10.1093/bioinformatics/btg025. [DOI] [PubMed] [Google Scholar]
- 21.Kauffman SA. The Origins of Order. Oxford University Press; New York: 1993. [Google Scholar]
- 22.Huang S, Ingber DE. Shape-Dependent Control of Cell Growth, Differentiation, and Apoptosis: Switching between Attractors in Cell Regulatory Networks. Experimental Cell Research. 2000;261:91–103. doi: 10.1006/excr.2000.5044. [DOI] [PubMed] [Google Scholar]
- 23.Somogyi R, Sniegoski CA. Modelling the complexity of genetic networks: Understanding multigenic and pleiotropic regulation. Complexity. 1996;1:45–63. [Google Scholar]
- 24.Basso K, Margolin AA, Stolovitzky G, Klein U, Dalla-Favera R, Califano A. Reverse engineering of regulatory networks in human B cells. Nat Genet. 2005;37(4):382–90. doi: 10.1038/ng1532. [DOI] [PubMed] [Google Scholar]
- 25.Hartemink AJ. Reverse engineering gene regulatory networks. Nat Biotechnol. 2005;23(5):554–5. doi: 10.1038/nbt0505-554. [DOI] [PubMed] [Google Scholar]
- 26.Sachs K, Perez O, Pe’er D, Lauffenburger DA, Nolan GP. Causal protein-signaling networks derived from multiparameter single-cell data. Science. 2005;308:523–529. doi: 10.1126/science.1105809. [DOI] [PubMed] [Google Scholar]
- 27.Yu J, Smith VA, Wang PP, Hartemink AJ, Jarvis ED. Advances to Bayesian network inference for generating causal networks from observational biological data. Bioinformatics. 2004;20(18):3594–603. doi: 10.1093/bioinformatics/bth448. [DOI] [PubMed] [Google Scholar]
- 28.Chevalier T, Schreiber I, Ross J. Toward a systematic determination of complex-reaction mechanisms. J Phys Chem. 1993;97:6776–6787. [Google Scholar]
- 29.Kholodenko BN, Sontag ED. Determination of functional network structure from local parameter dependence data. arXiv: physics_0205003 2002 [Google Scholar]
- 30.Gardner TS, di Bernardo D, Lorenz D, Collins JJ. Inferring genetic networks and identifying compound mode of action via expression profiling. Science. 2003;301(5629):102–5. doi: 10.1126/science.1081900. [DOI] [PubMed] [Google Scholar]
- 31.de la Fuente A, Brazhnik P, Mendes P. Linking the genes: inferring quantitative gene networks from microarray data. Trends Genet. 2002;18:395–398. doi: 10.1016/s0168-9525(02)02692-6. [DOI] [PubMed] [Google Scholar]
- 32.Brazhnik P. Inferring gene networks from steady-state response to single-gene perturbations. J Theor Biol. 2005;237:427–40. doi: 10.1016/j.jtbi.2005.04.027. [DOI] [PubMed] [Google Scholar]
- 33.Hartwell LH, Hopfield JJ, Leibler S, Murray AW. From molecular to modular cell biology. Nature. 1999;402:C47–C52. doi: 10.1038/35011540. [DOI] [PubMed] [Google Scholar]
- 34.Lauffenburger DA. Cell signaling pathways as control modules: Complexity for simplicity? Proc Natl Acad Sci U S A. 2000;97:5031–5033. doi: 10.1073/pnas.97.10.5031. [DOI] [PMC free article] [PubMed] [Google Scholar]
- 35.Andrec M, Kholodenko BN, Levy RM, Sontag E. Inference of signaling and gene regulatory networks by steady-state perturbation experiments: structure and accuracy. J Theor Biol. 2005;232:427–441. doi: 10.1016/j.jtbi.2004.08.022. [DOI] [PubMed] [Google Scholar]
- 36.Zak DE, Gonye GE, Schwaber JS, Doyle FJ. Importance of input perturbations and stochastic gene expression in the reverse engineering of genetic regulatory networks: insights from an identifiability analysis of an in silico network. Genome Research. 2003;13:2396–2405. doi: 10.1101/gr.1198103. [DOI] [PMC free article] [PubMed] [Google Scholar]
- 37.Gygi S, Rochon Y, Franza B, Aebersold R. Correlation between protein and mRNA abundance in yeast. Mol Cell Biol. 1999;19:1720–1730. doi: 10.1128/mcb.19.3.1720. [DOI] [PMC free article] [PubMed] [Google Scholar]
- 38.Hatzimanikatis V, Lee K. Dynamical analysis of gene networks requires both mRNA and protein expression information. Metab Eng. 1999;1:275–281. doi: 10.1006/mben.1999.0115. [DOI] [PubMed] [Google Scholar]
- 39.Tavazoie S, Hughes JD, Campbell MJ, Cho RJ, Church GM. Systematic determination of genetic network architecture. Nat Genet. 1999;22:281–285. doi: 10.1038/10343. [DOI] [PubMed] [Google Scholar]
- 40.Ideker T, Thorsson V, Ranish JA, Christmas R, Buhler J, Eng JK, Bumgarner R, Goodlett DR, Aebersold R, Hood L. Integrated genomic and proteomic analyses of a systematically perturbed metabolic network. Science. 2001;292:929–934. doi: 10.1126/science.292.5518.929. [DOI] [PubMed] [Google Scholar]
- 41.Covert MW, Knight EM, Reed JL, Herrgard MJ, Palsson BO. Integrating high-throughput and computational data elucidates bacterial networks. Nature. 2004;429:92–96. doi: 10.1038/nature02456. [DOI] [PubMed] [Google Scholar]
- 42.Herdegen T, Leah JD. Inducible and constitutive transcription factors in the mammalian nervous system: Control of gene expression by Jun, Fos, and Krox, and CREB/ATF proteins. Brain Res Rev. 1998;28:370–490. doi: 10.1016/s0165-0173(98)00018-6. [DOI] [PubMed] [Google Scholar]
- 43.Kenney FT, Lee KL. Turnover of gene products in the control of gene expression. Bioscience. 1982;32(3):181–184. [Google Scholar]
- 44.Kohler JJ, Schepartz A. Kinetic studies of Fos.Jun.DNA complex formation: DNA binding prior to dimerization. Biochemistry-US. 2001;40(1):130–142. doi: 10.1021/bi001881p. [DOI] [PubMed] [Google Scholar]
- 45.Ouali R, Berthelon MC, Saez JM. Angiotensin II receptor subtypes AT1 and AT2 are down regulated by Angiotensin II through AT1 receptor by different mechanisms. Endocrinology. 1997;130(2):725–733. doi: 10.1210/endo.138.2.4952. [DOI] [PubMed] [Google Scholar]
- 46.Harbinson CT, Gordon DB, Lee TI, Rinaldi NJ, Macisaac KD, Danford TW, Hannett NM, Tagne JB, Reynolds DB, Yoo J, Jennings EG, Zeitlinger J, Pokholok DK, Kellis M, Rolfe PA, Takurasagawa KT, Lander ES, Gifford DK, Fraenkel E, Young RA. Transcriptional regulatory code of a eukaryotic genome. Nature. 2004;431(7004):99–104. doi: 10.1038/nature02800. [DOI] [PMC free article] [PubMed] [Google Scholar]
- 47.Levine M, Davidson EH. Gene regulatory networks for development. Proc Natl Acad Sci U S A. 2005;102(14):4936–42. doi: 10.1073/pnas.0408031102. [DOI] [PMC free article] [PubMed] [Google Scholar]
- 48.Hughes TR, Marton MJ, Jones AR, Roberts CJ, Stoughton R, Armour CD, Bennett HA, Coffey E, Dai H, He YD, Kidd MJ, King AM, Meyer MR, Slade D, Lum PY, Stepaniants SB, Shoemaker DD, Gachotte D, Chakraburtty K, Simon J, Bard M, Friend SH. Functional discovery via a compendium of expression profiles. Cell. 2000;102(1):109–26. doi: 10.1016/s0092-8674(00)00015-5. [DOI] [PubMed] [Google Scholar]
- 49.Schwikowski B, Uetz P, Fields S. A network of protein-protein interactions in yeast. Nat Biotechnol. 2000;18(12):1257–61. doi: 10.1038/82360. [DOI] [PubMed] [Google Scholar]


