Abstract
The length of the vocal tract is correlated with speaker size and, so, speech sounds have information about the size of the speaker in a form that is interpretable by the listener. A wide range of different vocal tract lengths exist in the population and humans are able to distinguish speaker size from the speech. Smith et al. [J. Acoust. Soc. Am. 117, 305–318 (2005)] presented vowel sounds to listeners and showed that the ability to discriminate speaker size extends beyond the normal range of speaker sizes which suggests that information about the size and shape of the vocal tract is segregated automatically at an early stage in the processing. This paper reports an extension of the size discrimination research using a much larger set of speech sounds, namely, 180 consonant-vowel and vowel-consonant syllables. Despite the pronounced increase in stimulus variability, there was actually an improvement in discrimination performance over that supported by vowel sounds alone. Performance with vowel-consonant syllables was slightly better than with consonant-vowel syllables. These results support the hypothesis that information about the length of the vocal tract is segregated at an early stage in auditory processing.
I. INTRODUCTION
Animal communication sounds contain information about the size (or scale) of the source. Recent work has shown that this scale information is present in the calls of birds (Mergell et al., 1999; Fitch, 1999; Fitch and Kelley, 2000), cats (Hast, 1989), dogs (Riede and Fitch, 1999), and primates (Fitch, 1997). In humans (like all mammals), communication sounds are produced by the resonance of a modulated stream of air. The air is forced up from the lungs and passes through the vocal folds. The vocal folds open and close rapidly, which modulates the stream of air producing a stream of glottal pulses. This modulated stream of air travels up through the pharyngeal and oral cavities (vocal tract) where it resonates in accordance with the shape and length of the vocal tract. Finally the air radiates out through the mouth as speech. Information about the size of the speaker is conveyed to the listener by the frequencies of the resonances (or formants) and their decay rates and by the glottal pulse rate (GPR). As humans grow, their vocal folds grow, becoming longer and heavier (Titze, 1989), which results in a lowering of GPR. The value decreases from about 260 Hz for small children to about 90 Hz for large adult males. Vocal tract length (VTL) is largely determined by height (Fitch and Giedd, 1999) and it increases from about 9 cm for young children to about 17 cm for large adults. The center frequencies of the resonances are inversely proportional to its length (Fant, 1970), while their decay rates are proportional to VTL; so, in general, taller people have lower formant frequencies than shorter people and their resonances ring longer. This relationship has also been demonstrated in macaques (Fitch, 1997) where the height, weight, VTL, and formant frequencies were all measured in the same individuals. Unfortunately, there are no equivalent studies for humans in which VTL was measured and compared with the formant frequencies of the speaker.
Speakers can modify their VTL a little by lip rounding and by raising or lowering the larynx. Both effects change the positions of the formant frequencies and so alter the perceived size of the speaker. The variability introduced by these factors reduces the correlation between formant frequency and height in adults, and when the range of heights is limited and/or the sample size is relatively small, the correlation can be unreliable. Thus we find that Gonzalez (2004) found a weak relationship between formant frequency and height that was stronger for women than for men, whereas Rendall et al. (2005) found a weak relationship between formant frequency and height that was stronger for men than for women. It is also the case that speakers can lower or raise the average pitch of their voice, and thereby increase or decrease their apparent size and/or age, and Kunzel (1989) found that GPR is not significantly correlated with speaker size in adults when other variables like age and sex are controlled. So, although it is easy to distinguish children from adults on the basis of a few syllables, one cannot readily estimate the height of adults accurately from their speech alone, and research in this area has been hampered by the complexity of the interaction of the variables (Owren and Anderson, 2005).
Recently, two high-quality vocoders have been developed that make it possible to manipulate VTL and GPR in isolation, or in arbitrary combinations, while at the same time avoiding concomitant changes in secondary factors such as lip rounding and larynx lowering. The vocoders are referred to as STRAIGHT (Kawahara et al., 1999; Kawahara and Irino, 2004) and PRAAT (Boersma, 2001). When GPR is changed keeping the VTL constant, we hear one person's voice changing in pitch; when the VTL is changed keeping GPR constant, we hear two different-sized people speaking on the same pitch. Demonstrations are provided on the web page1 of the Centre for Neural Basis of Hearing. The vocoder STRAIGHT has been used to investigate the effect of VTL variability on vowel recognition and to measure the just noticeable difference (jnd) in VTL. Assmann and Nearey (2003) scaled vowels with STRAIGHT and measured vowel recognition performance for combinations of GPR and VTL in the range normally encountered in human speech and somewhat beyond. They found that good performance extends beyond the normal range but that it falls off as the GPR rises beyond 800 Hz, and it falls off faster for longer VTLs. They proposed a model of vowel recognition consisting of a neural network that learns the associations between vowel type, GPR, and formant frequencies in natural speech. Smith et al. (2005) scaled vowels with STRAIGHT over a much wider range and showed that vowel recognition was still possible even though the range of GPRs and VTLs was much greater than that experienced in natural speech. Irino and Patterson (2002) have argued that the auditory system segregates the acoustic features in speech sounds associated with the shape of the vocal tract from those associated with its length at an early stage in auditory processing. Turner et al. (2005) and Smith et al. (2005) argued that good recognition performance outside the normal speech range favors the hypothesis of Irino and Patterson (2002) that there is a size normalization process in the early stages of auditory processing. Smith et al. (2005) also measured size discrimination using vowel sounds. They showed that discrimination was possible over a large range of VTLs and GPRs, including combinations well beyond the natural human range. The data support the hypothesis of Cohen (1993) that scale is a dimension of speech sounds, and the hypothesis of Irino and Patterson (2002) that there is a scale normalization process at an early stage in the auditory system.
In this paper, the vowel experiments of Smith et al. (2005) were extended to determine how size discrimination performance is affected when the variability of the set of speech sounds is increased to be more like that experienced in everyday speech. The number of speech tokens in the experiment was increased from 5 vowels to 180 syllables. The number of combinations of GPR and VTL in the experiment was reduced from 17 to 5.
II. METHOD
To expand the domain of size perception from vowels to more speechlike utterances, we created a large database of CV and VC syllables which were scaled in GPR and VTL using STRAIGHT. In the experiment listeners were presented with two phrases of four syllables, which were selected at random, with replacement, from a specific category of the syllable database. The only consistent difference between the two phrases was vocal tract length; the listener's task was to identify the interval with the smaller speaker.
The stimuli consisted of syllables that were analyzed, manipulated, and resynthesized by STRAIGHT, which is a high-quality vocoder developed by Kawahara and Irino (2004). Liu and Kewley-Port (2004) have reviewed STRAIGHT and commented favorably on the quality of its production of resynthesized speech. Assmann and Katz (2005) have also shown that a listener's ability to identify vowels is not adversely affected when they are manipulated by STRAIGHT over a reasonable range of GPR and VTL. STRAIGHT allows one to the separate the VTL and GPR information in speech sounds and resynthesize the same utterance with different VTL and/or GPR values. STRAIGHT performs a “pitch synchronous” spectral analysis with a high-resolution FFT, and then the envelope is smoothed to remove the zeros introduced by the FFT. The resultant sequence of spectral envelopes describes the resonance behavior of the vocal tract in a form that is largely independent of pitch. The GPR vector can be scaled to change the pitch of the syllable, and the frequency dimension of the sequence of spectral envelopes can be scaled to vary the VTL of the speaker; then the syllable can be resynthesized with its new GPR and VTL values.
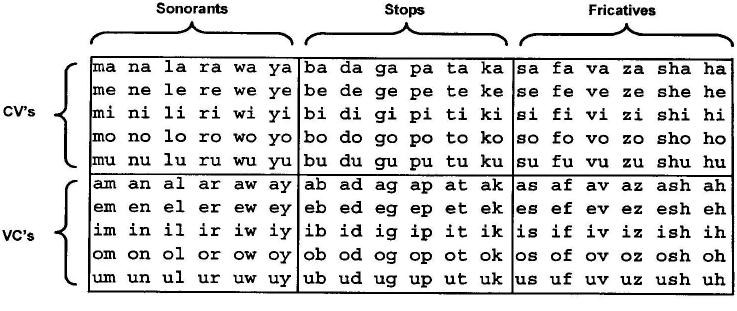
The speech in this experiment was taken from a database created at the CNBH for brain imaging experiments; it contains 180 unique syllables. Versions of the syllables were analyzed with STRAIGHT and then resynthesized with many different combinations of GPR and VTL. The syllables were divided into 6 groups: three consonant-vowel (CV) groups and three vowel-consonant (VC) groups. Within the CV and VC categories, the groups were distinguished by consonant category: sonorants, stops, and fricatives. The full set of syllables is shown in Table I. The syllables were recorded from one speaker (author RP) in a quiet room with a Shure SM58-LCE microphone. The microphone was held approximately 5 cm from the lips to ensure a high signal-to-noise ratio and to minimize the effect of reverberation. A high-quality PC sound card (Sound Blaster Audigy II, Creative Labs) was used with 16-bit quantization and a sampling frequency of 48 kHz. The syllables were normalized by setting the rms value in the region of the vowel to a common value so that they were all perceived to have about the same loudness. We also wanted to ensure that, when any combination of the syllables was played in a sequence, they would be perceived to proceed at a regular pace; an irregular sequence of syllables causes an unwanted distraction. Accordingly, the positions of the syllables within their files were adjusted so that their perceptual-centers (P-centers) all occurred at the same time relative to file onset. The algorithm for finding the P-centers was based on procedures described by Marcus (1981) and Scott (1993), and it focuses on vowel onsets. Vowel onset time was taken to be the time at which the syllable first rises to 50% of its maximum value over the frequency range of 300–3000 Hz. To optimize the estimation of vowel onset time, the syllable was filtered with a gammatone filterbank (Patterson et al., 1992) having 30 channels spaced quasi-logarithmically over the frequency range of 300–3000 Hz. The 30 channels were sorted in descending order based on their maximum output value and the ten highest were selected. The Hilbert envelope was calculated for these ten channels and, for each, the time at which the level first rose to 50% of the maximum was determined; the vowel onset time was taken to be the mean of these ten time values. The P-center was determined from the vowel onset time and the duration of the signal as described by Marcus (1981). The P-center adjustment was achieved by the simple expedient of inserting silence before and/or after the sound. After P-center correction the length of each syllable, including the silence, was 683 ms.
TABLE I.
Stimulus set showing categories of CVs, VCs, sonorant, stops, and fricatives. Pronunciation details are described in the text.
|
With regard to the pronunciation of the syllables, the listeners were not required to recognize the syllables or specify their phonetic content, so the precise pronunciation of the syllables is not an issue for the current experiments. As a matter of record, the sounds were intended to be two-phoneme sequences of the most common speech sounds in balanced, cv-vc pairs, rather than a representative sample of syllables from English. The vowels were pronounced as they are in most five vowel languages like Japanese and Spanish so that they could be used with a wide range of listeners; thus the pronunciation was /a/ as in “fa,” /e/ as in “bay,” /i/ as in “bee,” /o/ as in “toe,” and /u/ as in “zoo.” Syllables involving a sonorant consonant, which would be diphthongs in English (e.g., oy), were pronounced more like two distinct phonemes than diphthongs so that the duration of the components would be similar in cv-vc pairs.
Once the recordings were edited and standardized as described above, STRAIGHT was used to generate all the different versions of each syllable with the specific combinations of VTL and GPR values required for the experiment. In STRAIGHT, the VTL is varied simply by dilating or contracting the spectral envelope of the recorded syllable. The change in VTL is described in terms of the ratio of the width of the new spectral envelope to that of the original spectral envelope. This spectral envelope ratio (SER) is inversely proportional to the change in the length of the vocal tract. SER values less than unity mean that the vocal tract has been made longer to synthesize a larger person; the process shifts all of the vocal tract resonances to lower frequencies. Figure 1 shows the five combinations of SER and GPR that were used as standards in the experiment; they were chosen to be characteristic of five speaker types. The SER value is also shown as a VTL in Fig. 1. The VTL is estimated from the data in Fitch and Giedd (1999). The height of the speaker (RP) was 173 cm and, for a person of this height, Fitch and Giedd give a VTL of 15.2 cm. This value was used as the reference and has an SER of 1.0. For the experimental stimuli, combination 1 has a low GPR of 80 Hz and a long VTL of 16.5 cm, which is characteristic of a large male. Combination 2 has a high GPR of 320 Hz and a long VTL of 16.5 cm, which is highly unusual for a human. Nevertheless, the syllables are readily recognized as speech from a tall person with a high pitch. For convenience in the paper, these speakers will be referred to as a “castrati.” Combination 3 has a GPR of 160 Hz and a VTL of 12.5 cm, which is characteristic of an average-sized person somewhere between the average adult male and the average adult female. Combination 4 has a low GPR of 80 Hz and a short VTL of 9.2 cm, which is also highly unusual for a human. Again, the syllables are obviously speech but this time from a short person with a low pitch. For convenience in the paper, these speakers will be referred to as a “dwarves.” Finally, combination 5 has a high GPR of 320 Hz and a short VTL of 9.2 cm, which is characteristic of a small child, either male or female.
FIG. 1.
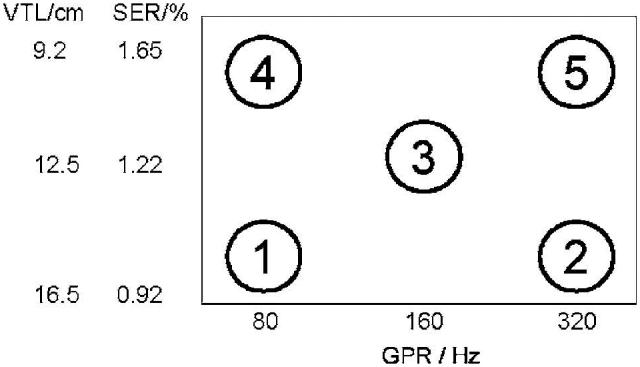
The GPR-VTL combinations for the five reference speakers in the experiment. These speakers are typically heard as a large male (1), a castrato (2), a small male or a large female (3), a dwarf (4), and a small child (5).
The listeners were presented with two phrases of four syllables each; the one consistent difference between the phrases was the VTL of the speaker. The syllables were selected randomly, with replacement, from one of six groups within the database (e.g. CV-sonorants, CV-stops, CV-fricatives, VC-sonorants, VC-stops, or VC-fricatives). The level of the syllables in each phrase was roved between phrases over a 6-dB range. The GPR of each of the syllables within the phrase was varied along one of four pitch contours: rising, falling, up-down, and down-up. In the rising contour, the GPR of each successive syllable increased linearly such that the GPR of the last syllable was 10% higher than that of the first syllable. The falling contour was the reverse of the rising contour, i.e., the GPR of each successive syllable decreased linearly such that the first syllable had a GPR 10% higher than the last syllable. In the up-down contour the first and the last syllables had the same GPR values which were 10% lower than the GPR values of the second and third syllables. Finally, for the down-up contour, the first and last syllables had the same GPR values which were 10% higher than the second and third syllables. The starting value for the GPR contour was also varied over a 10% range. Thus, the only consistent difference between the two phrases was the VTL. One of the phrases, chosen at random, had one of the reference VTLs, that is, one of the five combinations shown in Fig. 1; the other phrase had a test VTL which was varied over trials to measure VTL discrimination. For each reference VTL, there were six test VTLs, three of which were longer and three of which were shorter. The three longer VTLs had lengths of 106%, 122%, and 143% relative to the reference, except for the castrato speech (point 2 in Fig. 1) for which the test VTLs had lengths of 103%, 110%, and 118% relative to the reference, and the small male/large female speech (point 3 in Fig. 1) for which the test VTLs had lengths of 103%, 112%, and 125% relative to the reference. The reduction in the range of VTLs for the castrato speech was due to difficulty in resynthesizing longer VTLs; F0 rises to values above the first formant in which case the vowel is ill defined (see Smith et al., 2005; top panel of Fig. 3). The reduction in the range of VTLs for the small male/large female speech was due to pilot data showing that discrimination performance was improved for this range of VTLs. The three shorter VTLs had lengths of 77%, 85%, and 94% relative to the reference except for the small male/large female speech for which the test VTLs had lengths of 83%, 89%, and 96% relative to the reference. The change in the range of VTLs was again due to pilot data showing an improvement in discrimination performance for this reference VTL.
FIG. 3.
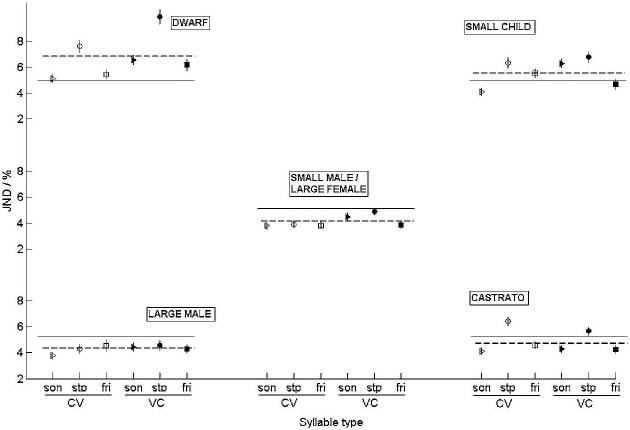
The jnd values for the six syllable groups plotted separately for the five speaker types. The layout of speaker types is the same as in Figs. 2 and 3, i.e., large male at the bottom left and small child at the top right. The dotted line is the average jnd across syllable category for that specific speaker type. The solid, thin line is grand average jnd for the experiment plotted in each subfigure for comparison with the local average.
Discrimination performance was measured separately at each of the five points shown on Fig. 1, using a two-alternative, forced-choice paradigm (2AFC). The listener was asked to choose the phrase spoken by the smaller person, and to indicate their choice by clicking on the appropriate interval box on a computer screen. The subject had to discriminate between the reference value (taken from Fig. 1) and one of the three longer or three shorter VTLs. The data from the six VTL comparisons were combined to produce a psychometric function for one specific reference value. There were six listeners (three male and three female between 21 and 35 years of age); they all had normal hearing thresholds at 0.5, 1, 2, 4, and 8 kHz. There was a brief training session in which the listener was presented with about 20 trials with different VTLs chosen at random from the six test values. During this training session, feedback was provided to the listeners as to whether they had correctly identified the smaller speaker. Discrimination performance was then measured for that reference point with approximately 40 trails per reference point. During the discrimination measurement there was no feedback. This procedure was repeated for each of the six syllable groups in a random order which was selected individually for each listener. The sounds were presented at a level of 70 dB diotically over AKG K240DF headphones while seated in a double-walled IAC sound attenuating booth.
III. RESULTS
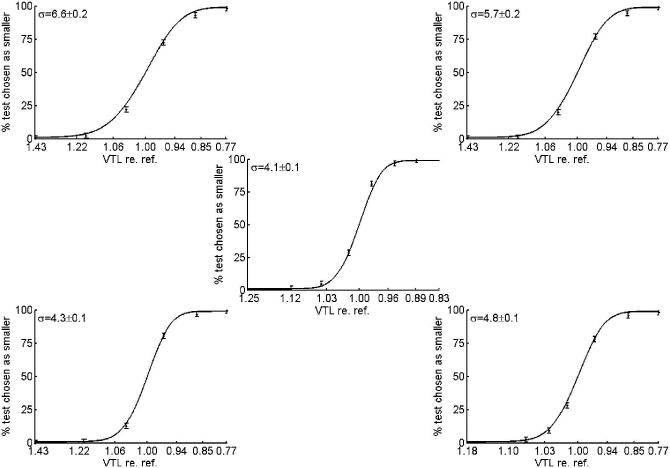
The results for each of the five reference speakers are shown in Fig. 2 as a set of psychometric functions, where the layout mirrors that for the reference conditions presented in Fig. 1. That is, the positions of psychometric functions reflect the position of the reference condition on the GPR-VTL plane; the small child is at the top right and the large man is at the bottom left. The data have been averaged across listeners because there was very little difference between listeners. They have also been averaged over syllable type, because the data for individual syllable types showed very similar patterns and levels of performance. The abscissa for the psychometric functions is VTL expressed as a ratio of the reference VTL; the ordinate is the percentage of trials on which the test interval was identified as having the smaller speaker. The error bars show ±2 standard deviations over all listeners and syllable types. A cumulative Gaussian function has been fitted to the data for each psychometric function and used to calculate the jnd. The jnd was defined as the difference in VTL for a 26% increase in performance from 50% to 76% performance; it is shown on each graph at the top left corner, and the error shows 2 standard deviations of the fitted Gaussian function. Figure 2 shows that size discrimination is possible for each of the five speaker types; performance is best for the small-male/large-female speaker type and poorest for the dwarf speaker type. The jnd values for the individual syllable groups are summarized in Table II.
FIG. 2.
Psychometric functions for the five reference speakers, averaged over all listeners, all syllables within group and all syllable groups (approximately 1400 trials per point on each psychometric function). The jnd value is the difference between 76% and 50% performance as estimated by the fitted Gaussian function. The jnd value is shown on each graph in the top left corner; the error bars represent 2 standard deviations.
TABLE II.
The jnd values for all syllable groups averaged over all listeners.
| VTL-GPR condition |
|||||
|---|---|---|---|---|---|
| Stimuli group |
1 | 2 | 3 | 4 | 5 |
| All | 4.3±0.1 | 4.8±0.1 | 4.1±0.1 | 6.6±0.2 | 5.7±0.2 |
| CV | 4.0±0.2 | 5.0±0.2 | 4.0±0.2 | 5.9±0.2 | 5.3±0.2 |
| VC | 4.5±0.2 | 4.7±0.2 | 4.4±0.2 | 7.6±0.3 | 6.3±0.2 |
| Sonorant | 4.1±0.2 | 4.2±0.2 | 4.1±0.2 | 5.9±0.3 | 5.1±0.3 |
| Stop | 4.6±0.3 | 6.3±0.3 | 4.3±0.2 | 8.4±0.3 | 6.5±0.3 |
| Fricative | 4.2±0.2 | 4.4±0.2 | 3.8±0.2 | 5.7±0.3 | 5.3±0.3 |
| Smith et al. (2005) | 10.5 | 17.2 | 6.6 | 10.6 | 9.3 |
A summary of the jnd values is shown in Fig. 3, which has the same layout as Figs. 1 and 2. The jnd's for the six syllable groups are shown separately for each speaker type. The jnd for both the large male speaker type and the small-male/large-female speaker type is stable at around 4% for all syllable types. The jnd for the castrato speaker type is slightly worse, particularly for syllables containing stop consonants for which the jnd is 5%–6%. The jnd's for the dwarf speaker type and the small child speaker type are around 7% and 6% respectively, and again it is worst for syllables with stop consonants.
IV. DISCUSSION
The jnd's for speaker size measured by Smith et al. (2005) with vowel sounds are included in the bottom row of Table II. When compared with the data of the current experiment, they show that discrimination performance is much better when syllables are used rather than just vowels, despite the increase in stimulus variability in the syllable version of the experiment. For the small-male/large-female, dwarf, and small child, the jnd for syllables is about 30% less than with isolated vowels. For the large male, the jnd has decreased by about 60%, and for the castrato the jnd value has decreased by about 70%. This improvement in performance may be due to the increased naturalness of the speech. Although Smith et al. (2005) used natural vowels, they applied an artificial amplitude envelope to the onset; the natural onset of the syllable was preserved in the current study. There was one other difference between the vowel and syllable experiments, which is the duration of the silence between the vowels or syllables: in the vowel experiment, the duration of the silence was a constant 40 ms; in the syllable experiment, due to the P-centering, the duration of the silence was much longer (between about 100 and 300 ms). This may have provided more time to process the individual syllables.
The content for each syllable type can be categorized into three components, namely, a voiced component (including any vowel information), a vowel component, and finally any other component which contains information about the vocal tract length which is not included by either of the two previous components (this is mainly noise from the fricatives and will be termed the noise component). Figure 4 shows the duration of each of these components for each of the six speech groups together with a summary for CVs and VCs. CV syllables have longer voiced components than VC syllables and significantly longer vowel components. The average length of the periodic component for a CV syllable is about 450 ms, whereas for a VC syllable, this is about 350 ms. The average vowel duration for CV syllables is about 400 ms, and for VC syllables this reduces to about 260 ms. Sonorants have the longest voiced and vowel components followed by stops and then fricatives, however this difference is only really apparent in the VC versions of the syllables. The increased amount of voiced/vowel content in the CV syllables may improve CV size discrimination when compared to VC syllables. There is only a small variation in the duration of the noise component of all speech sounds when compared to the much longer voiced and vowel components.
FIG. 4.
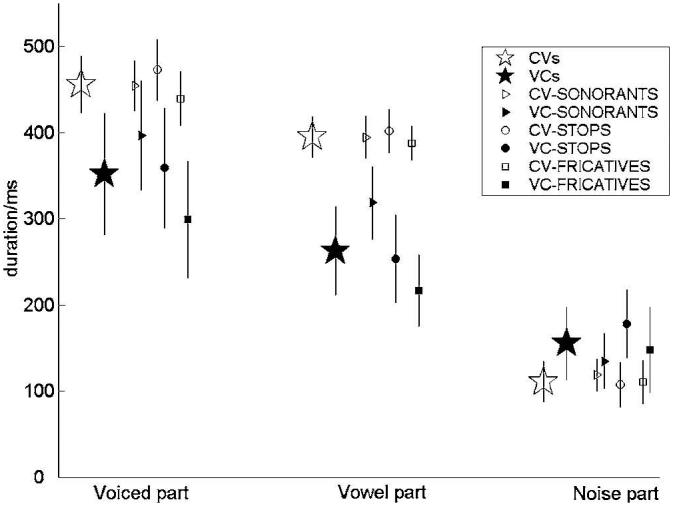
The small symbols show the duration of the “voiced,” “vowel,” and “noise” components for each of the six syllable classes with error bars showing ±2 standard deviations. The large star symbols show the average values for all of the CV syllables (open) and all of the VC syllables (filled).
Assmann et al. (2002) and Assmann and Nearey (2003) argued that listeners can recognize scaled vowels because they have extensive experience with speech that has included examples of most syllables with many combinations of GPR and VTL. They showed that a neural network could learn the variability of the vowels in their experiment and suggested that the brain has a similar learning mechanism. However, Smith and Patterson (2004) and Smith et al. showed that vowel recognition is possible over a range of VTL and GPR values that extends far beyond that normally encountered during everyday experience. They argue that the auditory system uses a scale normalization process like that suggested by Irino and Patterson (2002) and that this avoids the need for an elaborate learning mechanism. Figure 5 shows the distribution of men, women, and children speaker types in the GPR-VTL space. The three ellipses were derived from the classic data of Peterson and Barney (1952) and each ellipse encompasses 96% of the population for that speaker group, which represents the vast majority of VTLs and GPRs that one would encounter in everyday life. The numbered points show the GPR-VTL conditions that were used in the experiment. Conditions 1 and 5, large man and small child, lie just within the extremities of their respective ellipses. Conditions 2 and 4 (castrato and dwarf) lie well outside these ellipses. Thus, the range of VTL-GPR combinations includes the full range of normal human speech and well beyond. The ability to discriminate size to such a fine resolution over this entire range supports the argument of Irino and Patterson (2002) that the auditory system includes a scale normalization process.
FIG. 5.
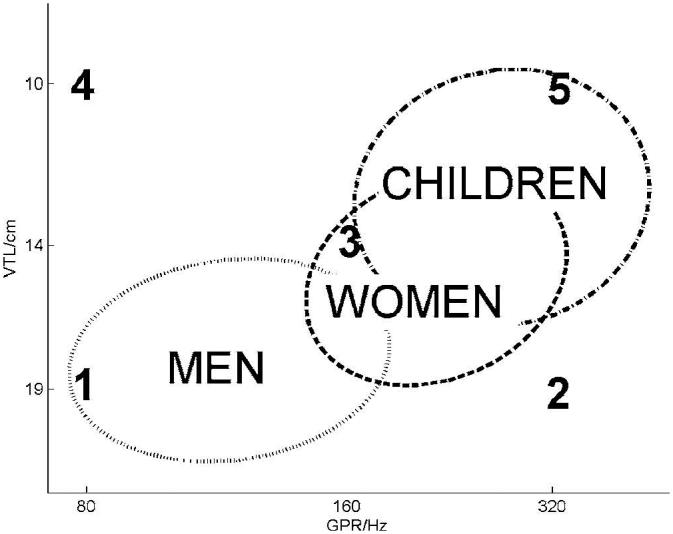
Ellipses showing the distribution of vocal tract lengths and glottal pulse rates for men, women and children, based on the data of Peterson and Barney (1952). The ellipses encompass 96% of the data for each group. The numbered points show the reference speakers used in the experiment.
V. CONCLUSIONS
A series of VTL discrimination experiments has shown that it is possible to make fine discriminations about a person's size by listening to their speech. This shows that the size information in speech is available to the listener and changes in VTL alone produce reliable differences in perceived size. The average jnd values for VTL discrimination measured with phrases of syllables are between 4% and 6% depending on the location in the GPR-VTL space. These jnd's are considerably smaller than those obtained with vowels by Smith et al. (2005), despite the increase in the variability of the stimulus set. There is a small difference in the jnd between CV syllables and VC syllables with the former having the smaller jnd.
ACKNOWLEDGMENTS
Research supported by the U.K. Medical Research Council (G9901257) and the German Volkswagen Foundation (VWF 1/79 783). The authors would like to thank Peter Assmann and an anonymous reviewer for helpful comments on an earlier version of the manuscript.
Footnotes
Portions of this work were presented in “Size discrimination in CV and VC English syllables,” British Society of Audiology, London, United Kingdom, 2004.
http://www.mrc-cbu.cam.ac.uk/cnbh/web2002/bodyframes/sounds_movies/ra_demo_16_06_04_files/slide0304.htm. (last updated 14 September 2005)
References
- Assmann PF, Katz WF. Synthesis fidelity and time-varying spectral change in vowels. J. Acoust. Soc. Am. 2005;117:886–895. doi: 10.1121/1.1852549. [DOI] [PubMed] [Google Scholar]
- Assmann PF, Nearey TM. Frequency shifts and vowel identification. Proceedings of the 15th Int. Congress of Phonetic Sciences; ICPhS; Barcelona. 2003. [Google Scholar]
- Assmann PF, Nearey TM, Scott JM. Modeling the perception of frequency-shifted vowels. Proceedings of the 7th Int. Conference on Spoken Language Perception; ICSLP.2002. pp. 425–428. [Google Scholar]
- Boersma P. Praat, a system for doing phonetics by computer. Glot. Int. 2001;5(9/10):341–345. [Google Scholar]
- Cohen L. The scale transform. IEEE Trans. Acoust., Speech, Signal Process. 1993;41:3275–3292. [Google Scholar]
- Fant G. Acoustic Theory of Speech Production. 2nd ed. Paris: Mouton; 1970. [Google Scholar]
- Fitch WT. Vocal tract length and formant frequency dispersion correlate with body size in rhesus macaques. J. Acoust. Soc. Am. 1997;102:1213–1222. doi: 10.1121/1.421048. [DOI] [PubMed] [Google Scholar]
- Fitch WT. Acoustic exaggeration of size in birds by tracheal elongation: Comparative and theoretical analyses. J. Zool. 1999;248:31–49. [discussed in “News & Views,” Nature (London) 399, 109 (1999)] [Google Scholar]
- Fitch WT, Giedd J. Morphology and development of the human vocal tract: A study using magnetic resonance imaging. J. Acoust. Soc. Am. 1999;106:1511–1522. doi: 10.1121/1.427148. [DOI] [PubMed] [Google Scholar]
- Fitch WT, Kelley JP. Perception of vocal tract resonances by whooping cranes, Grus Americana, Ethology. 2000;106(6):559–574. [Google Scholar]
- González J. Formant frequencies and body size of speaker: A weak relationship in adult humans. J. Phonetics. 2004;32:277–287. [Google Scholar]
- Hast M. The larynx of roaring and non-roaring cats. J. Anat. 1989;163:117–121. [PMC free article] [PubMed] [Google Scholar]
- Irino T, Patterson RD. Segregating information about the size and shape of the vocal tract using a time-domain auditory model: The stabilized wavelet-Mellin transform. Speech Commun. 2002;36:181–203. [Google Scholar]
- Kawahara H, Irino T. Underlying principles of a high-quality speech manipulation system STRAIGHT and its application to speech segregation. In: Divenyi P, editor. Speech Segregation by Humans and Machines. Boston: Kluwer Academic; 2004. pp. 167–180. [Google Scholar]
- Kawahara H, Masuda-Kasuse I, de Cheveigne A. Restructuring speech representations using pitch-adaptive time-frequency smoothing and instantaneous-frequency-based F0 extraction: Possible role of repetitive structure in sounds. Speech Commun. 1999;27(3-4):187–207. [Google Scholar]
- Kunzel H. How well does average fundamental frequency correlate with speaker height and weight? Phonetica. 1989;46:117–125. doi: 10.1159/000261832. [DOI] [PubMed] [Google Scholar]
- Liu C, Kewley-Port D. STRAIGHT: a new speech synthesizer for vowel formant discrimination. ARLO. 2004;5:31–36. [Google Scholar]
- Marcus SM. Acoustic determinants of perceptual centre (P-centre) location. Percept. Psychophys. 1981;30:247–256. doi: 10.3758/bf03214280. [DOI] [PubMed] [Google Scholar]
- Mergell P, Fitch WT, Herzel H. Modelling the role of non-human vocal membranes in phonation. J. Acoust. Soc. Am. 1999;105:2020–2028. doi: 10.1121/1.426735. [DOI] [PubMed] [Google Scholar]
- Owren MJ, Anderson JD., IV Voices of athletes reveal only modest acoustic correlates of stature. J. Acoust. Soc. Am. 2005;117:2375. [Google Scholar]
- Patterson RD, Allerhand M, Giguere C. Time domain modeling of peripheral auditory processing: A modular architecture and a software platform. J. Acoust. Soc. Am. 1995;98:1890–1894. doi: 10.1121/1.414456. [DOI] [PubMed] [Google Scholar]
- Patterson RD, Robinson K, Holdsworth J, McKeown D, Zhang C, Allerhand MH. Complex sounds and auditory images. In: Cazals Y, Demany L, Horner K, editors. Auditory Physiology and Perception, Proceedings of the 9th International Symposium on Hearing; Oxford: Pergamon; 1992. pp. 429–446. [Google Scholar]
- Peterson GE, Barney HL. Control methods used in the study of vowels. J. Acoust. Soc. Am. 1952;24:175–184. [Google Scholar]
- Rendall D, Vokey JR, Nemeth C, Ney C. Reliable but weak voice-formant cues to body size in men but not women. J. Acoust. Soc. Am. 2005;117:2372. [Google Scholar]
- Riede T, Fitch WT. Vocal tract length and acoustics of vocalization in the domestic dog Canis familiaris. J. Exp. Biol. 1999;202:2859–2867. doi: 10.1242/jeb.202.20.2859. [DOI] [PubMed] [Google Scholar]
- Scott SK. P-centres in speech an acoustic analysis. London: University College; 1993. Ph.D thesis. [Google Scholar]
- Smith DRR, Patterson RD. The existence region for scaled vowels in pitch-VTL space; 18th Int. Conference on Acoustics; Kyoto, Japan. 2004. pp. 453–456. [Google Scholar]
- Smith DRR, Patterson RD, Jefferis J. The perception of scale in vowel sounds; British Society of Audiology; Nottingham. 2003. p. 35. [Google Scholar]
- Smith DRR, Patterson RD, Turner R, Kawahara H, Irino T. The processing and perception of size information in speech sounds. J. Acoust. Soc. Am. 2005;117:305–318. doi: 10.1121/1.1828637. [DOI] [PMC free article] [PubMed] [Google Scholar]
- Titze IR. Physiologic and acoustic differences between male and female voices. J. Acoust. Soc. Am. 1989;85:1699–1707. doi: 10.1121/1.397959. [DOI] [PubMed] [Google Scholar]
- Turner RE, Al-Hames MA, Smith DRR, Kawahara H, Irino T, Patterson RD. Vowel normalisation: Time-domain processing of the internal dynamics of speech. In: Divenyi P, editor. Dynamics of Speech Production and Perception. IOS Press; 2005. in press. [Google Scholar]


