Abstract
Electrical stimulation of neonatal cardiac myocytes produces hypertrophy and cellular maturation with increased mitochondrial content and activity. To investigate the patterns of gene expression associated with these processes, cardiac myocytes were stimulated for varying times up to 72 hr in serum-free culture. The mRNA contents for genes associated with transcriptional activation [c-fos, c-jun, JunB, nuclear respiratory factor 1 (NRF-1)], mitochondrial proliferation [cytochrome c (Cyt c), cytochrome oxidase], and mitochondrial differentiation [carnitine palmitoyltransferase I (CPT-I) isoforms] were measured. The results establish a temporal pattern of mRNA induction beginning with c-fos (0.25–3 hr) and followed sequentially by c-jun (0.5–3 hr), JunB (0.5–6 hr), NRF-1 (1–12 hr), Cyt c (12–72 hr), and muscle-specific CPT-I (48–72 hr). Induction of the latter was accompanied by a marked decrease in the liver-specific CPT-I mRNA, thus supporting the developmental fidelity of this pattern of gene regulation. Consistent with a transcriptional mechanism, electrical stimulation increased c-fos, β-myosin heavy chain, and Cyt c promoter activities. These increases coincided with a rise in their respective endogenous gene transcripts. NRF-1, cAMP response element, and Sp-1 site mutations within the Cyt c promoter reduced luciferase expression in both stimulated and nonstimulated myocytes. Mutations in the NRF-1 and CRE sites inhibited the induction by electrical stimulation (5-fold and 2-fold, respectively) whereas mutation of the Sp-1 site maintained or increased the fold induction. This finding is consistent with the appearance of NRF-1 and fos/jun mRNAs prior to that of Cyt c and suggests that induction of these transcription factors is a prerequisite for the transcriptional activation of Cyt c expression. These results support a regulatory role for NRF-1 and possibly AP-1 in the initiation of mitochondrial proliferation.
Keywords: cytochrome c promoter, nuclear respiratory factor 1, AP-1 proteins, carnitine palmitoyltransferase, isoform switching
Hearts subjected to hemodynamic stress increase intermediate early gene and contractile protein expression as part of the hypertrophic response. Mechanical stimuli applied to cardiac myocytes in culture also enhance c-fos expression and re-expression of β-myosin heavy chain (β-MHC), both characteristic of the hypertrophic growth response (see ref. 1 for review). Electrical stimulation of neonatal ventricular myocytes in culture increases both the amount and organization of myofibrillar proteins accompanied by expression of cardiac myosin light chain 2 and atrial natriuretic factor (2). We find that electrical stimulation elevates cardiac myocyte mRNA for the nuclear-encoded mitochondrial protein cytochrome oxidase (COX) subunit Va, with a simultaneous enhancement in mitochondrial number and activity (3). The latter results suggest that mitochondria are induced to proliferate as a result of increased energy demand. Although this was documentation of induced mitochondrial proliferation in cardiac myocytes in response to increased mechanical activity, similar increases in mitochondrial protein expression have been associated with exercise training or chronic electrical stimulation in skeletal muscle (see ref. 4 for review).
The mechanisms governing expression of nuclear-encoded mRNAs whose products function in the mitochondria are not well understood in mammalian systems. Serum or growth factors have been shown to stimulate mitochondrial mRNA levels (5). In cardiac myocytes undergoing hypertrophic growth, calcium signaling may mediate intermediate early gene expression (6, 7), with subsequent growth-dependent increases in mitochondrial protein. The promoters of many nuclear genes encoding respiratory subunits are at least partially dependent on nuclear respiratory factors (NRF-1 and NRF-2) (ref. 8; reviewed in ref. 9). These nuclear transcription factors also act on genes encoding key components of the mitochondrial transcription, replication (8, 10) and heme biosynthetic machinery (11), suggesting that they play a role in nuclear–mitochondrial interactions (12). Although the contribution of transcriptional and posttranscriptional mechanisms has not been established, increases in mitochondrial protein expression in response to electrical stimulation may be mediated in part through these and possibly other transcriptional activators.
Mechanical stress may also enhance mitochondrial differentiation by mediating expression of cardiac-specific proteins which should accompany myofibrillar organization and maturation (13). In heart, a major pathway for energy production is β-oxidation which is regulated by malonyl-CoA control of carnitine palmitoyltransferase I (CPT-I), which exists in both liver and muscle isoforms in the heart (14). Whereas the liver isoform contributes to greater than 25% of the total CPT-I activity in neonatal heart, this contribution decreases to less than 3% in adult heart (15). The CPT-I isoforms are encoded by different genes and demonstrate differing affinities for carnitine as well as differing sensitivities for malonyl-CoA. One indicator of mitochondrial differentiation in electrically stimulated cardiac myocytes has been characterized as isoform switching from the liver CPT-I (3), the predominant species found in the neonatal heart, to the muscle isoform that is characteristic of adult heart (15).
The present study establishes that electrical stimulation of cardiomyocytes results in sequential activation of nuclear gene expression leading to mitochondrial proliferation and differentiation. This result represents a developmentally significant pathway because it is accompanied by a switch from liver to muscle-specific CPT-I isoform expression. Increases in both myogenic and respiratory function were documented by coordinate up-regulation of mRNAs encoding β-MHC, COX subunit Va (COXVa), and cytochrome c (Cyt c). We demonstrate that the increased expression of Cyt c mRNA is controlled at the transcriptional level and is preceded by induction of the mRNAs for fos/jun (AP-1) and NRF-1. The latter is an activator of Cyt c transcription (8) and elimination of the Cyt c NRF-1 site by mutation markedly diminishes the stimulatory response. The results are consistent with NRF-1 induction being an early event in the pathway leading to respiratory gene expression and mitochondrial proliferation.
MATERIALS AND METHODS
Cell Culture and Electrical Stimulation.
Neonatal (1–3 days old) cardiac myocytes were isolated and plated in 12-well dishes in DMEM supplemented with 10% hyclone calf serum at a plating density of 4 × 10⁵ cells/cm (16). After 24 hr, the serum-containing medium was removed, and the cells were washed and maintained for 72 hr in DMEM in the absence of serum, containing 1% BSA (fraction V). The medium was exchanged for fresh serum-free medium at 2 days. After 4 days in culture (24 hr plus serum, 72 hr minus serum), three wells containing myocytes were stimulated for 10 different time points, ranging from 15 min to 72 hr as described by Brevet et al. (17) and modified by McDonough et al. (6). Stimuli were 80 V with a pulse duration of 10 msec at a pacing frequency of 5 Hz. Three additional wells in the dish were maintained in the same medium as the stimulated cells, but in the absence of contractile stimulation. During the experimental period, the medium bathing the control and stimulated cells was changed after 48 hr to fresh DMEM plus 1% BSA.
Preparation of cDNA Probes.
The cDNA probes for liver CPT-I (L CPT-I), muscle CPT-I (M CPT-I), and β-MHC were generated as described (3). The primers were designed from published sequences as follows: L CPT-I, P1, 5′-GGAGGATCCTGAGGCATCCATCGA-3′, and P2, 5′-GTGAGTCGACTGCTGCAAGATACTTGG-3′; M CPT-I, P1, 5′-AGTTCAGAAACGAACGGCCCTGC-3′, and P2, 5′-AACCAACACTAGGCACCTAAGG-3′; β-MHC, P1, 5′-TGCGACCAGCTGA TCA-AGAACAAG-3′, and P2, 5′-CTTTGCTCGCTCCA- GCTCCATGC-3′.
The cDNA probes were obtained using total RNA from neonatal rat liver (L CPT-I, 738 bp), neonatal rat skeletal muscle (M CPT-I, 428 bp), or neonatal rat heart (β-MHC, 408 bp) using reverse transcription–PCR (PCT-100; MJ Research, Watertown, MA). The PCR products were cloned to the TA cloning vector using the TA Cloning Kit (Stratagene). The cDNA probes were sequenced by the dideoxy-mediated chain termination method and sequence analysis was performed using the Genetics Computer Group sequence analysis package, version 7.2 (University of Wisconsin, Madison). L CPT-I, M CPT-I, and β-MHC probes were released from the TA cloning vectors by EcoRI digestion. The 650-bp fragment of COXVa was released from the vector pOC 1318/Eco (provided by Eric Schon, Columbia University) after digestion with EcoRI. The 960-bp genomic fragment of Cyt c, cloned into pRC4, was released by digestion with BamHI and EcoRI. The cDNA fragment of c-fos (780 bp, a gift of Ann-Bin Shyu, University of Texas Medical School, Houston, with permission of Inder Verma, Salk Institute) was released from pUC12 (pF100) by digestion with NcoI. The 1.6-kb cDNA fragment of c-jun was digested from pJAC.1 (gift of Ann Bin Shyu and permission obtained from Daniel Nathans, Johns Hopkins University). Sue-Hwa Lin (M. D. Anderson Cancer Center) provided the 18S rRNA which had been purchased from Ambion (Austin, TX). The cDNA was obtained by digestion with EcoRI and HindIII, resulting in a 150-bp fragment for use as an internal standard of RNA loading. The cDNA probes were purified by 1% agarose gel electrophoresis and were labeled to high specific activity using random primer labeling (Promega).
RNA Isolation and Northern Blot Analysis.
RNA was isolated (Ultraspec RNA isolation system, Biotex Laboratories, Houston) from cultured neonatal rat cardiac myocytes in serum-free medium after 10 different time periods in the absence or presence of electrical stimulation (0, 15 min, 30 min, 1 hr, 3 hr, 6 hr, 12 hr, 24 hr, 48 hr, and 72 hr). For Northern blot analysis, 20 μg of total cellular RNA was electrophoresed in 1% agarose containing 0.6% formaldehyde at 45 V for 3 hr. After prehybridization, hybridization and washing, the blots were visualized by autoradiography following storage at −70°C for 24–72 hr. The relative amounts of each RNA present were assessed by densitometric scanning in the linear response range.
Preparation of NRF-1 Riboprobe and RNase Protection Assay.
The MNRFIRP plasmid containing the 487-bp ClaI–SphI fragment includes coding exon 2 of the mouse NRF-1 gene in pGEM7Zf. Radiolabeled RNA transcripts were synthesized from template DNA linearized with Eco0109 as described by the Promega technical manual using SP6 RNA polymerase, ATP, GTP, UTP, and [α-32P]CTP (0.5 mM each) in the presence of RNasin and spermidine. After DNase digestion, the cRNA probes were hybridized to 20 μg total RNA. The unhybridized RNA was digested with RNase A (Boehringer Mannheim) and the RNA/RNA hybrid was analyzed using 3.5% PAGE in the presence of 8 M urea. Autoradiography and densitometric scanning of x-ray films was performed as described above for Northern blots.
Preparation of Plasmids for Transfection.
The pFOS.Luc plasmid was constructed by cloning the SmaI and HindIII fragment of pFOS.CAT (Russell Lebovitz, Baylor College of Medicine) containing 12 bp of exon 1 and 360 bp of the 5′ flanking sequence of mouse genomic c-fos into the pGL3-Basic vector which contains the cDNA encoding modified firefly luciferase (Promega). The pβ-MHC.Luc plasmid was constructed by cloning the SmaI and HindIII fragment containing 300 bp of 5′ flanking sequence of rat genomic β-MHC from KSVOCAT (Eugene Morkin, University of Arizona) into pGL3-Basic vector containing the cDNA for modified firefly luciferase. Plasmids pFOS.Luc and the pβ-MHC.Luc were sequenced as described above to confirm the identity of each cDNA probe. The plasmid pRC4Luc/−326 was constructed by cloning the BglII and XhoI fragment containing 1.1 kb of the first intron and the 5′ flanking sequence of rat Cyt c from RC4CAT/−326 into the pG13-Basic vector. The plasmids containing the mutated Cyt c promoter constructs (Sp1, NRF-1, and the cAMP response element (CRE) double mutant, see below) were generated by cloning the BglII and XhoI fragments of the respective mutant promoters into pGL3-Basic vector. The RSV-gal Luc plasmid was used as a monitor of transfection efficiency (Frank Booth, University of Texas Medical School, Houston).
DNA Transfection.
Cardiac myocytes were grown in serum-containing medium for 24 hr, changed to serum-free medium containing 1% BSA, and maintained for another 24 hr. The myocytes were transfected by the (Ca)3(PO4)2 precipitation method (18). For cotransfection, either 2 μg of pβ-MHC.Luc, 2 μg of the wild-type pRC4.Luc reporter plasmid or 2 μg each of the series mutants of Cyt c reporter plasmids (below) was cotransfected with 2 μg of Rous sarcoma virus (RSV) β-galactosidase (β-gal) expression plasmid. Six hours after transfection, the cells were washed twice and maintained in serum-free medium for another 12 hr. Electrical stimulation was then initiated and cell extracts were isolated either at the point at which electrical stimulation began (zero time) or after 6, 12, 24, 48, and 72 hr. To identify the elements in the Cyt c promoter that are responsive to electrical stimulation, the wild-type Cyt c promoter, RC4/−326 [or its mutants, NRF-1: −172/−147, BamHI linker insertion at SphI (19); the double activating transcription factor (CRE) mutant: −119/−96, from CTACGTCAC to CTAatTaAt, and −281/−256 from TGACGTCA to TGAatTaA; and the Sp-1 mutation in the first intron: +83/+100; bases +103 and +104 mutated from CC to ag] were cotransfected with RSV β-gal, as above, and the cell extracts subsequently isolated following 24 hr of electrical stimulation. The control cells were maintained under the same conditions as the stimulated cells, only in the absence of electrical stimulation. Luciferase and β-gal assays were performed (19) and normalized to protein content (20).
Statistical Analysis.
Student’s t test for paired and nonpaired variates was employed to determine significant differences between groups. Results are expressed as the mean ± SE.
RESULTS
Electrical stimulation is known to increase sarcomeric gene expression and to produce cardiac myocyte hypertrophy (2, 6). Increased contractile protein content in the hypertrophied cells is accompanied by increased energy demand, as demonstrated by elevated mitochondrial mRNA and COX activity (3). The time course of increased mRNA expression during electrical stimulation should provide information on the coordination of sarcomeric and mitochondrial gene expression in the cardiac myocyte. Over the experimental time period of 15 min to 72 hr, tissue levels of β-MHC mRNA began to rise after 6 hr of stimulation and peaked at 24 hr (Fig. 1). Induction of COXVa mRNA began by 12 hr, with a peak at 24 hr. Both β-MHC and COXVa message levels were approximately seven times higher compared with control cells at 24 hr and remained elevated after 72 hr of electrical stimulation. These data suggest that electrical stimulation leads to a proliferation of mitochondrial respiratory complexes within the same time frame as the increase in mRNA for the contractile protein β-myosin.
Figure 1.
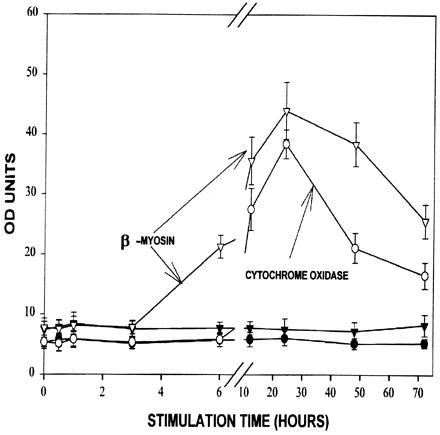
Increases in β-MC and COXVa mRNA following electrical stimulation in neonatal rat cardiac myocytes. Total RNA was extracted from cardiac in the absence (control cells; ▾, β-MHC; •, COX) and in the presence of electrical stimulation (▿, β-MHC; ○, COX). Quantitation of Northern blots was carried out by densitometric scanning as described. The results represent the mean ± SE of determinations on three different cultures.
In contrast, the change in mitochondrial CPT-I isoform content seen after electrical stimulation (3) is a result of later events that “turn on” expression of the muscle CPT-I isoform mRNA, and at the same time decrease that of the liver CPT-I isoform mRNA. This “switch” is initiated beginning at 48 hr of stimulation (Fig. 2), suggesting that differentiation to muscle-specific mitochondrial isoforms is subsequent to mitochondrial proliferation. Quantification of muscle CPT-I/18s RNA optical density ratios demonstrated significant increases (P < 0.005) in the stimulated cardiac myocytes at 48 and 72 hr compared with baseline values. The fact that the liver CPT-I mRNA is appropriately diminished (P < 0.005, liver CPT-I/18s RNA compared with baseline) at the time of muscle CPT-I induction confirms that the temporal pattern of mRNA expression observed throughout the course of electrical stimulation results from physiologically significant developmental changes.
Figure 2.
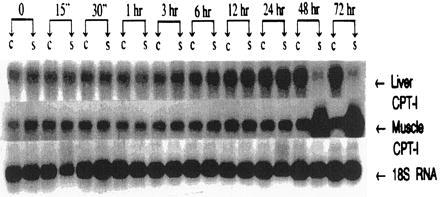
Induction of mRNA for the muscle isoform of CPT-I and decreased mRNA for the liver CPT-I isoform following electrical stimulation. RNA was isolated in the absence and presence of electrical stimulation. Northern blots for the liver and muscle CPT-I mRNA were quantified by densitometric scanning and normalized to 18s RNA for statistical analysis. “C” and “S” are results from control, nonstimulated myocytes and from electrically stimulated myocytes. The results are representative of RNA isolated from at least three different cultures. RNA loading controls are presented.
To determine whether mRNA induction is accompanied by enhanced gene transcription, luciferase promoter constructs for c-fos, β-MHC, and Cyt c were tested for their response to electrical stimulation following transfection. Transfection of the pβ-MHC.Luc promoter construct into control and stimulated cardiac myocytes resulted in peak luciferase expression at 24 hr (Fig. 3 and Inset), coincident with the peak rise in β-MHC mRNA (Fig. 1). A similar response was observed for the rat Cyt c/luciferase construct (RC4Luc/−326) (Fig. 3). Promoter activation was observed by 12 hr with maximal luciferase expression seen at 24 hr.
Figure 3.
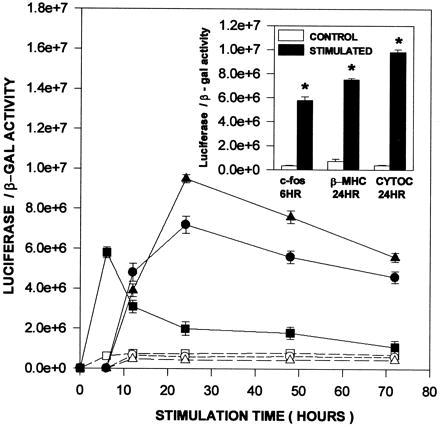
Increases in luciferase activity using promoter constructs for c-fos, β-MHC and Cyt c following electrical stimulation of neonatal rat cardiac myocytes. Plasmids pFOS.Luc, pβ-MHC.Luc, and pRC4Luc/−326 were cotransfected with RSV β-gal expression plasmid. After 18 hr in serum-free medium, luciferase expression was measured in control (nonstimulated; □, ○, and ▵, c-fos, β-MHC, and Cyt c, respectively) and in parallel cultures of electrically stimulated cells (▪, •, and ▴, c-fos, β-MHC, and Cyt c, respectively). The inset histograms are luciferase/β-gal ratios at the 24-hr time period after electrical stimulation (▪) and directly compared with control expression (□), where ★ = P < 0.01. The results represent three separate cultures each for luciferase and β-gal determinations (mean ± SE).
Increases in β-MHC, COXVa, and Cyt c mRNAs are preceded by an elevation in c-fos mRNA (at 15 min) which peaks at 30 min and returns to control, nonstimulated levels by 6 hr (Fig. 4), an observation which is consistent with the hypertrophic response (21, 22). To verify that the transient appearance of c-fos mRNA in the stimulated myocyte results from gene activation, the c-fos promoter/luciferase construct was also transfected into cardiac myocytes. Luciferase expression was significantly elevated (P < 0.01) when measured after 6 hr of electrical stimulation, confirming a transcriptional response (Fig. 3 and Inset). Thus, the coincidence in promoter activation and increased mRNA levels for c-fos, β-MHC, and Cyt c suggests that enhanced gene transcription is a major contributor to both early and later responses to electrical stimulation.
Figure 4.
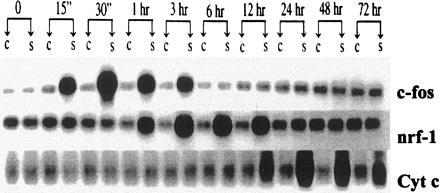
Sequential induction of mRNA for c-fos, NRF-1, and Cyt c after electrical stimulation. RNA was isolated from neonatal rat cardiac myocytes cultured in serum-free medium either in the absence or presence of electrical stimulation. Northern blots for c-fos and Cyt c mRNA were quantified by densitometric scanning. Quantitation of NRF-1 expression was carried out using densitometric scanning with normalization to 18s RNA following generation of the riboprobe and separation of the RNA/RNA hybrids. “C” and “S” represent results from control, nonstimulated myocytes and from electrically stimulated myocytes. The results are representative of RNA isolated from three different cultures. RNA loading controls for each time point are summarized in Fig. 2.
The above results suggested that a temporally ordered cascade of gene transcription may contribute to the final hypertrophic phenotype in stimulated cardiomyocyte cultures. If this is the case, induction of Cyt c mRNA may be preceded by induction of transcriptional activators that control its expression. One such factor is NRF-1, originally identified as an activator of Cyt c gene transcription (23) and subsequently found to act on many nuclear genes required for mitochondrial respiratory function (8, 10, 12). In addition, the Cyt c promoter has functional binding sites for the activating transcription factor/cAMP response element binding protein (ATF/CREB) family of transcription factors. These sites can respond to cAMP stimulation through CREB binding but may also be activated by AP-1, which binds a nearly identical site (23, 24).
To determine whether NRF-1 mRNA is induced prior to that of Cyt c, its steady-state level of expression was assayed throughout the time course of electrical stimulation. The results show that NRF-1 mRNA is induced relative to the nonstimulated control beginning at 1 hr and extending through 12 hr (Fig. 4). Quantification of the NRF-1/18s RNA optical density ratios at these times confirms significant increases (P < 0.005) from baseline values in the stimulated cells. This period overlaps with the late induction of c-fos (0.25–3 hr, where c-fos/18s RNA increases significantly from baseline, P < 0.005), and the initial time of Cyt c mRNA induction at 12 hr (P < 0.005 compared with baseline). The peak of NRF-1 mRNA induction (between 3 and 6 hr) clearly precedes the peak of Cyt c mRNA induction (between 24 and 48 hr). Because AP-1 consists of a fos/jun heterodimer, it was also of interest to determine whether jun mRNA was induced along with c-fos. As shown in Fig. 5, both c-jun and JunB are induced with similar kinetics by electrical stimulation. The induction of both jun mRNAs occurs between 0.5 and 6 hr in the time frame intermediate between c-fos and NRF-1. These results are consistent with the interpretation that the induced synthesis of NRF-1 and fos/jun (AP-1) may contribute to Cyt c gene transcription in response to electrical stimulation.
Figure 5.
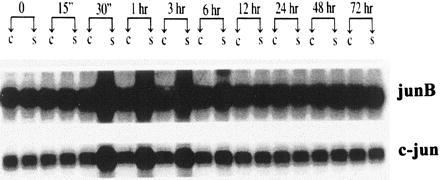
Sequential induction of mRNA for c-jun and JunB after electrical stimulation. RNA was isolated from neonatal rat cardiac myocytes cultured in serum-free medium either in the absence or presence of electrical stimulation. Northern blots for c-jun and JunB expression were quantitated by densitometric scanning. “C” and “S” represent results from control, nonstimulated myocytes and from electrically stimulated myocytes.
If the increased Cyt c promoter activity is mediated through these transcription factors, mutations in the Cyt c NRF-1 site and CREs should weaken or eliminate the inductive response. The relative importance of these promoter elements was therefore determined by transfection of mutated promoter constructs into nonstimulated and stimulated cardiac myocytes. Luciferase expression was determined after 24 hr. Mutations of the NRF-1, CRE, and Sp-1 sites reduced luciferase expression in both the stimulated and nonstimulated cells. The NRF-1 and CRE mutations inhibited luciferase expression to a greater degree for the stimulated myocytes compared with the nonstimulated myocytes. Therefore, the fold-induction by stimulation was diminished for these mutations (as shown by the S/N column in Fig. 6). Mutations in the NRF-1 site (−172/−147) resulted a 5-fold decrease in the induced level of luciferase expression compared with cells transfected with the wild-type promoter whereas double mutations in the CREs reduced the level of induction by 2-fold [Fig. 6, compare ratios of luciferase expression in stimulated (S) and nonstimulated (N) myocytes]. Although the Sp-1 mutations reduced luciferase expression, the fold-induction by stimulation was maintained or even increased. Therefore, the NRF-1 site and to a lesser extent the CREs make a specific contribution to the response of the Cyt c promoter to electrical stimulation, whereas the Sp-1 site may be more important for general regulation of expression from the Cyt c promoter. These results support the conclusion that the induced expression of NRF-1, c-fos, and c-jun/JunB is a prerequisite to the later induction of Cyt c and possibly other genes required for mitochondrial proliferation.
Figure 6.
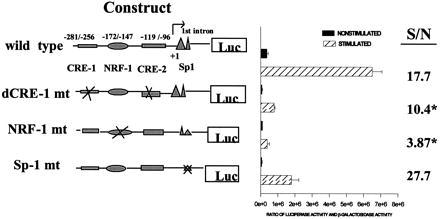
Luciferase expression of the transfected Cyt c promoter and its mutant constructs in control myocytes and following electrical stimulation. After 18 hr in serum-free culture, plasmids containing the wild type (RC4Luc/−326) and the mutated constructs (dCRE-1 mt, NRF-1 mt, and Sp1 mt) were cotransfected with β-gal. Cell extracts were isolated from stimulated cells (□) 24 hr after electrical stimulation, and after 24 hr from parallel cultures of nonstimulated myocytes (▪). The results (mean ± SE) represent activities from three different cultures. ∗, P < 0.05 compared with wild-type stimulated/nonstimulated ratio (S/N).
DISCUSSION
Induction of hypertrophy in neonatal cardiac myocytes using a variety of model systems and hypertrophic stimuli is associated with increases in intermediate early gene expression, induction of embryonic isoforms and contractile protein synthesis (25–28). Contractile stimulation of cardiac myocytes in serum-free culture results in cardiac growth and increased myofibrillar organization in vitro, suggesting that the alterations in myofibrillar content may occur by an autocrine pathway (29, 30). The mechanism by which increases in the contraction rate—e.g., by long-term electrical stimulation—influences the process of cardiac growth and differentiation is an intense area of investigation. McDonough et al. (6) have suggested that regulation of atrial natriuretic factor secretion by electrically stimulated neonatal rat cardiac myocytes is primarily dependent on contractile calcium transients and calmodulin kinase, independent of protein kinase C. Release of basic fibroblast growth factor from paced myocytes into the medium has been proposed to account for the hypertrophic response in adult rat ventricular myocytes (26). Other investigators have demonstrated that mechanical stretch activates phosphorylation cascades, including protein kinase C, mitogen-activated protein kinases and p90rsk (27). Cardiac myocyte hypertrophy can also be evoked by exogenous factors including angiotensin II (31), α-agonists, and insulin-like growth factors (29, 30).
Work from this laboratory has demonstrated that electrical stimulation of neonatal rat cardiac myocytes for 72 hr in culture produces increases in cellular mitochondrial profiles as well as myocyte content of COX mRNA (3). Although prolonged electrical stimulation could be argued to have deleterious effects on the cells, the fidelity of the CPT-I isoform switch and the high activity of muscle CPT-I and COX (3) at 72 hr are consistent with the highly differentiated morphology of these cells at late times. Other investigators have demonstrated that human mitochondrial adenine nucleotide translocase mRNA is increased by mitogens in a variety of cell types and is decreased in response to agents that induce terminal differentiation (5). A similar increase in selected mitochondrial proteins in the cardiac myocyte as a result of electrical stimulation suggests that increased mitochondrial biogenesis is an important intracellular response to growth initiators. In the present study, we have extended the electrical stimulation model of gene activation to examine the relationship between contractile protein gene expression and the induction of nuclear-encoded genes involved in mitochondrial biogenesis. Induction of β-MHC mRNA by electrical stimulation is first observed at 6 hr and slightly precedes increases in Cyt c mRNA (first observed at 12 hr), suggesting that the signals which give rise to contractile proteins and associated increases in energy demand are closely coordinated with the pathways leading to up-regulation of mitochondrial constituents.
The demonstration that electrical stimulation results in transcriptional activation of β-MHC is consistent with the reported increases in β-MHC mRNA and protein content in animal and cellular models of cardiac hypertrophy (see ref. 27 for a review). Sadoshima et al. (32) reported induction of intermediate early genes by stretch, an observation that is consistent with our findings of induction of intermediate early gene expression in the electrically stimulated neonatal cardiac myocytes, However, in the former studies, transfection of the 5′ flanking sequences of the β-MHC gene followed by 48 hr of stretch in serum-free culture medium produced no significant induction of a β-MHC–chloramphenicol acetyltransferase (CAT) construct (32). This finding is in contrast to the present studies where in the electrically stimulated neonatal cardiac myocyte, transcriptional activation of fetal contractile proteins occurs early, as actin is becoming organized into myofibrillar arrays and contractile activity is enhanced. The coincidence of the time course of promoter activation and mRNA accumulation observed here suggests that the increases in Cyt c and β-MHC mRNA in the stimulated myocyte are largely due to transcriptional activation, although any additional contribution resulting from message stabilization cannot be ruled out.
The regulatory mechanisms governing the expression of nuclear and mitochondrial genes encoding the respiratory apparatus in multicellular organisms are largely unknown. The presence of functional binding sites for nuclear respiratory factors (NRF-1 and NRF-2) in many nuclear genes encoding respiratory chain subunits as well as key constituents of the mitochondrial transcription, replication, and heme biosynthetic machinery is suggestive of a role for these transcription factors in respiratory chain biogenesis and function (reviewed in ref. 9). In the present study, the induction of NRF-1 mRNA prior to that of Cyt c is consistent with NRF-1 induction being a prerequisite for respiratory chain synthesis. Interestingly, the time course of Cyt c mRNA induction is very similar to that brought about by transcriptional activation of Cyt c gene expression in response to thyroid hormone (33). Moreover, c-fos mRNA induction displays its characteristic early response observed in this and other systems (27, 32) and the developmental switch in CPT-I isoform mRNA expression occurs as expected. These observations support the physiological significance of this temporal pattern of mRNA expression and are consistent with the idea that NRF-1 mediates a transcriptional response to a physiological signal. Thus, NRF-1 and possibly other transcription factors that have been implicated in respiratory gene expression may play an important role in mitochondrial biogenesis in the heart.
This model of sequential gene activation allows separation in time of transcriptional events in mitochondrial biogenesis from those leading to mitochondrial differentiation. For example, the “switch” in CPT-I isoform expression (differentiation) occurs much later than does the transcriptional up-regulation in respiratory protein mRNA content (proliferation). Electrical stimulation produces an increase in the mRNA and protein expression of the muscle CPT-I isoform whereas coincidentally, the mRNA and protein expression of the liver isoform are decreased. Although the signal leading to this response is not known, the “on” and “off” nature of the change in mRNA as well as the time delay in the switch both suggest that a mechanism other than NRF-1 activation may be involved. A potential candidate for targeting the muscle isoform of CPT-I to the heart is the nuclear receptor response element (NRRE-1) which confers cardiac and brown adipose tissue expression to another fatty acid metabolizing enzyme, medium chain acyl-CoA dehydrogenase (34). Other potential cardiac regulatory sequences present in the 5′ flanking sequences of the human CPT-I promoter (sequence obtained from the GenBank database) include a single NK2 binding site (“tinman”), E BOX sequences that play a role in cardiac morphogenesis and postnatal skeletal muscle development (35), and GATA factor and MEF2 binding sites important in cardiac muscle gene expression (36). Alternatively, Izquierdo et al. (37) have suggested that although proliferation of mitochondria is controlled at the transcriptional level, differentiation may be controlled by an increase in message stability and postnatal activation of translational rates affecting mitochondrial proteins. The latter effect may reflect the elevated rates of ribosomal biogenesis in contraction-induced hypertrophy, reflecting increased transcription of the UBF gene (38).
In summary, electrical stimulation is associated with increased levels of mRNA for the mitochondrial proteins, COX and Cyt c. The rise in mRNA content is associated with activation of Cyt c promoter activity, which is preceded by the up-regulation of the transcription factors c-fos, c-jun (and JunB), and NRF-1. We conclude that the increase in mitochondrial content and activities in the electrically stimulated cardiac myocyte is due to transcriptional activation of nuclear-encoded respiratory chain components. The sequential production of mRNA for candidate binding proteins provides a means to determine which transacting proteins are physiologically relevant during growth and differentiation of the cardiac myocyte.
Acknowledgments
We thank Lei Huo for the MNRF1RP plasmid. This work was supported by U.S. Public Health Service Grants RO1 HL38863 to J.B.M. and GM32525 to R.C.S.
ABBREVIATIONS
- β-MHC
β-myosin heavy chain
- NRF
nuclear respiratory factor
- CTP-I
carnitine palmitoyltransferase I
- COX
cytochrome oxidase
- Cyt c
cytochrome c
- β-gal
β-galactosidase
- CRE
cAMP response element
- RSV
Rous sarcoma virus
References
- 1.Komuro I, Yazaki Y. Annu Rev Physiol. 1993;55:55–75. doi: 10.1146/annurev.ph.55.030193.000415. [DOI] [PubMed] [Google Scholar]
- 2.McDonough P M, Glembotski C C. J Biol Chem. 1992;267:11665–11668. [PubMed] [Google Scholar]
- 3.Xia Y, Buja L M, McMillin J B. J Biol Chem. 1996;271:12082–12087. doi: 10.1074/jbc.271.20.12082. [DOI] [PubMed] [Google Scholar]
- 4.Booth F W, Thomason D B. Physiol Rev. 1991;71:541–585. doi: 10.1152/physrev.1991.71.2.541. [DOI] [PubMed] [Google Scholar]
- 5.Battini R, Ferrari S, Kaczmarek L, Calabretta B, Chen S T, Baserga R. J Biol Chem. 1987;262:4355–4359. [PubMed] [Google Scholar]
- 6.McDonough P M, Stella S L, Glembotski C C. J Biol Chem. 1994;269:9–17. [PubMed] [Google Scholar]
- 7.Komuro I, Katou Y, Hoh E, Takaku F, Yazaki Y. Jpn Circ J. 1991;55:1149–1157. doi: 10.1253/jcj.55.1149. [DOI] [PubMed] [Google Scholar]
- 8.Evans M J, Scarpulla R C. Genes Dev. 1990;4:1023–1034. doi: 10.1101/gad.4.6.1023. [DOI] [PubMed] [Google Scholar]
- 9.Scarpulla R C. Trends Cardiovas Med. 1996;6:39–45. doi: 10.1016/1050-1738(95)00129-8. [DOI] [PubMed] [Google Scholar]
- 10.Virbasius C A, Virbasius J V, Scarpulla R C. Genes Dev. 1993;7:2431–2445. doi: 10.1101/gad.7.12a.2431. [DOI] [PubMed] [Google Scholar]
- 11.Braidotti G, Borthwick I A, May B K. J Biol Chem. 1993;268:1109–1117. [PubMed] [Google Scholar]
- 12.Virbasius J V, Scarpulla R C. Proc Natl Acad Sci USA. 1994;91:1309–1313. doi: 10.1073/pnas.91.4.1309. [DOI] [PMC free article] [PubMed] [Google Scholar]
- 13.Houldsworth J, Attardi G. Proc Natl Acad Sci USA. 1988;85:377–381. doi: 10.1073/pnas.85.2.377. [DOI] [PMC free article] [PubMed] [Google Scholar]
- 14.Weis B C, Esser V, Foster D W, McGarry J D. J Biol Chem. 1994;269:18713–18715. [PubMed] [Google Scholar]
- 15.Brown N F, Weis B C, Husti J E, Foster D W, McGarry J D. J Biol Chem. 1995;270:8952–8957. doi: 10.1074/jbc.270.15.8952. [DOI] [PubMed] [Google Scholar]
- 16.McMillin J B, Hudson E K, Buja L M. Methods Toxicol. 1993;2:301–309. [Google Scholar]
- 17.Brevet A, Pinto E, Peacock J, Stockdale F E. Science. 1976;193:1152–1154. doi: 10.1126/science.959833. [DOI] [PubMed] [Google Scholar]
- 18.Poyton R O, Trueblood C E, Wright R M, Farrell L E. Ann NY Acad Sci. 1988;550:289–307. doi: 10.1111/j.1749-6632.1988.tb35344.x. [DOI] [PubMed] [Google Scholar]
- 19.Ausubel F M, Brent R, Kingston R, Struhl K. In: Current Protocols in Molecular Biology. Ausubel F M, Brent R, Kingston R E, Moore D D, Seidman J G, Smith J A, Struhl K, editors; Ausubel F M, Brent R, Kingston R E, Moore D D, Seidman J G, Smith J A, Struhl K, editors. Vol. 1. New York: Wiley; 1995. pp. 9.7.12–9.7.18. [Google Scholar]
- 20.Lowry O H, Rosebrough N J, Farr A L, Randall R J. J Biol Chem. 1951;193:265–275. [PubMed] [Google Scholar]
- 21.Komuro I, Kaida T, Shibazaki Y, Kurabayashi N, Katoh Y, Hoh E, Takaku F, Yazaki Y. J Biol Chem. 1990;265:3595–3598. [PubMed] [Google Scholar]
- 22.Schneider M D, Roberts R, Parker T G. Mol Biol Med. 1991;8:167–183. [PubMed] [Google Scholar]
- 23.Evans M J, Scarpulla R C. J Biol Chem. 1989;264:14361–14368. [PubMed] [Google Scholar]
- 24.Gopalakrishnan L, Scarpulla R C. J Biol Chem. 1994;269:105–113. [PubMed] [Google Scholar]
- 25.Chien, K. R., Knowlton, K. U., Zhu, H. & Chien, S. FASEB J. 5, 3037–3046. [DOI] [PubMed]
- 26.Kaye D, Pimental D, Prasad S, Maki T, Berger H J, McNeil P L, Smith T W, Kelly R A. J Clin Invest. 1996;97:281–291. doi: 10.1172/JCI118414. [DOI] [PMC free article] [PubMed] [Google Scholar]
- 27.Yamazaki T, Komuro I, Yazaki Y. J Mol Cell Cardiol. 1995;27:133–140. doi: 10.1016/s0022-2828(08)80013-2. [DOI] [PubMed] [Google Scholar]
- 28.MacLellan W R, Brand T, Schneider M D. Circ Res. 1993;73:783–791. doi: 10.1161/01.res.73.5.783. [DOI] [PubMed] [Google Scholar]
- 29.Ito H, Hiroe M, Hirata Y, Tsujino M, Adachi S, Shichiri M, Keike A, Nogami A, Marumo F. Circulation. 1993;87:1715–1721. doi: 10.1161/01.cir.87.5.1715. [DOI] [PubMed] [Google Scholar]
- 30.Kariya K, Karas L R, Simpson P C. J Biol Chem. 1994;269:3775–3782. [PubMed] [Google Scholar]
- 31.Sadoshima J, Qui Z, Morgan J P, Izumo S. Circ Res. 1995;76:1–15. doi: 10.1161/01.res.76.1.1. [DOI] [PubMed] [Google Scholar]
- 32.Sadoshima J, Jahn L, Takahashi T, Kulik T J, Izumo S. J Biol Chem. 1992;267:10551–10560. [PubMed] [Google Scholar]
- 33.Scarpulla R C, Kilar M C, Scarpulla K M. J Biol Chem. 1986;261:4660–4662. [PubMed] [Google Scholar]
- 34.Disch D L, Rader T A, Crisci S, Leone T C, Barger P M, Vega R, Wood P A, Kelly D P. Mol Cell Biol. 1996;16:4043–4051. doi: 10.1128/mcb.16.8.4043. [DOI] [PMC free article] [PubMed] [Google Scholar]
- 35.Srivastava D, Cserjesi P, Olson E N. Science. 1995;270:1995–1998. doi: 10.1126/science.270.5244.1995. [DOI] [PubMed] [Google Scholar]
- 36.Olson E N, Srivastava D. Science. 1996;272:671–676. doi: 10.1126/science.272.5262.671. [DOI] [PubMed] [Google Scholar]
- 37.Izquierdo J M, Ricart J, Ostronoff L K, Egea G, Cuezva J M. J Biol Chem. 1995;270:10342–10350. doi: 10.1074/jbc.270.17.10342. [DOI] [PubMed] [Google Scholar]
- 38.Hannan P D, Luyken J, Rothblum L I. J Biol Chem. 1996;271:3213–3220. doi: 10.1074/jbc.271.6.3213. [DOI] [PubMed] [Google Scholar]


