

Summary
Engagement of the T cell antigen receptor (TCR) during antigen presentation initiates a coordinated action of a large number of signaling proteins and ion channels. AHNAK1 is a scaffold protein, highly expressed novel and a critical component for calcium signalling during CD4 T cell activation. We show that AHNAK1−/− mice are highly susceptible to Leishmania major infection. We found that AHNAK1−/− CD4 T cells respond poorly to TCR stimulation in vitro with low proliferation and low IL-2 production. Furthermore, AHNAK1 deficiency results in a reduced calcium influx upon TCR cross-linking and subsequent poor NFAT activation. We found that AHNAK1 is required for plasma membrane expression of L-type calcium channels α1S (Cav1.1) probably through its interaction with the β regulatory subunit.
Introduction
Scaffold proteins serve to localize certain proteins/enzymes to their site of action, thereby, organizing the correct repertoires of enzymes into individual signaling pathways. Scaffold proteins interact through distinct domains with multiple proteins, and can link the cytoskeleton to the plasma membrane, or serve as meeting platforms for kinases and substrates to orchestrate signaling cascades (Pawson and Scott, 1997). A few examples for such specialized protein modules that mediate formation of signaling complexes are src homology 2 (SH2) domains or src homology 3 (SH3) (Pawson and Scott, 1997), pTyr-binding (PTB) domains (Shc and insulin receptor substrate-1 (IRS-1) proteins) (Blaikie et al., 1994; Gustafson et al., 1995; Kavanaugh and Williams, 1994) and PDZ domains (Doyle et al., 1996). PDZ domains are particularly interesting because their interactions can promote clustering of transmembrane receptors at specific subcellular sites and have an especially important role in the spatial organization of ion channels (Chevesich et al., 1997; Dong et al., 1997; Kornau et al., 1995; Simske et al., 1996).
Calcium plays critical and specific roles in many T cell functions including activation, proliferation, and cytokine production (Cantrell, 1996; Lewis, 2001). Engagement of the T cell antigen receptor (TCR) during antigen presentation initiates a sensitive, highly regulated response that relies on the coordinated action of a large number of signaling proteins (Dustin and Cooper, 2000). Thus, under certain conditions receptor engagement leads to the assembly of a characteristic supramolecular activation cluster on the T lymphocyte side of the interface (Monks et al., 1998), which is most likely mediated by scaffold proteins. A typical calcium response occurs in two distinct steps. The initial response is believed to result from calcium release from the ER (Berridge, 1993). The decrease in ER calcium triggers extracellular calcium influx by activating store-operated calcium (SOC) channels in the plasma membrane, which leads to a sustained increase in intracellular calcium (Hoth and Penner, 1992; Zweifach and Lewis, 1993). Although the majority of studies is focused on the molecular identity of CRAC channels (Calcium release activated calcium channels) (Lewis, 2007), the complexity of the calcium response in T cells suggests the expression of more than one type of plasma membrane calcium channel. In other cell types, notably excitable cells, which take up calcium in response to membrane depolarization, L-type calcium channels (Cav) channels constitute the major route of calcium entry (Catterall, 2000). Cav channel complexes consist of the pore-forming α1 subunit, in addition to the α2, δ, γ, and β subunits. Cav β̃subunits are cytoplasmic proteins that strongly regulate Cav channels through direct interaction with the pore-forming α1 subunits and are required for assembly of the channel complex (Tareilus et al., 1997), correct plasma membrane targeting (Chien et al., 1998; Gao et al., 1999), and stimulation of channel activity (Freise et al., 1999). We showed that CD4 T cells express α1 subunits of Cav1 family, but not Cav2 or Cav3, and that a functional Cav β4 and β3 regulatory subunits are necessary for normal TCR-triggered calcium response, NFAT nuclear translocation, and cytokine production(Badou et al., 2006). Furthermore, recent studies in our lab provide new electrophysiological insights into the role of Cav1.1 in calcium entry to T cells following TCR cross-linking (Badou et al., 2007) (preprint enclosed with this submitted paper). We showed that, similarly to their roles in other tissues like muscle, Cav1.1 channels conduct calcium current in T cells following activation. We found that Cav1.1 conduct an inward rectifying current in T cells that shows no voltage or time dependence, which is very different from the voltage gated current recorded in excitable cells (Badou et al., 2007). Together with other studies (Badou et al., 2001; Badou et al., 1997; Kotturi et al., 2003; Kotturi and Jefferies, 2005; Savignac et al., 2004; Stokes et al., 2004), this suggests a physiological function for Cav1 channels in T lymphocytes.
The AHNAK family of scaffold PDZ proteins consist of two giant proteins (700KDa), Desmoyokin/ AHNAK (AHNAK1) and AHNAK2 (Komuro et al., 2004; Kudoh et al., 1995; Shtivelman and Bishop, 1993). AHNAK1 is a protein composed of 5,643 amino acids predicted from the genomic sequence that can be divided into three main structural regions: the NH2-terminal 251 amino acids, a large central region of 4,390 amino acids composed of a 128-aa unit repeated 26 times, and a COOH-terminal 1,002 amino acids. AHNAK1 expression is tightly linked with proliferation. For example, the expression of AHNAK1 is upregulated in promyelocytic leukaemia, suggesting the involvement of AHNAK1 in tumor formation (Shtivelman et al., 1992).
Recent studies have already described an important role of PDZ containing scaffold proteins for NF-kB activation and cell polarity following T cell activation (Jun and Goodnow, 2003; Ludford-Menting et al., 2005; Muller et al., 1995; Thome, 2004; Xavier et al., 2004), but the involvement of such proteins in ion channel function remains unknown. Involvement of AHNAK1 in calcium signalling was suggested through the identification of some of its interacting proteins. In vitro, AHNAK1 fragments bind and activate phospholipase C-γ1 (PLCγ1) in the presence of arachidonic acid (Sekiya et al., 1999). AHNAK1 is also a major target protein for the calcium- and zinc-binding protein S100B (Gentil et al., 2001) and the annexin2/S100A10 complex (Benaud et al., 2004). AHNAK1 immunoreactivity has been found in vesicles for calcium-induced exocytosis in a neuronal cell line (Borgonovo et al., 2002). In cardiomyocytes, AHNAK1 associates with the of cardiac Cav channels at the plasma membrane, and is phosphorylated by PKA in response to β-adrenoreceptor stimulation (Haase et al., 2005; Haase et al., 1999). Here we show that CD4 T cell function requires AHNAK1, which is required for calcium influx following TCR stimulation.
Results
AHNAK1 expression in immune tissues and T cells
Previously, we described the generation of AHNAK1−/− mice by homologous recombination using mouse ES cells. Surprisingly, since AHNAK1 is ubiquitously expressed, AHNAK1−/− mice developed normally and showed no overt phenotype (Komuro et al., 2004). However, western blotting of various tissues revealed that in wild-type mice, AHNAK1 was expressed strongly in spleen and lymph nodes, notably in splenic CD4 T cells but was expressed weakly in thymus, suggesting that AHNAK1 may play a role in peripheral T cells (Fig. 1A). AHNAK1−/− mice showed normal development of thymocytes (sFig. 1), normal lymphoid composition in their thymus and spleen (Fig. 1B) and normal populations of naïve/memory CD4 T cells measured by flow cytometry after staining with anti-CD62L and anti-CD44 antibodies (Fig. 1C).
Figure 1.
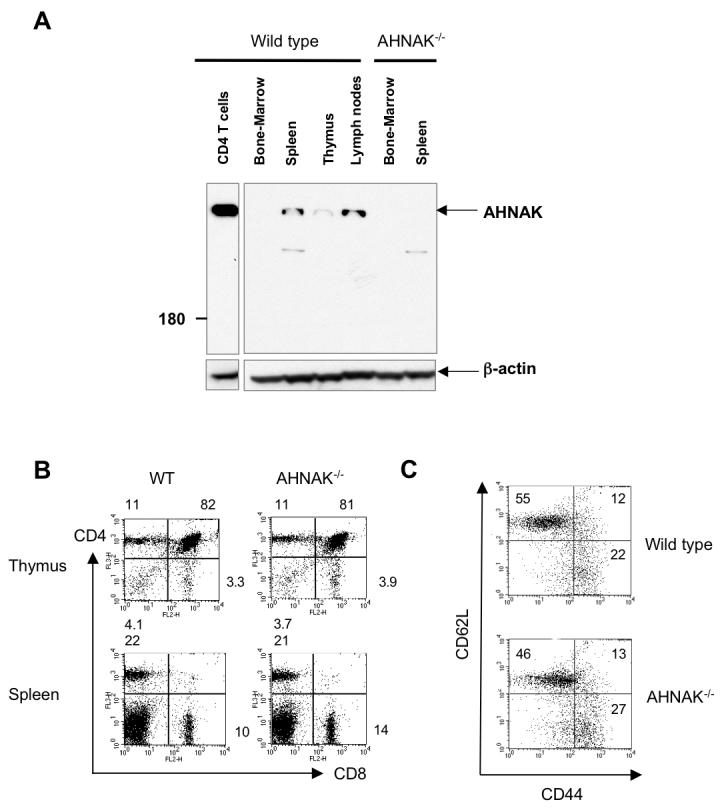
Expression of AHNAK1 in T cells. (A) Bone marrow, spleen, thymus and lymph nodes were isolated from wild-type and AHNAK1−/− mice. The expression of AHNAK1 in tissues and CD4 T cells was examined by western blot analysis using anti-AHNAK1-C2 antibody. β-actin was used for loading control. Results are representative of at least three independent experiments. (B) Normal CD4/CD8 composition of AHNAK1−/− T cells in thymus and spleen. Thymocytes/splenocytes from wild-type and AHNAK1−/− mice were prepared, stained with anti-CD4 and anti-CD8 antibodies and analyzed by flow cytometry. Results are representative of at least three independent experiments. (C) Normal memory/naïve population of AHNAK1−/− T cells. Splenocytes from both wild-type and AHNAK1−/− mice were analyzed by flow cytometry using anti-CD44 and CD62L antibody as in C. Results are representative of at least three independent experiments.
AHNAK1 is required for in vivo immune responses
Previously, it has been shown that CD4 T cells are essential to protect the host from infection by the Leishmania major parasite. Generally, mice that mount a Th1-type immune response, characterized primarily by the production of IFNγ, resolve their lesions and heal. Conversely, mice that mount a Th2 response, characterized primarily by the production of interleukin-4, 5, 10 and 13, die from fulminant non-healing infections (Kane and Mosser, 2000; Sacks and Noben-Trauth, 2002). To test the function of AHNAK1 in CD4 T cell function in vivo, wild-type and AHNAK1−/− mice were infected with 106 stationary phase L. major promastigotes intradermally in the foot. AHNAK1−/− mice showed severely enhanced lesion development and increased number of parasites in the lesion at two weeks post-infection (Fig. 2A and B). Histological examination by hematoxylin & eosin staining revealed that the footpads of AHNAK1−/− mice showed severe infiltration of mononuclear cells (data not shown). To test T cell function during the infection, we isolated CD4 T cells from draining lymph nodes from wild-type and AHNAK1−/− mice two weeks post-infection and stimulated with L. major antigen, then analyzed IFNγ and IL-4 cytokine production by ELISA. CD4 T cells from AHNAK1−/− mice showed severe impairment of the production of IFNγ (required for the clearance of L. major in vivo) and a dramatic increase in IL-4 production, suggesting that AHNAK1 is required for development of a Th1 response against L. major (Fig. 2C). Therefore, since AHNAK1−/− CD4 T cells are poorly activated, they fail to mount a Th1 response, even with a high infecting parasite dose or in in vitro culture stimulation with anti-CD3 (sFig 2). Macrophages are yet another cell type, which play an essential role in the host response against L. major infection, however they do not express the AHNAK1 protein (Fig 2D). To test if innate immune response of AHNAK1−/− macrophages is normal, we challenged peritoneal macrophages from wild-type and AHNAK1−/− mice with L. major in vitro and the number of parasites were counted. There was no significant difference in parasite burden between wild-type and AHNAK1−/− macrophages; further activation of the macrophages (IFNγ + LPS) resulted in parasite destruction in both wild-type and AHNAK1−/− macrophages, indicating that impaired function of CD4 T cells is the major cause of the susceptibility of mice to L. major infection (Fig. 2E).
Figure 2.

AHNAK1 is required for protection against Leishmania major infection. Wild-type and AHNAK1 mice were challenged in the right hind foot with 106 L. major stationary phase promastigotes. (A) Lesion development (as a ratio of infected foot to non-infected foot) results with time postinfection. Results are representative of at least three independent experiments. (B) At 2 weeks postinfection, four mice per group were sacrificed and parasite burden was determined by limiting dilution assay. Results shown are representative of two independent experiments. (C) wild-type IFNγ and IL-4 levels were measured by ELISA in 96 hrs culture supernatant of purified popliteal lymph node CD4 T cells from infected mice cultured with irradiated wild-type APCs and indicated doses of L.major antigen. Results shown are representative of two independent experiments with 3 infected mice in each group. (D) Macrophages and CD4 T cells were isolated from wild-type mice. The expression of AHNAK1 in these cells was compared by western blot analysis using anti-AHNAK1-C2 antibody. AHNAK1−/− CD4 T cell extract and β-actin were used as controls for the specificity of the AHNAK1 antibody and loading, respectively. (E) Peritoneal macrophages from wild-type and AHNAK1−/− mice were infected with L. major in vitro and cultured for 72 hours in the either presence or absence of LPS (200 ng/ml) and IFNγ (300 ng/ml). Internalized parasites were detected by staining with DAPI and counted. Results are representative of at least three independent experiments.
AHNAK1 is required for activation and proliferation of T cells
To test AHNAK1−/− CD4 T cells activation in vitro, we stimulated wild-type and AHNAK1−/− CD4 T cells, either with plate-bound anti-CD3 antibody alone or soluble anti-CD3 antibody with irradiated antigen presenting cells, and cell proliferation was assessed by [3H] thymidine incorporation. Upon either of the stimulation methods, AHNAK1−/− CD4 T cells showed impaired proliferation (Fig. 3A). Cell division of AHNAK1−/− CD4 T cells was also analyzed using the CFSE assay. Again AHNAK1−/− CD4 T cells showed poor proliferation (Fig. 3C upper panels). This proliferation defect was not due to increased activation induced cell death since wild-type and AHNAK1−/− CD4 T cells showed a similar rate of cell death assessed by Annexin-V and PI staining after stimulation with anti-CD3 and anti-CD28 antibodies (sFig. 3). Since T cells use IL-2 during their proliferation, we assessed the production of IL-2 from AHNAK1−/− CD4 T cells by ELISA upon TCR stimulation. IL-2 secretion was significantly impaired in AHNAK1−/− cells compared to wild-type cells, (Fig. 3B). We hypothesized that if deficiency of IL-2 production is the major cause for the poor proliferation of AHNAK1−/− cells, then we could rescue it by supplementing their culture media with IL-2. Indeed, upon addition of exogenous IL-2, AHNAK1−/− CD4 T cells proliferated very similarly to wild-type CD4 T cells in both the CFSE assay (Fig. 3C lower panel) and the [3H] thymidine incorporation assay (Fig. 3D), suggesting that the failure of IL-2 production in AHNAK1−/− cells is the major mechanism underlying their poor proliferation.
Figure 3.

AHNAK1 is required for the proliferation of T cells. (A) Decreased proliferation of AHNAK1−/− CD4 T cells. CD4 T cells from wild-type and AHNAK1−/− mice were purified and stimulated in vitro using plate bound anti-CD3 (10 μg/ml), or soluble anti-CD3 (10 μg/ml) and irradiated wild-type splenocytes for indicated periods. [3H] thymidine was added to the culture during the last 8 hours of each time point followed by measurement of the incorporation. Results are representative of at least three independent experiments. (B) Production of IL-2 from wild-type and AHNAK1−/− CD4 T cells was assessed by ELISA after stimulation with plate bound anti-CD3 antibody (10 μg/ml) for indicated periods. Results are representative of at least three independent experiments. (C) Proliferation of wild-type and AHNAK1−/− CD4 T cells was assessed by CFSE assay after stimulation with plate bound anti-CD3 antibody (2 μg/ml) with or without addition of exogenous IL-2 into the culture. Results are representative of two independent experiments. (D) [3H] thymidine incorporation assay was performed as A with or without addition of exogenous IL-2. Results are representative of at least three independent experiments..
To investigate if the cause for the impaired TCR response in the absence of AHNAK1 is due to low expression of TCR in AHNAK1−/− T cells, we analyzed the surface expression of TCR and CD28 by flow cytometric analysis. TCRβ and CD28 were expressed normally in AHNAK1−/− CD4 T cells (sFig. 4A and B).
AHNAK1 is required for calcium influx in CD4 T cells following TCR stimulation
Since calcium influx is required for the activation and proliferation of T cells and since AHNAK1 was previously suggested to play a role in calcium signalling, we stimulated CD4 T cells with anti-CD3 antibody and measured the total intracellular calcium concentration by a ratiometric method using the calcium -sensitive dye, Fura-2 as a probe. TCR cross-linking of wild-type T cells produced a typical biphasic calcium response with an initial rapid increase in calcium concentrations, followed by a slower sustained elevation (Fig. 4A). In contrast, in AHNAK1−/− CD4 T cells, the calcium response to cross-linking was markedly reduced (Fig. 4A). Both the initial peak and the plateau were reduced significantly, with the latter being almost completely ablated.
Figure 4.

AHNAK1 is required for calcium signalling and NFAT activation upon TCR stimulation. (A) CD4 T cells from wild-type and AHNAK1−/− mice were purified and stimulated in vitro using plate bound anti-CD3 (10 μg/ml), anti-CD28 (2 μg/ml) and exogenous IL-2 for 48 hrs. Cells were then washed and incubated with anti-CD3 (10 μg/ml) for 30 min on ice and were subsequently cross-linked by goat anti-hamster Ig antibody (GAH). Calcium concentration was measured by ratiometric method using Fura-2 as a probe. Results are representative of at least three independent experiments. (B) CD4 T cells were stimulated with anti-CD3 (10 μg/ml) and anti-CD28 (2 μg/ml) antibodies for the indicated periods. Nuclear localization of NFATc1 and NFATc2 was examined by western blot analysis using cytoplasmic or nuclear extracts. β-actin was used as internal control. Results are representative of two independent experiments, each with 10 wild-type or AHNAK1−/− mice. (C) DNA binding of NFAT-c2 was examined using nuclear extracts from wild-type and AHNAK−/− purified CD4 T cells. (D) [3H] thymidine incorporation assay was performed after stimulation of CD4 cells with plate bound anti-CD3 antibody (2 μg/ml) with or without addition of ionomycin (0.5 μM) into the culture. Results are representative of at least three independent experiments
During TCR activation, increased free intracellular calcium concentration leads to the activation of a serine phosphatase, calcineurin, which dephosphorylates NFAT (nuclear factor of activated T cells) at the NFAT regulatory domain, thereby leading to nuclear translocation of NFAT and transcriptional activation of various target genes including IL-2, allowing T cells to proliferate. Wild-type and AHNAK1−/− CD4 T cells were, therefore, stimulated with plate bound anti-CD3 and anti-CD28 antibodies for the indicated periods (Fig. 4B) followed by nuclear and cytoplasmic fractionation and western blot analysis. Consistent with the deficiency in calcium influx, stimulated AHNAK1−/− CD4 T cells showed substantially reduced NFATc1 and NFATc2 nuclear localization (Fig 4B). Conversely, NFATc1 and NFATc2 retention in the cytoplasm was enhanced (Fig. 4B). Similar deficient NFAT-c2 DNA binding was also observed in the absence of AHNAK1 by EMSA (Fig 4C). In addition to NFAT, TCR engagement leads to the activation of other transcription factors, including AP-1 and NF-κB that are required for IL-2 expression and T cell proliferation (Crabtree and Clipstone, 1994; Ruland and Mak, 2003). Gel-shift analysis for AP-1 and NF-κB activation revealed that activation of these proteins in AHNAK1−/− CD4 T cells stimulated with antibodies to CD3 and CD28 were comparable to wild-type cells (data not shown), suggesting that AHNAK1 does not play a significant role in the activation of AP-1 and NF-κB in CD4 T cells.
Thus far, we showed that AHNAK1−/− T cells displayed reduced calcium influx, which ultimately leads to decreased cell proliferation. If the primary deficiency in AHNAK1−/− T cells is a failure to transport calcium then complementation of calcium influx should eliminate the T cell defects in AHNAK1−/− mice. We therefore stimulated wild-type and AHNAK1−/− CD4 T cells with anti-CD3 antibody and ionomycin, which mediates high calcium influx through the plasma membrane and increases intracellular calcium concentration, thereby bypassing the normal calcium entry mechanisms. Indeed, in the presence of ionomycin, AHNAK1−/− CD4 T cells proliferated similarly to wild-type cells, indicating that impaired calcium signalling is a major cause for the poor proliferation of AHNAK1−/− T cells (Fig. 4D).
AHNAK1 is not required for calcium release from intracellular stores
There are two sources for calcium influx into the cytoplasm following TCR engagement. One is calcium release from intracellular stores, i.e. from endoplasmic reticulum (ER) to cytoplasm (Lewis, 2001). This release is caused by PLCγ activation and IP3 production. Calcium also enters the cell through calcium channels on the plasma membrane. To test if the calcium release from intracellular store is impaired in AHNAK1−/− T cells, we stimulated cells in calcium free medium by TCR cross-linking and thapsigargin, which mediates a passive release of calcium from intracellular stores (Lewis, 2001; Mintz and Guillain, 1997). We observed no defect in the calcium response by either TCR stimulation or thapsigargin, indicating that calcium release from ER is normal in AHNAK1−/− CD4 T cells (sFig. 5A). It has been shown that in the presence of arachidonic acid, AHNAK1 binds and activates PLCγ1, which is phosphorylated following TCR cross-linking (Sekiya et al., 1999). We therefore examined the phosphorylation of PLCγ1 in AHNAK1−/− CD4 T cells following stimulation with anti-CD3 antibody and western blot analysis using an antibody against phosphorylated PLCγ1. We found similar PLCγ1 phosphorylation in AHNAK1−/− cells compared to wild-type cells (sFig. 5B). Furthermore, we analyzed production of inositol 1,4,5-triphosphate (IP3), which is generated by activation of PLCγ after TCR engagement. There was normal production of IP3 in AHNAK1−/− cells (sFig. 5C). Normal responses of AHNAK1−/− T cells were obtained following treatment with ionomycin suggesting normal CRAC activity (sFig 5D). These data suggest that the impaired calcium signalling of AHNAK1−/− cells is independent of the PLCγ/IP3 and that the CRAC pathway is functional.
AHNAK1 is required for plasma membrane expression of Cav1 channels in CD4 T cells
It was previously shown that T cells express Cav1 channels, which may contribute to calcium influx (Badou et al., 1997; Kotturi et al., 2003; Kotturi and Jefferies, 2005). We further showed that reduced expression of Cav1.1, observed in Cav β4 deficient T cells, causes severe reduction in calcium entry following TCR cross-linking(Badou et al., 2006). In addition, direct inhibition of Cav1.1 expression by ∼50%, via RNAi, leads to dramatic inhibition in TCR induced calcium influx through Cav1.1 channels by electrophysiology (Badou et al., 2007). Altogether, our findings suggest that Cav1.1 plays a key role in calcium influx following TCR cross-linking.
Since AHNAK1 was shown to bind β subunits of Cav1 in cardiomyocytes, we tested this interaction in T cells. Using a co-immunoprecipitation assay with the only available antibodies against β2-, β3- or all β-subunits (βcom), we found that AHNAK1 associates with the β2-, but not β3-subunit in T cells (Fig. 5A). Since antibodies against Cav β1 and β4 suitable for these experiments are not available, we could not test these possible interactions. The regulatory β subunits of Cav1 channels were shown to be required for the correct expression and function of pore-forming α1 subunit (Badou et al., 2006; Chien et al., 1998; Freise et al., 1999; Gao et al., 1999; Tareilus et al., 1997). Therefore, we tested whether the protein expression of Cav1 α1 subunits is normal in AHNAK1−/− CD4 T cells by western blotting in total cell lysates from T cells after TCR stimulation. Two isoforms of α1 subunits, Cav1.1 and Cav1.2 were inducible after TCR stimulation. The expression of Cav1.1 and Cav1.2 α1 subunits in AHNAK1−/− CD4 T cells was significantly lower than wild-type cells after TCR stimulation (Fig. 5B). We reasoned that deficient proliferation of AHNAK1−/− T cells might have caused their inability to induce the expression of Cav1.1 and 1.2 α1 subunits. To test this we restored AHNAK1−/− T cells proliferation by the addition of IL-2 to their culture media (as described in Figure 3C and D) followed by analysis of Cav1.1 and 1.2 α1 subunit protein expression in total cell lysates, as performed in Figure 4B. The protein expression of Cav1.1 and Cav1.2 α1 subunits in AHNAK1−/− CD4 T cells was clearly lower than wild-type cells after TCR stimulation even in the presence of IL-2 in the culture media (Fig. 5C).
Figure 5.
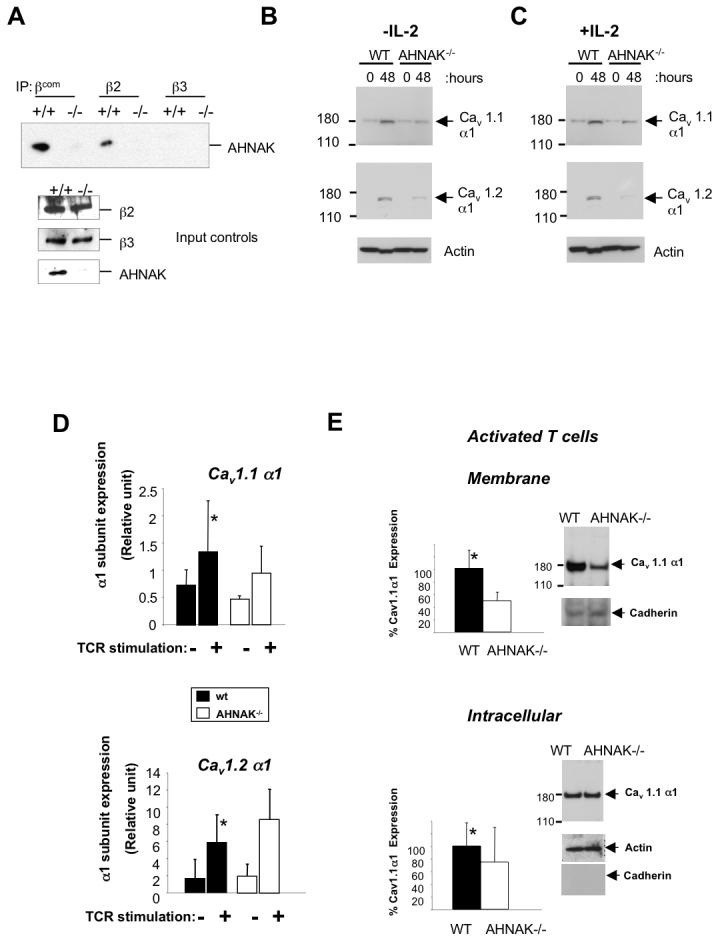
AHNAK1 is required for membrane expression of Cav1 channels. (A) Association of AHNAK1 with the β subunits of Cav1 channels. Lysates were prepared from splenocytes of wild-type and AHNAK1−/− mice and immunoprecipitated with antibodies against β subunit 2, 3 or all βsubunits (βcom). The membrane was blotted with anti-AHNAK1-C2 antibody. Results are representative of two independent experiments. (B) CD4 T cells were stimulated with anti-CD3 (10 μg/ml) and anti-CD28 (2 μg/ml) antibodies and total cell lysates were prepared. The expression of Cav1 channels was examined by western blotting with anti-Cav1.1 and Cav1.2 antibodies. The same membrane was blotted with anti-β-actin antibody for loading control. Results are representative of at least three independent experiments. (C) This experiment was performed as in B with the only difference that IL-2 was added to the culture media. Results are representative of at least three independent experiments. (D) CD4 T Cells were stimulated as in C and Cav1.1 and 1.2 α1 subunits expression was examined by real time PCR. Results are representative of at least three independent experiments. p-value represent the difference in expression between wild-type and AHNAK1−/−(p=0.235 and p=0.366 for Cav1.1 and Cav1.2, respectively). (E) Cells were stimulated as in C followed by fractionation of membrane proteins and western blot analysis as described in B. Densitometry represents statistical analysis of three independent experiments (p=0.02 and p=0.25 for membrane and intracellular expression of Cav1.1 respectively). Cav1.1 membrane protein expression was normalized to pan-cadherin and intracellular expression was normalized to β-actin. A representative western blot used for densitometry is shown.
To test whether Cav1 α1 subunit transcription is regulated by AHNAK1 following TCR stimulation, we performed real time PCR to examine the induction of their mRNA expression in stimulated wild-type and AHNAK1−/− T cells incubated with IL-2. We found that, compared to wild-type T cells, AHNAK1−/− T cells showed normal induction of Cav1.1 and 1.2 α1 mRNA levels (Fig 5D), suggesting that AHNAK1 is not needed for the upregulation of channel transcription but rather involved in post-transcriptional events. To study if AHNAK1 is involved in Cav1 α1 channel localization, we examined Cav1.1 α1 protein expression in the membrane compartment of naïve or stimulated wild-type and AHNAK1−/− T cells. To control the quality and loading of the membrane fraction we used pan-cadherin as a membrane marker. β-actin was used to control for loading of the intracellular fraction. Membranes and intracellular fractions were examined by western blot analysis for Cav1.1 α1 subunit expression. We observed a 50% reduction in Cav1.1 α1 membrane protein expression in AHNAK1−/− T cells stimulated through TCR in the presence of IL-2, while no change in this channel protein was observed in the intracellular compartment (Fig 5E). Similarly an 80% reduction in Cav1.1 membrane expression was observed in AHNAK1−/− naïve T cells (sFig 6). These results corroborate our previous findings discussed above that showed by electrophysiology that a reduction in Cav1.1 expression in T cells by ∼50%, is sufficient to diminish calcium entry following TCR cross-linking (Badou et al., 2007). Finally, normal intracellular expression of Cav1 channels in AHNAK1−/− T cells, suggest that AHNAK1 is not involved in any translational events but is rather required for intact membrane expression of the channel complex possibly through its interactions with the β subunits.
Discussion
Calcium is a ubiquitous second messenger used to regulate a wide range of cellular processes as diverse as muscle contraction, exocytosis, energy metabolism, chemotaxis and synaptic plasticity during learning and memory and more (Clapham, 1995). In T cells, calcium signals control a variety of responses, thus the identification of molecules and channels that modulate their calcium entry is imperative. In this study we show, both in vivo and in vitro, the importance of AHNAK1, a novel critical player in T cell calcium signalling.
Cav1 channel function in T cells
The functional presence of the Cav1 channels in T lymphocytes has been already suggested (Badou et al., 1997; Kotturi et al., 2003; Kotturi and Jefferies, 2005; Savignac et al., 2001; Savignac et al., 2004; Stokes et al., 2004). These studies and the self evident fact that Cav1 channels, in general, already have been shown to transmit a calcium current in other tissues, such as, heart or muscle cells, in itself implies that Cav1 channels, which are expressed by T cells most likely function as calcium channels. Our lab has demonstrated recently that abrogation of either Cav1 β3 or β4 subunits resulted in severe calcium influx deficiency following TCR cross-linking and subsequent impaired T cell activation (Badou et al., 2006). We therefore sought to determine how Cav1 channels are activated in non-excitable cells such as T cells and how they are regulated. A recent study suggested that the Cav1.4 α1 subunit is expressed by T cells without a voltage sensor (Kotturi and Jefferies, 2005), which suggests that non-excitable cells adopted an altered mode of Cav1 activation. To show this, our lab performed electrophysiological studies to characterize the Cav1.1 current in T cells. We found that TCR cross-linking is likely to control the pore opening rather than voltage (Badou et al., 2007). It therefore seems that the regulation of Cav1 pore opening in T cells has evolutionarily adapted to fit the functional requirements of these cells, a process which quite possibly occurred in other non excitable cell types.
In lymphocytes, calcium entry through plasma membrane channels, like CRAC channels, is the main mechanism responsible for the increase in intracellular calcium concentrations, which is necessary for their activation and cytokine production (Feske, 2007). In the absence of functional Cav1 channels either in AHNAK1−/−, β3 or β4 deficient mice, there is a decrease in calcium entry even though the CRAC channel pathway is intact (Badou et al., 2006). Therefore multiple channels are probably involved in calcium entry to T cells. It is possible that these channels function sequentially or independently, and further studies are required to resolve this issue.
Molecular mechanisms used by AHNAK1 to regulate calcium responses
AHNAK1 is most likely required for Cav1.1 membrane expression through its interaction with the regulatory β2 subunit following TCR activation (Haase et al., 2005; Haase et al., 2004; Haase et al., 1999) (Fig. 5A). Further studies will be required to examine if other β subunits, like β1 and β4, also interact with AHNAK1. Previous studies showed that the interaction between β2 subunits and AHNAK1 occurs through AHNAK1 C-terminus (Hohaus et al., 2002). Moreover, the N-terminal domain of both AHNAK1 proteins has a predicted PDZ domain (Komuro et al., 2004) the function of which is still unknown. PDZ domains are believed to interact with C-terminal peptides of a number of channel proteins, including those involved in calcium transport (Kim and Sheng, 2004).
A recent study has suggested that AHNAK1 may regulate Cav1.2 activity in cardiomyocytes (Haase, 2007). One possibility is that AHNAK1 may physically link PKC to the Cav1 channel, thereby regulating the phosphorylation of the latter (Hashimoto et al., 1995; Lee et al., 2004). Importantly, AHNAK1−/− T cells showed normal calcium release from intracellular stores (sFig 4B and C), suggesting that the deficiency in calcium influx observed in AHNAK1−/− T cells is a down-stream event to calcium release from intracellular stores. Interestingly, AHNAK1 was observed in multiple cellular compartments dependent on the cell type or culture conditions (Borgonovo et al., 2002; Gentil et al., 2003; Hashimoto et al., 1993; Hashimoto et al., 1995; Kingsley et al., 2001; Masunaga et al., 1995; Nie et al., 2000; Stiff et al., 2004; Sussman et al., 2001). Remarkably, however, elevated extracellular calcium concentrations caused AHNAK1 to localize to the membrane (Borgonovo et al., 2002; Hashimoto et al., 1995). Finally, a recent paper has described a human genetic mutation in AHNAK1 leading to cardiac heart dysfunction, showing a critical role of this protein in calcium signalling through Cav1 channels (Haase et al., 2005).
Conclusion
Collectively, our data make a compelling case for the novel function of the scaffold protein AHNAK1 during T cell calcium signaling following TCR stimulation. We reach this conclusion on the basis of the expression characteristics of AHNAK1 in T cells, loss-of-function experiments and physical interaction with Cav1 channels in T cells that identify AHNAK1 as a critical component for calcium signaling in T cells mediated by Cav1 channels.
Experimental Procedures
Reagents and Antibodies
Anti-β-actin (sc-1616, Santa Cruz Biotechnology), anti-CD3 (145-2C11), anti-CD28 (37.1), anti-CD44 Cychrome, anti-CD62L FITC, anti-TCR□ (H57) PE, anti-CD4 FITC, anti-CD8 Cychrome, anti-CD4 APC (all Pharmingen), anti-Phospho-PLC-γ1 (Cell signaling #2821), anti-PLC-γ1 (cell signaling #2822), anti-NFATc2 (sc-7296 Santa Cruz), anti-NFATc1 (Affinity Bioreagents MA3-024), anti-Cav1.1 (Santa Cruz), anti-Cav1.2 (Alomone), pan-Cadherin (abcam #ab6528), anti-AHNAK1-C2 and anti-β subunit antibodies (kind gifts from Hasse-H Max Delbrück Center for Molecular Medicine, 13092 Berlin, Germany), Thapsigargin (Molecular Probes, Eugene, OR).
Mice
Mice were previously described (Komuro et al., 2004). Wild-type littermates were used as control.
Nuclear, Whole-Cell Extracts and protein fractionation
Nuclear extracts were made by lysis in hypotonic lysis buffer (10 mM Hepes, pH 7.9, 10 mM KCl, 0.1 mM EDTA, complete protease inhibitors [Roche]). After 10 min incubation on ice, 1/10th volume 1% NP40 solution was added followed by centrifugation (save cytoplasmic fraction), a wash in hypotonic buffer, and lysis in nuclear extract buffer (20 mM Hepes, pH 7.9, 420 mM NaCl, 1 mM EDTA, protease inhibitors) on ice for 30 min. Whole-cell extracts was made using buffer from Cell Signaling (#9803) supplemented with protease inhibitors. Membrane fractions were obtained by using Plasma membrane protein extraction kit from Biovision (#K268-50).
Real-time PCR analysis
Quantitative reverse transcriptase (RT)–PCR was performed using 7500 real-time PCR system (Applied Biosystems) according to the manufacturer's instructions. The primers and probe for the amplification of Cav1.1 α1 subunit cDNA (Cacna1S) was Mm00489257_m1 (Applied Biosystems). The primers for the amplification of Cav1.2 α1 subunit cDNA are Forward: 5'-TCCTTAAGATGACTGCTTACGGG-3'; Backward: 5'-GACTGGATGCCAAAGGAGATG-3'; Probe: 5'-6-FAM d(AATATCCTGGACCTGCTGGTGGTTAGC) BHQ-1-3'. Results from α1 subunit transcripts were normalized to Hprt1 abundance.
Electromobility shift assay (EMSA)
Nuclear extraction (P/N 12494) and EMSA kits (P/N 13009) as well as NFAT-c2 probes (AY1361P) were purchased from Panomics, Fremont, CA.
Immunoprecipitation and western blotting
Cell lysis, immunoprecipitation and blotting were previously described (Kobayashi et al., 1999) and the membrane was blotted with anti-AHNAK1 antibody.
Analysis of IP3 release
Purified 108 CD4+ T cells were incubated in serum-free Bruff's medium for 1 h at 37°C before stimulation. Cells were then washed twice, resuspended in 1ml of Bruff's containing 25 μg/ml anti-CD3ε antibody (145-2C11), and incubated on ice for 10 min. Cells were then washed and resuspended in 1ml Bruff's medium containing 50μg/ml of goat anti-hamster, and cells were incubated at room temperature for the indicated times. 100μl of stimulated cells were taken at each time point and signalling was terminated by adding 100μl ice-cold 15% Trichloroacetic acid followed by two 10x vol. water saturated Diethyl Ether extraction. IP3 levels were assessed using the D-myo-Inositol 1,4,5-trisphosphate (IP3) [3H] Biotrak Assay System (Amersham code TRK1000). Controls included mock-stimulated (no primary antibody) cells.
In Vitro T Cell Activation/Differentiation Experiments
Splenic CD4 T cells were isolated from 6-8 weeks-old mice by MACS sorting using anti-CD4 coupled beads and columns (Miltenyi Biotec). Cells were cultured in Bruff's medium (10% FCS, penicillin, streptomycin and L-glutamine). T cells were stimulated by either of the following two methods:
Plates were coated O.N. in 4°C with anti-CD3 and anti-CD28 (10 μg/ml and 2 μg/ml, respectively) in PBS.
Total splenocytes were used as APCs after irradiation (3000 Gray) and 10 μg/ml of anti-CD3 was added.
40 U/ml of IL-2 were added exogenously when needed.
ELISA and proliferation assay
Purified CD4 T cells were stimulated as triplicates using plate-bound anti-CD3 (10 μg/ml) and anti-CD28 (2 μg/ml) antibodies. IL-2, IL-4 and IFNγ production was measured by ELISA with antibodies against IL-2, IL-4 and IFNγ (Pharmingen), in triplicates, 24 or 48 hours after stimulation. Proliferation was assayed at indicated time points by adding [3H] thymidine to the culture for the last 8 hours.
Analysis of intracellular calcium concentration
Calcium concentration was measured using Fura2/AM (Molecular Probes) as calcium probe. Cells were loaded with 5 μM fura2/AM for 30 min at 37°C. Fura2/AM loaded T cells were stimulated with anti-CD3 and anti-hamster IgG (GAH) in a cross-linking system. Fluorescence was monitored in ratio mode using a fluorometer (Polarstar Galaxy, BMG lab-technologies, Offenburg, Germany). Collected data were analyzed using Fluostar Galaxy Software (BMG technologies). At the end of each experiment, cells were treated with 5 μM ionomycin in calcium containing medium then with 5 mM of EGTA. Experimental 340/380 ratio were converted to calcium concentration according to the equation described previously (Grynkiewicz et al., 1985).
5-(and-6)-carboxyfluorescein diacetate succinimidyl ester (CFSE) labeling
CFSE (Molecular probes, Eugene, OR) was added to purified CD4 T cells to a final concentration of 3 μM and cells were incubated for 25 min in 37°C. At the end of the incubation period, the cells were immediately washed three times in PBS containing 10% FCS. Cells were then stimulated for the indicated period and CFSE staining was measured by flow cytometry.
Leishmania major culture and infection
L. major (WR309; MHOM/IS/79/LRCL251) promastigotes were grown at 23°C in complete Schneider's Drosophila medium supplemented with 20% HIFBS and 10 μg/ml gentamicin. Mice (10/group) were infected with 2 × 10⁶ late-log/stationary phase promastigotes in the cutaneous tissue on the top of the right rear hind foot. The course of infection was monitored by measuring the increase in footpad thickness, compared with the uninfected foot (ratio: infected/non-infected foot), with a dial gauge caliper. At the times designated, mice (3-4/group/time point) were sacrificed to estimate the parasite burden in the infected tissue using limiting dilution analyses and procedures reported previously (Soong et al., 1995; Titus et al., 1985).
Macrophage mediated Leishmania major killing
Thioglycolate elicited peritoneal exudate cells were isolated from either AHNAK1 or wild-type mice. Cells (1-3×10⁵) were plated on 13 mm glass coverslips in 24 well plates and incubated overnight at 37°C in 5% CO2 overnight in RPMI 1640 medium containing 10% HIFBS and 10 mg/ml gentamicin. Non-adherent cells were removed by washing with medium and were infected with late log promastigotes of L. major (ratio: 3-5:1:parasite:macrophage). After 24 hours, cultures were washed to remove non-internalized leishmanial parasites. Cells were continuously cultured (throughout infection -72 hours) in the either presence or absence of LPS (200 ng/ml) and murine rIFNγ (300 ng/ml). After 72 hours, coverslips were washed and immediately fixed with 2% paraformaldehyde. Internalized parasites were detected by staining with DAPI (Sigma; 4′,6-diamidino-2-phenylindole) and using a Leitz fluorescence microscope, model Orthoplan 2 (Wetzlar, Germany). Results are expressed as percent of infected macrophages per minimum of 200 phagocytic cells. All determinations were performed in duplicate.
Supplementary Material
Acknowledgments
The authors thank C. L. Stewart for providing reagents, L. Evangelisti, M. Chen, A. Ferrandino for technical assistance, F. Manzo for manuscript preparation, and R. Babai and K. G. Klemic for critical reading of this manuscript. R.A.F. is an Investigator of the Howard Hughes Medical Institute. D.M. was supported by the Cancer Research Institute postdoctoral fellowship. K.S.K is a recipient of grants from the Eli and Edythe L. Broad Foundation and the Arthritis National Research Foundation. A.B. was a recipient of grants from Arthritis National Research Foundation. DMc-P and KG-P were supported through a grant from the NIH (AI27811).
Footnotes
Publisher's Disclaimer: This is a PDF file of an unedited manuscript that has been accepted for publication. As a service to our customers we are providing this early version of the manuscript. The manuscript will undergo copyediting, typesetting, and review of the resulting proof before it is published in its final citable form. Please note that during the production process errors may be discovered which could affect the content, and all legal disclaimers that apply to the journal pertain.
REFERENCES
- Badou A, Jha MK, Matza D, Mehal WZ, Freichel M, Flockerzi V, Flavell RA. Critical role for the beta regulatory subunits of Cav channels in T lymphocyte function. Proc Natl Acad Sci U S A. 2006;103:15529–15534. doi: 10.1073/pnas.0607262103. [DOI] [PMC free article] [PubMed] [Google Scholar]
- Badou A, Matza D, Klemic KG, Govindaragulu U, Kaczmarek LK, Flavell RA. Requirement for Cav1.1 during TCR mediated calcium influx in T cells. 2007 manuscript submitted; enclosed for reviewers. [Google Scholar]
- Badou A, Savignac M, Moreau M, Leclerc C, Foucras G, Cassar G, Paulet P, Lagrange D, Druet P, Guery JC, Pelletier L. Weak TCR stimulation induces a calcium signal that triggers IL-4 synthesis, stronger TCR stimulation induces MAP kinases that control IFN-gamma production. Eur J Immunol. 2001;31:2487–2496. doi: 10.1002/1521-4141(200108)31:8<2487::aid-immu2487>3.0.co;2-l. [DOI] [PubMed] [Google Scholar]
- Badou A, Savignac M, Moreau M, Leclerc C, Pasquier R, Druet P, Pelletier L. HgCl2-induced interleukin-4 gene expression in T cells involves a protein kinase C-dependent calcium influx through L-type calcium channels. J Biol Chem. 1997;272:32411–32418. doi: 10.1074/jbc.272.51.32411. [DOI] [PubMed] [Google Scholar]
- Benaud C, Gentil BJ, Assard N, Court M, Garin J, Delphin C, Baudier J. AHNAK interaction with the annexin 2/S100A10 complex regulates cell membrane cytoarchitecture. J Cell Biol. 2004;164:133–144. doi: 10.1083/jcb.200307098. [DOI] [PMC free article] [PubMed] [Google Scholar]
- Berridge MJ. Cell signalling. A tale of two messengers. Nature. 1993;365:388–389. doi: 10.1038/365388a0. [DOI] [PubMed] [Google Scholar]
- Blaikie P, Immanuel D, Wu J, Li N, Yajnik V, Margolis B. A region in Shc distinct from the SH2 domain can bind tyrosine-phosphorylated growth factor receptors. J Biol Chem. 1994;269:32031–32034. [PubMed] [Google Scholar]
- Borgonovo B, Cocucci E, Racchetti G, Podini P, Bachi A, Meldolesi J. Regulated exocytosis: a novel, widely expressed system. Nat Cell Biol. 2002;4:955–962. doi: 10.1038/ncb888. [DOI] [PubMed] [Google Scholar]
- Cantrell D. T cell antigen receptor signal transduction pathways. Annu Rev Immunol. 1996;14:259–274. doi: 10.1146/annurev.immunol.14.1.259. [DOI] [PubMed] [Google Scholar]
- Catterall WA. Structure and regulation of voltage-gated Ca2+ channels. Annu Rev Cell Dev Biol. 2000;16:521–555. doi: 10.1146/annurev.cellbio.16.1.521. [DOI] [PubMed] [Google Scholar]
- Chevesich J, Kreuz AJ, Montell C. Requirement for the PDZ domain protein, INAD, for localization of the TRP store-operated channel to a signaling complex. Neuron. 1997;18:95–105. doi: 10.1016/s0896-6273(01)80049-0. [DOI] [PubMed] [Google Scholar]
- Chien AJ, Gao T, Perez-Reyes E, Hosey MM. Membrane targeting of L-type calcium channels. Role of palmitoylation in the subcellular localization of the beta2a subunit. J Biol Chem. 1998;273:23590–23597. doi: 10.1074/jbc.273.36.23590. [DOI] [PubMed] [Google Scholar]
- Clapham DE. Calcium signaling. Cell. 1995;80:259–268. doi: 10.1016/0092-8674(95)90408-5. [DOI] [PubMed] [Google Scholar]
- Crabtree GR, Clipstone NA. Signal transmission between the plasma membrane and nucleus of T lymphocytes. Annu Rev Biochem. 1994;63:1045–1083. doi: 10.1146/annurev.bi.63.070194.005145. [DOI] [PubMed] [Google Scholar]
- Dong H, O'Brien RJ, Fung ET, Lanahan AA, Worley PF, Huganir RL. GRIP: a synaptic PDZ domain-containing protein that interacts with AMPA receptors. Nature. 1997;386:279–284. doi: 10.1038/386279a0. [DOI] [PubMed] [Google Scholar]
- Doyle DA, Lee A, Lewis J, Kim E, Sheng M, MacKinnon R. Crystal structures of a complexed and peptide-free membrane protein-binding domain: molecular basis of peptide recognition by PDZ. Cell. 1996;85:1067–1076. doi: 10.1016/s0092-8674(00)81307-0. [DOI] [PubMed] [Google Scholar]
- Dustin ML, Cooper JA. The immunological synapse and the actin cytoskeleton: molecular hardware for T cell signaling. Nat Immunol. 2000;1:23–29. doi: 10.1038/76877. [DOI] [PubMed] [Google Scholar]
- Feske S. Calcium signalling in lymphocyte activation and disease. Nat Rev Immunol. 2007;7:690–702. doi: 10.1038/nri2152. [DOI] [PubMed] [Google Scholar]
- Freise D, Himmerkus N, Schroth G, Trost C, Weissgerber P, Freichel M, Flockerzi V. Mutations of calcium channel beta subunit genes in mice. Biol Chem. 1999;380:897–902. doi: 10.1515/BC.1999.110. [DOI] [PubMed] [Google Scholar]
- Gao T, Chien AJ, Hosey MM. Complexes of the alpha1C and beta subunits generate the necessary signal for membrane targeting of class C L-type calcium channels. J Biol Chem. 1999;274:2137–2144. doi: 10.1074/jbc.274.4.2137. [DOI] [PubMed] [Google Scholar]
- Gentil BJ, Delphin C, Benaud C, Baudier J. Expression of the giant protein AHNAK (desmoyokin) in muscle and lining epithelial cells. J Histochem Cytochem. 2003;51:339–348. doi: 10.1177/002215540305100309. [DOI] [PubMed] [Google Scholar]
- Gentil BJ, Delphin C, Mbele GO, Deloulme JC, Ferro M, Garin J, Baudier J. The giant protein AHNAK is a specific target for the calcium- and zinc- binding S100B protein: potential implications for Ca2+ homeostasis regulation by S100B. J Biol Chem. 2001;276:23253–23261. doi: 10.1074/jbc.M010655200. [DOI] [PubMed] [Google Scholar]
- Grynkiewicz G, Poenie M, Tsien RY. A new generation of Ca2+ indicators with greatly improved fluorescence properties. J Biol Chem. 1985;260:3440–3450. [PubMed] [Google Scholar]
- Gustafson TA, He W, Craparo A, Schaub CD, O'Neill TJ. Phosphotyrosine-dependent interaction of SHC and insulin receptor substrate 1 with the NPEY motif of the insulin receptor via a novel non-SH2 domain. Mol Cell Biol. 1995;15:2500–2508. doi: 10.1128/mcb.15.5.2500. [DOI] [PMC free article] [PubMed] [Google Scholar]
- Haase H. Ahnak, a new player in beta-adrenergic regulation of the cardiac L-type Ca2+ channel. Cardiovasc Res. 2007;73:19–25. doi: 10.1016/j.cardiores.2006.09.001. [DOI] [PubMed] [Google Scholar]
- Haase H, Alvarez J, Petzhold D, Doller A, Behlke J, Erdmann J, Hetzer R, Regitz-Zagrosek V, Vassort G, Morano I. Ahnak is critical for cardiac Ca(V)1.2 calcium channel function and its beta-adrenergic regulation. Faseb J. 2005;19:1969–1977. doi: 10.1096/fj.05-3997com. [DOI] [PubMed] [Google Scholar]
- Haase H, Pagel I, Khalina Y, Zacharzowsky U, Person V, Lutsch G, Petzhold D, Kott M, Schaper J, Morano I. The carboxyl-terminal ahnak domain induces actin bundling and stabilizes muscle contraction. Faseb J. 2004;18:839–841. doi: 10.1096/fj.03-0446fje. [DOI] [PubMed] [Google Scholar]
- Haase H, Podzuweit T, Lutsch G, Hohaus A, Kostka S, Lindschau C, Kott M, Kraft R, Morano I. Signaling from beta-adrenoceptor to L-type calcium channel: identification of a novel cardiac protein kinase A target possessing similarities to AHNAK. Faseb J. 1999;13:2161–2172. doi: 10.1096/fasebj.13.15.2161. [DOI] [PubMed] [Google Scholar]
- Hashimoto T, Amagai M, Parry DA, Dixon TW, Tsukita S, Miki K, Sakai K, Inokuchi Y, Kudoh J, et al. Desmoyokin, a 680 kDa keratinocyte plasma membrane-associated protein, is homologous to the protein encoded by human gene AHNAK. J Cell Sci. 1993;105:275–286. doi: 10.1242/jcs.105.2.275. [DOI] [PubMed] [Google Scholar]
- Hashimoto T, Gamou S, Shimizu N, Kitajima Y, Nishikawa T. Regulation of translocation of the desmoyokin/AHNAK protein to the plasma membrane in keratinocytes by protein kinase C. Exp Cell Res. 1995;217:258–266. doi: 10.1006/excr.1995.1085. [DOI] [PubMed] [Google Scholar]
- Hohaus A, Person V, Behlke J, Schaper J, Morano I, Haase H. The carboxyl-terminal region of ahnak provides a link between cardiac L- type Ca2+ channels and the actin-based cytoskeleton. Faseb J. 2002;16:1205–1216. doi: 10.1096/fj.01-0855com. [DOI] [PubMed] [Google Scholar]
- Hoth M, Penner R. Depletion of intracellular calcium stores activates a calcium current in mast cells. Nature. 1992;355:353–356. doi: 10.1038/355353a0. [DOI] [PubMed] [Google Scholar]
- Jun JE, Goodnow CC. Scaffolding of antigen receptors for immunogenic versus tolerogenic signaling. Nat Immunol. 2003;4:1057–1064. doi: 10.1038/ni1001. [DOI] [PubMed] [Google Scholar]
- Kane MM, Mosser DM. Leishmania parasites and their ploys to disrupt macrophage activation. Curr Opin Hematol. 2000;7:26–31. doi: 10.1097/00062752-200001000-00006. [DOI] [PubMed] [Google Scholar]
- Kavanaugh WM, Williams LT. An alternative to SH2 domains for binding tyrosine-phosphorylated proteins. Science. 1994;266:1862–1865. doi: 10.1126/science.7527937. [DOI] [PubMed] [Google Scholar]
- Kim E, Sheng M. PDZ domain proteins of synapses. Nat Rev Neurosci. 2004;5:771–781. doi: 10.1038/nrn1517. [DOI] [PubMed] [Google Scholar]
- Kingsley PD, McGrath KE, Maltby KM, Koniski AD, Ramchandran R, Palis J. Subtractive hybridization reveals tissue-specific expression of ahnak during embryonic development. Dev Growth Differ. 2001;43:133–143. doi: 10.1046/j.1440-169x.2001.00557.x. [DOI] [PubMed] [Google Scholar]
- Kobayashi K, Hatano M, Otaki M, Ogasawara T, Tokuhisa T. Expression of a murine homologue of the inhibitor of apoptosis protein is related to cell proliferation. Proc Natl Acad Sci U S A. 1999;96:1457–1462. doi: 10.1073/pnas.96.4.1457. [DOI] [PMC free article] [PubMed] [Google Scholar]
- Komuro A, Masuda Y, Kobayashi K, Babbitt R, Gunel M, Flavell RA, Marchesi VT. The AHNAKs are a class of giant propeller-like proteins that associate with calcium channel proteins of cardiomyocytes and other cells. Proc Natl Acad Sci U S A. 2004;101:4053–4058. doi: 10.1073/pnas.0308619101. [DOI] [PMC free article] [PubMed] [Google Scholar]
- Kornau HC, Schenker LT, Kennedy MB, Seeburg PH. Domain interaction between NMDA receptor subunits and the postsynaptic density protein PSD-95. Science. 1995;269:1737–1740. doi: 10.1126/science.7569905. [DOI] [PubMed] [Google Scholar]
- Kotturi MF, Carlow DA, Lee JC, Ziltener HJ, Jefferies WA. Identification and functional characterization of voltage-dependent calcium channels in T lymphocytes. J Biol Chem. 2003;278:46949–46960. doi: 10.1074/jbc.M309268200. [DOI] [PubMed] [Google Scholar]
- Kotturi MF, Jefferies WA. Molecular characterization of L-type calcium channel splice variants expressed in human T lymphocytes. Mol Immunol. 2005;42:1461–1474. doi: 10.1016/j.molimm.2005.01.014. [DOI] [PubMed] [Google Scholar]
- Kudoh J, Wang Y, Minoshima S, Hashimoto T, Amagai M, Nishikawa T, Shtivelman E, Bishop JM, Shimizu N. Localization of the human AHNAK/desmoyokin gene (AHNAK) to chromosome band 11q12 by somatic cell hybrid analysis and fluorescence in situ hybridization. Cytogenet Cell Genet. 1995;70:218–220. doi: 10.1159/000134037. [DOI] [PubMed] [Google Scholar]
- Lee IH, You JO, Ha KS, Bae DS, Suh PG, Rhee SG, Bae YS. AHNAK-mediated activation of phospholipase C-gamma1 through protein kinase C. J Biol Chem. 2004;279:26645–26653. doi: 10.1074/jbc.M311525200. [DOI] [PubMed] [Google Scholar]
- Lewis RS. Calcium signaling mechanisms in T lymphocytes. Annu Rev Immunol. 2001;19:497–521. doi: 10.1146/annurev.immunol.19.1.497. [DOI] [PubMed] [Google Scholar]
- Lewis RS. The molecular choreography of a store-operated calcium channel. Nature. 2007;446:284–287. doi: 10.1038/nature05637. [DOI] [PubMed] [Google Scholar]
- Ludford-Menting MJ, Oliaro J, Sacirbegovic F, Cheah ET, Pedersen N, Thomas SJ, Pasam A, Iazzolino R, Dow LE, Waterhouse NJ, et al. A network of PDZ-containing proteins regulates T cell polarity and morphology during migration and immunological synapse formation. Immunity. 2005;22:737–748. doi: 10.1016/j.immuni.2005.04.009. [DOI] [PubMed] [Google Scholar]
- Masunaga T, Shimizu H, Ishiko A, Fujiwara T, Hashimoto T, Nishikawa T. Desmoyokin/AHNAK protein localizes to the non-desmosomal keratinocyte cell surface of human epidermis. J Invest Dermatol. 1995;104:941–945. doi: 10.1111/1523-1747.ep12606213. [DOI] [PubMed] [Google Scholar]
- Mintz E, Guillain F. Ca2+ transport by the sarcoplasmic reticulum ATPase. Biochim Biophys Acta. 1997;1318:52–70. doi: 10.1016/s0005-2728(96)00132-6. [DOI] [PubMed] [Google Scholar]
- Monks CR, Freiberg BA, Kupfer H, Sciaky N, Kupfer A. Three-dimensional segregation of supramolecular activation clusters in T cells. Nature. 1998;395:82–86. doi: 10.1038/25764. [DOI] [PubMed] [Google Scholar]
- Muller BM, Kistner U, Veh RW, Cases-Langhoff C, Becker B, Gundelfinger ED, Garner CC. Molecular characterization and spatial distribution of SAP97, a novel presynaptic protein homologous to SAP90 and the Drosophila discs-large tumor suppressor protein. J Neurosci. 1995;15:2354–2366. doi: 10.1523/JNEUROSCI.15-03-02354.1995. [DOI] [PMC free article] [PubMed] [Google Scholar]
- Nie Z, Ning W, Amagai M, Hashimoto T. C-Terminus of desmoyokin/AHNAK protein is responsible for its translocation between the nucleus and cytoplasm. J Invest Dermatol. 2000;114:1044–1049. doi: 10.1046/j.1523-1747.2000.00949.x. [DOI] [PubMed] [Google Scholar]
- Pawson T, Scott JD. Signaling through scaffold, anchoring, and adaptor proteins. Science. 1997;278:2075–2080. doi: 10.1126/science.278.5346.2075. [DOI] [PubMed] [Google Scholar]
- Ruland J, Mak TW. Transducing signals from antigen receptors to nuclear factor kappaB. Immunol Rev. 2003;193:93–100. doi: 10.1034/j.1600-065x.2003.00049.x. [DOI] [PubMed] [Google Scholar]
- Sacks D, Noben-Trauth N. The immunology of susceptibility and resistance to Leishmania major in mice. Nat Rev Immunol. 2002;2:845–858. doi: 10.1038/nri933. [DOI] [PubMed] [Google Scholar]
- Savignac M, Badou A, Moreau M, Leclerc C, Guery JC, Paulet P, Druet P, Ragab-Thomas J, Pelletier L. Protein kinase C-mediated calcium entry dependent upon dihydropyridine sensitive channels: a T cell receptor-coupled signaling pathway involved in IL-4 synthesis. Faseb J. 2001;15:1577–1579. doi: 10.1096/fj.00-0733fje. [DOI] [PubMed] [Google Scholar]
- Savignac M, Gomes B, Gallard A, Narbonnet S, Moreau M, Leclerc C, Paulet P, Mariame B, Druet P, Saoudi A, et al. Dihydropyridine receptors are selective markers of Th2 cells and can be targeted to prevent Th2-dependent immunopathological disorders. J Immunol. 2004;172:5206–5212. doi: 10.4049/jimmunol.172.9.5206. [DOI] [PubMed] [Google Scholar]
- Sekiya F, Bae YS, Jhon DY, Hwang SC, Rhee SG. AHNAK, a protein that binds and activates phospholipase C-gamma1 in the presence of arachidonic acid. J Biol Chem. 1999;274:13900–13907. doi: 10.1074/jbc.274.20.13900. [DOI] [PubMed] [Google Scholar]
- Shtivelman E, Bishop JM. The human gene AHNAK encodes a large phosphoprotein located primarily in the nucleus. J Cell Biol. 1993;120:625–630. doi: 10.1083/jcb.120.3.625. [DOI] [PMC free article] [PubMed] [Google Scholar]
- Shtivelman E, Cohen FE, Bishop JM. A human gene (AHNAK) encoding an unusually large protein with a 1.2- microns polyionic rod structure. Proc Natl Acad Sci U S A. 1992;89:5472–5476. doi: 10.1073/pnas.89.12.5472. [DOI] [PMC free article] [PubMed] [Google Scholar]
- Simske JS, Kaech SM, Harp SA, Kim SK. LET-23 receptor localization by the cell junction protein LIN-7 during C. elegans vulval induction. Cell. 1996;85:195–204. doi: 10.1016/s0092-8674(00)81096-x. [DOI] [PubMed] [Google Scholar]
- Soong L, Duboise SM, Kima P, McMahon-Pratt D. Leishmania pifanoi amastigote antigens protect mice against cutaneous leishmaniasis. Infect Immun. 1995;63:3559–3566. doi: 10.1128/iai.63.9.3559-3566.1995. [DOI] [PMC free article] [PubMed] [Google Scholar]
- Stiff T, Shtivelman E, Jeggo P, Kysela B. AHNAK interacts with the DNA ligase IV-XRCC4 complex and stimulates DNA ligase IV-mediated double-stranded ligation. DNA Repair (Amst) 2004;3:245–256. doi: 10.1016/j.dnarep.2003.11.001. [DOI] [PubMed] [Google Scholar]
- Stokes L, Gordon J, Grafton G. Non-voltage-gated L-type Ca2+ channels in human T cells: pharmacology and molecular characterization of the major alpha pore-forming and auxiliary beta-subunits. J Biol Chem. 2004;279:19566–19573. doi: 10.1074/jbc.M401481200. [DOI] [PubMed] [Google Scholar]
- Sussman J, Stokoe D, Ossina N, Shtivelman E. Protein kinase B phosphorylates AHNAK and regulates its subcellular localization. J Cell Biol. 2001;154:1019–1030. doi: 10.1083/jcb.200105121. [DOI] [PMC free article] [PubMed] [Google Scholar]
- Tareilus E, Roux M, Qin N, Olcese R, Zhou J, Stefani E, Birnbaumer L. A Xenopus oocyte beta subunit: evidence for a role in the assembly/expression of voltage-gated calcium channels that is separate from its role as a regulatory subunit. Proc Natl Acad Sci U S A. 1997;94:1703–1708. doi: 10.1073/pnas.94.5.1703. [DOI] [PMC free article] [PubMed] [Google Scholar]
- Thome M. CARMA1, BCL-10 and MALT1 in lymphocyte development and activation. Nat Rev Immunol. 2004;4:348–359. doi: 10.1038/nri1352. [DOI] [PubMed] [Google Scholar]
- Titus RG, Marchand M, Boon T, Louis JA. A limiting dilution assay for quantifying Leishmania major in tissues of infected mice. Parasite Immunol. 1985;7:545–555. doi: 10.1111/j.1365-3024.1985.tb00098.x. [DOI] [PubMed] [Google Scholar]
- Xavier R, Rabizadeh S, Ishiguro K, Andre N, Ortiz JB, Wachtel H, Morris DG, Lopez-Ilasaca M, Shaw AC, Swat W, Seed B. Discs large (Dlg1) complexes in lymphocyte activation. J Cell Biol. 2004;166:173–178. doi: 10.1083/jcb.200309044. [DOI] [PMC free article] [PubMed] [Google Scholar]
- Zweifach A, Lewis RS. Mitogen-regulated Ca2+ current of T lymphocytes is activated by depletion of intracellular Ca2+ stores. Proc Natl Acad Sci U S A. 1993;90:6295–6299. doi: 10.1073/pnas.90.13.6295. [DOI] [PMC free article] [PubMed] [Google Scholar]
Associated Data
This section collects any data citations, data availability statements, or supplementary materials included in this article.