Abstract
Calorie restriction extends lifespan by decreasing the rate of tumor formation, an effect occurring within 8 weeks of initiating a restricted diet. Our goal was to define how the first weeks of a calorie restricted diet (60% of ad libitum calories) affects putative mediators of the calorie restriction phenotype, focusing on regulators of fatty acid biosynthesis. In C57Bl/6 mice, insulin decreased over 50% (p<0.05) during the first week of calorie restriction whereas IGF-1 was unaffected. In the liver, PPAR mRNA fell to 13% of baseline after one week of calorie restriction (p<0.05), whereas hepatic SREBP-1c and SIRT1 mRNA levels were unaffected. No changes in abdominal or subcutaneous adipose tissue were observed until after 8 weeks of caloric restriction. We conclude that calorie restriction-induced decreases in insulin and hepatic PPAR are rapid enough to support a role for these molecules in triggering the initial phase of the calorie restriction phenotype.
Key Words and Phrases: Aging, Caloric Restriction
Introduction
In all species studied to date, restricting caloric intake by 20-50% while still providing adequate micronutrients significantly extends mean and maximal lifespan, largely by retarding age-associated diseases most importantly cancer (Weindruch, 1996; Weindruch et al., 1986). Not surprisingly there is intense interest in elucidating the molecular basis for the anti-aging and anti-cancer effects of calorie restriction (Ingram et al., 2006; Wolf, 2006). We have reported that 16 weeks of calorie restriction decreases protein levels in the liver of acetyl CoA carboxylase (ACC), the rate-limiting enzyme in fatty acid biosynthesis, to approximately 25% of baseline (Gonzalez et al., 2004). This observation is significant in that fatty acid biosynthesis appears to be closely linked to the timing and extent of tumor development, most notably in a subset of aggressive malignancies requiring a high rate of lipogenesis for growth (De Schrijver et al., 2003; Kuhajda, 2000; Menendez et al., 2005; Pizer et al., 1998). In fact, specific inhibition of fatty acid synthase (FAS) and lipogenesis have been used successfully to inhibit growth of malignancies (De Schrijver, et al., 2003; Pizer, et al., 1998). Thus calorie restriction-induced downregulation of ACC protein in the liver could be part of a general inhibition of fatty acid biosynthesis contributing to the observed decrease in spontaneous and induced tumor development in calorie restricted animals (Fu et al., 1994; Yoshida et al., 1999). Interestingly, the transcription factors PPARγ and SREBP-1c which regulate ACC and FAS expression have additional effects on processes central to aging such as cell cycling, apoptosis and inflammation (De Schrijver, et al., 2003; Ettinger et al., 2004; Gonzalez, et al., 2004; Kirkland et al., 2002; Picard and Guarente, 2005; Rossi et al., 2003; Semple et al., 2006). Thus any calorie restriction-induced downregulation of PPARγ, SREBP-1c, or other factors that influence fatty acid biosynthesis (i.e. insulin) could have collateral effects contributing to the anti-aging and antitumor phenotype of these animals.
Accordingly, our goal was to define how a calorie restricted diet affects the following regulators of fatty acid biosynthesis gene expression PPARγ, SREBP-1c, SIRT1, and plasma insulin levels. Importantly, the caloric restriction phenotype of retarded aging and tumor development is evident within 8 weeks after initiating calorie restriction, with that half of the eventual changes in hepatic gene expression already detectible at 2 weeks (Dhahbi et al., 2004). Thus the critical molecular events triggering this phenotype must occur within the first several weeks after initiating the restricted diet. Therefore, we focused on defining the early timecourse of caloric restriction’s effects. To accomplish this, blood, liver and adipose tissue (subcutaneous and abdominal) were collected from 6 month old C57Bl/6 mice that had undergone 0, 1, 4 or 16 weeks of calorie restriction (60% of ad libitum calories). We focused on liver because, while the main cause of neoplastic death of aging C57bl/6 mice is lymphoma not liver cancer, CR almost eliminates the incidence of liver tumors in this strain of mice whereas it has little effect on the rate of death due to lymphoma (Blackwell et al., 1995). For comparison to liver, another highly lipogenic tissue, white adipose tissue, was chosen, which itself has been suggested to play a key role in the calorie restriction phenotype (Gonzalez, et al., 2004). Adipose tissue from two distinct anatomical sites was studied so that we could test the hypothesis that abdominal (epididymal) adipose tissue, which is more closely linked to pathology than subcutaneous adipose tissue, is resistant to calorie restriction-induced changes in gene expression (Lafontan and Berlan, 2003).
Methods
Animals
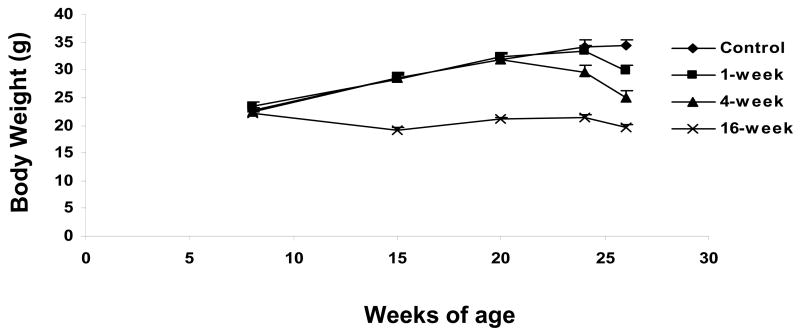
Mice (n=36 C57Bl/6 males) were housed singly in the specific pathogen-free Shared Aging Rodent Facility at the Madison VA Geriatric Research, Education and Clinical Center, and provided a nonpurified diet (PLI 5001 [Purina Labs, St. Louis, MO]) and acidified water ad libitum for three weeks following weaning. From this time until 2 months of age, all 36 mice received 12 kcal/day of a semipurified diet (TD91349 [Teklad, Madison, WI]), which is ~10% less than the average ad libitum intake. The decision to impose a slight restriction on food intake during this period (and throughout life in control mice) was made because it prevents the extreme obesity associated with confined cage life and access to unlimited food. At 2 months of age mice were randomly divided into four experimental groups with 9 mice in each group. Mice designated for the three calorie restriction groups were switched to a food intake of 9 kcal/day (approximately 60% of the chow eaten when given unlimited access to food) either 1, 4 or 16 weeks prior to tissue collection at 6 months of age. Since our goal was to evaluate the effect of CR on changes in gene expression occurring as early as one week on a CR diet, we chose to introduce the CR diet without the gradual acclimatization period that is sometimes used. Mice were sacrificed after a 12-hour fast via cervical dislocation. Immediately after cervical dislocation, the abdomen was opened and the adipose tissue and liver placed in liquid nitrogen. Subcutaneous adipose tissue was harvested bilaterally from the inguinal fat pads and visceral adipose tissue from the epididymal fat pads. Plasma was taken at the time of sacrifice for measurement of glucose, insulin and IGF-1. Body weight data are shown in Figure 1.
Figure 1.
Body weights in the 4 experimental groups. At 8 weeks of age mice were randomized to one of the 4 experimental groups that started calorie restriction at either 10 weeks of age (16-week calorie restriction group), 22 weeks of age (4-week calorie restriction group), or 25 weeks of age (1-week calorie restriction group). N=9 mice/group
Plasma measurements
Glucose was measured in all mice using an Accu-Chek Advantage glucometer (Roche). Plasma insulin and IGF-1 levels were measured in duplicate in 7 or 8 randomly selected mice from each group by the Assay Services Laboratories of the Wisconsin National Primate Research by commercially available RIA kits (Linco EZRMI-13K for insulin, and Diagnostic Systems Laboratories DSL-10-2900 for IGF-1).
Real-time RT PCR
Total RNA was isolated from snap-frozen tissue using the RNA-Bee reagent (Tel-Test, Inc.) and treated with DNase I (New England Biolabs) to remove contaminating DNA. First-strand cDNA synthesis was performed with random hexamer primers using TaqMan Reverse Transcription Reagents (Applied Biosystems). Real-time Pcalorie restriction was performed on the ABI Prism 7700 Sequence Detection System (Applied Biosystems) using SYBR Green Pcalorie restriction Master Mix (Applied Biosystems). Gene-specific primers were designed using Primer Express software (Applied Biosystems) and span intron-exon junctions to avoid amplification of genomic DNA. Specific primer sequences follow:
ACC1 forward 5′-GCCATGTTGAGACGCTGGTC-3′
ACC1 reverse 5′-CTCCTCTATCACAGAGCGGACG-3′
ACC2 forward 5′-CCAGTCTTCCGTGCCTTTGTAC-3′
ACC2 reverse 5′-CTCATCCCTCGCTCTGAACG-3′
FAS forward 5′-GCTGTAGCACACATCCTAGGCA-3′
FAS reverse 5′-TCGTGTTCTGCTTCCAGGATC-3′
PPAR-γ forward 5′-TCGCTGATGCACTGCCTATG-3′
PPAR-γ reverse 5′-TGTCAAAGGAATGCGAGTGGTC-3′
SREBP-1c primer sequences were taken from Yang, et al (Yang et al., 2001). Primers for 18S rRNA were purchased from Applied Biosystems. The relative amounts of mRNAs were calculated using the comparative CT method. 18S rRNA was used as the invariant control. All final values were taken from at least two replicates, which were performed at the cDNA synthesis step. Because the experimental designed consisted of multiple molecules of interest at 4 times points in 3 different tissues, and also required measuring 18S rRNA for each sample, the number of samples per condition was limited to 4-5. Dissociation plots for each experiment indicated a single product detected in the reaction.
Western blots
Previously snap-frozen liver tissue was homogenized in 50 mM MOPS supplemented with 250 mM sucrose, 2 mM EDTA, 2 mM EGTA, 50 mM NaF, and 5 μl/ml protease inhibitor mixture (Sigma). After homogenization, protein concentration was determined using a Bio-Rad protein assay kit and BSA standards. Equal amounts of protein (30 μg/lane) was resolved on a 7% SDS-polyacrylamide gel and transferred to Immobilon-P membranes (Millipore). Equality of protein loading was reassessed via Ponceau S staining of the membrane after transfer. Blots were then blocked in 5% milk, 0.1% Tween-20, in TBS for one hour at 4°C. Primary anti-Sir2 (Upstate, cat #07131) antibody was diluted in the blocking solution 1:10,000 and incubated with the blot overnight at 4°C. Secondary incubation was for 1 hour at room temperature with HRP-conjugated goat anti-rabbit IgG (Pierce, Cat# 31402) in blocking solution. Immunoreactive bands were detected by ECL-Plus chemiluminescense (Amersham Biosciences) and quantified by densitometry using Molecular Analyst (Bio-Rad).
Statistics
Group comparisons were made by either Student’s t-test (Figure 4) or one-way ANOVA with Dunnett’s post-hoc (Figures 2,3,5 and 6). A p-value <0.05 was considered statistically significant. All data are expressed as mean ± SEM.
Figure 4.
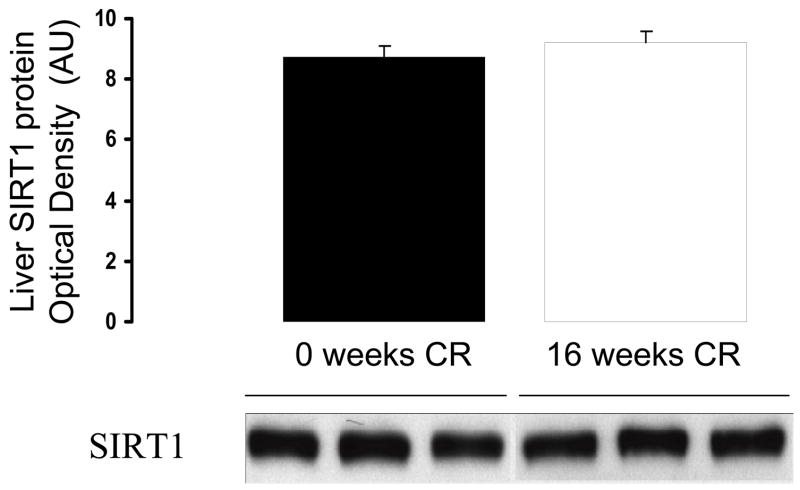
Effects of 16 weeks of calorie restriction on SIRT1 protein levels in the liver. N=5 per group
Figure 2.
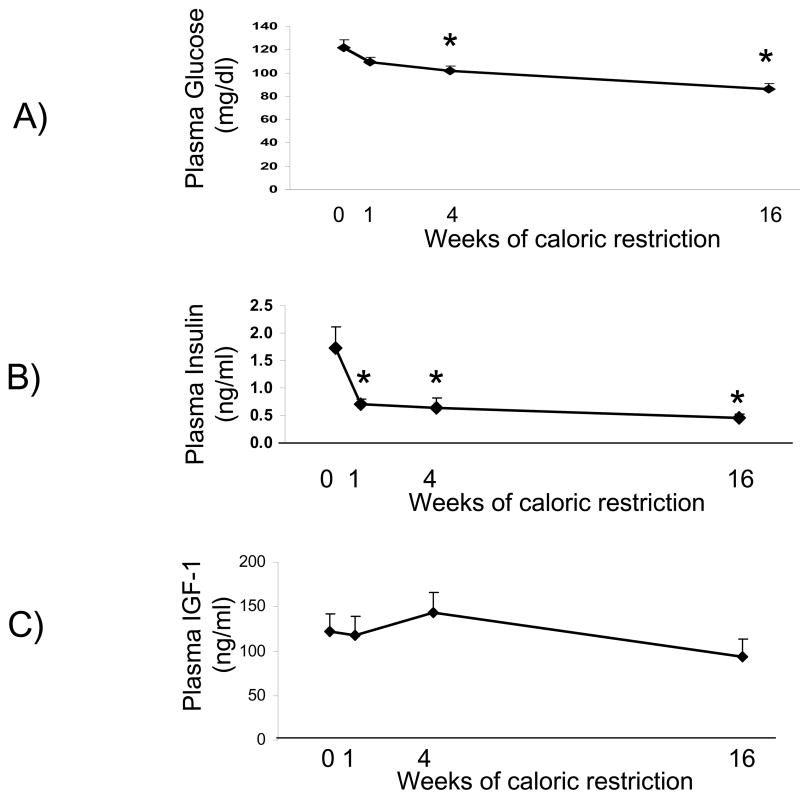
Plasma glucose, insulin and IGF-1 levels measured at the time of sacrifice. Insulin levels were significantly decreased after 1 week of calorie restriction and glucose was significantly decreased after 4 weeks of calorie restriction, while IGF-1 levels did not significantly change from baseline. N=9 at each time point for glucose and 7-8 for insulin and IGF-1
* significantly different from control
Figure 3.
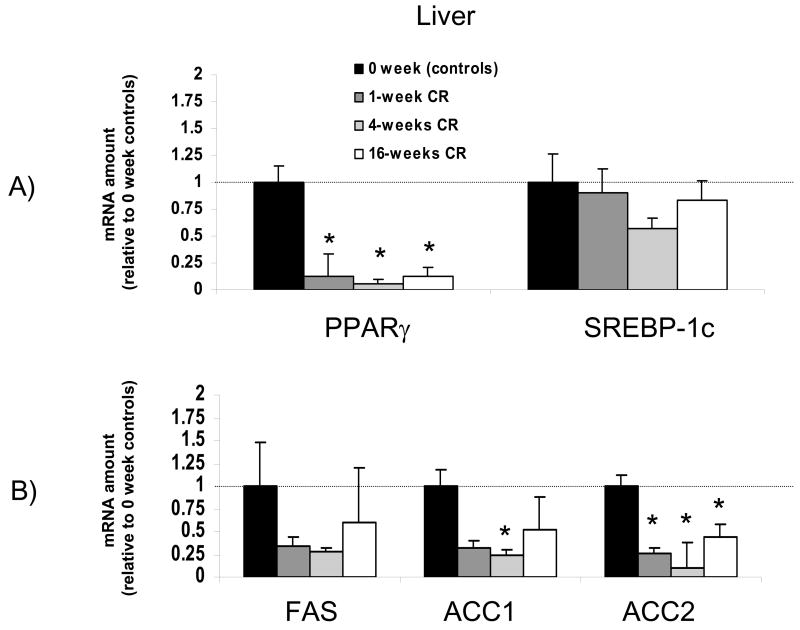
Time course for the effects of calorie restriction on liver mRNA levels. The data from real-time PCR were normalized by 18 rRNA and are expressed relative to the control group (0 weeks of calorie restriction). Note that in liver PPARγ was decreased to less than 20% of baseline levels after only one week of a calorie restricted diet. N=4-5 per group * significantly different from control group
Figure 5.
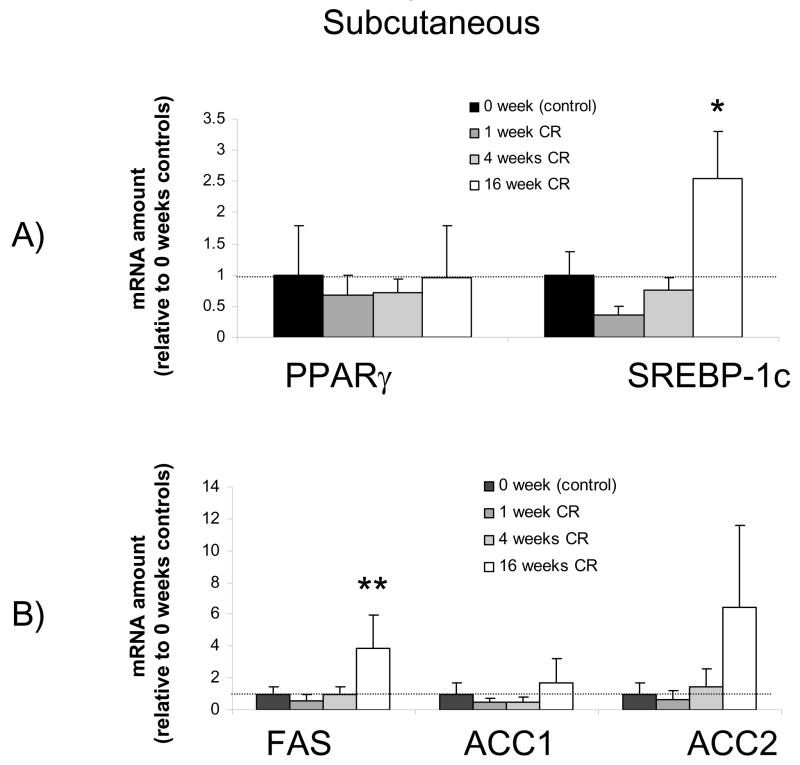
Time course for the effects of calorie restriction on subcutaneous adipose tissue mRNA levels. The data from real-time PCR were normalized by 18 rRNA and are expressed relative to the control group (0 weeks of calorie restriction). Note that PPARγ was unchanged from baseline, but SREBP-1c and FAS were significantly increased after 16 weeks of calorie restriction. N=4-5 per group * significantly different from control group
Figure 6.
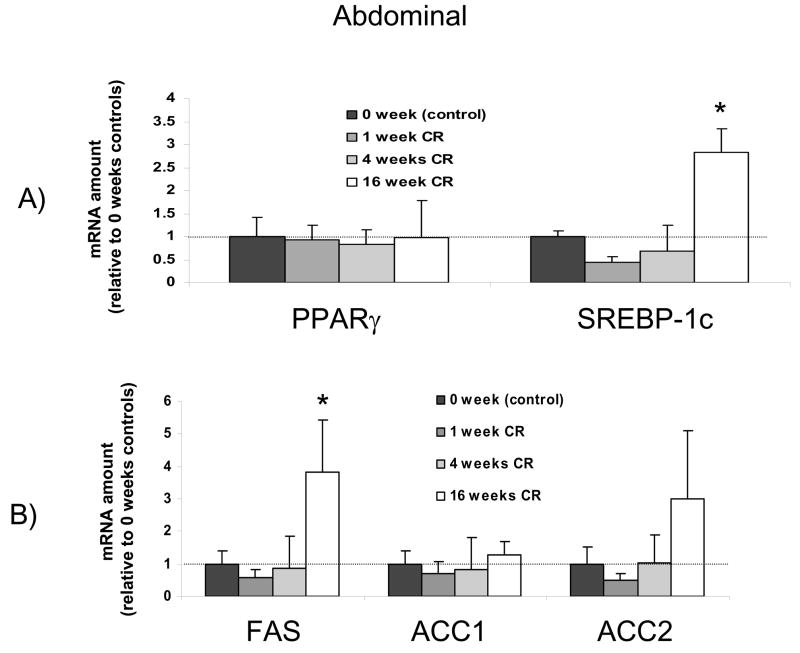
Time course for the effects of calorie restriction on abdominal adipose tissue mRNA levels. The data from real-time PCR were normalized by 18 rRNA and are expressed relative to the control group (0 weeks of calorie restriction). Note that PPARγ was unchanged from baseline, but SREBP-1c and FAS were significantly increased after 16 weeks of calorie restriction, the same pattern observed in subcutaneous adipose tissue. N=4-5 per group * significantly different from control group
Results
Plasma values for glucose, insulin and IGF-1 measured at the time of sacrifice are shown in Figure 2. Calorie restriction did not significantly affect plasma IGF-1 concentration at any of the time points. In contrast, plasma insulin levels were significantly lowered during the first week of calorie restriction, and this low level of insulin sustained at 4 and 16 weeks of calorie restriction. This fall in insulin occurred in parallel with a decline in glucose levels which became statistically significant after 4 weeks of calorie restriction.
The effects of calorie restriction on the liver are shown in Figure 3 and 4. Within one week of initiating calorie restriction PPARγ mRNA levels were lowered to 13% of baseline levels (p<0.05). This calorie restriction-induced down regulation of PPARγ was sustained throughout the 16 weeks of calorie restriction. In contrast, SREBP-1c mRNA levels were not significantly lowered by calorie restriction at any of the time points (Figure 3A). FAS, ACC1 and ACC2 mRNA levels decreased with a timecourse similar to that of PPARγ, falling to approximately 25% of baseline levels within the first week of initiating calorie restriction, although this did not reach statistical significance for FAS or ACC1 (Figure 3B). As was the case with PPARγ, the calorie restriction-induced down regulation of ACC2 reached statistical significance after only 1 week of calorie restriction and was sustained throughout the 16 weeks of calorie restriction.
SIRT1 is a histone deacetylase that represses PPARγ’s effects, and has itself been implicated in the benefits of calorie restriction (Cohen et al., 2004). To evaluate the effect of calorie restriction on the liver, mRNA and protein levels of SIRT1 levels were measured in control mice and mice that had undergone 16 weeks of calorie restriction. Levels of mRNA for SIRT1 in the liver were not significantly affected by 16 weeks of calorie restriction, remaining at 78 ± 34% of control levels (n=5 each, p=0.38). Consistent with this, there was no significant effect of 16 weeks of calorie restriction on SIRT1 protein levels in the liver (Figure 4).
In contrast to the liver, calorie restriction had no effects on PPARγ in either abdominal or subcutaneous adipose tissue (Figures 5 and 6). However, in both types of adipose tissue calorie restriction caused a significant upregulation of SREBP-1c that was not manifest until 16 weeks after initiating calorie restriction. Concomitant with this increase in SREBP-1c was a significant increase in FAS after 16 weeks of calorie restriction in the abdominal and subcutaneous adipose tissues (Figure 5B and 6B). While the effects of calorie restriction on adipose tissue were very different from those on liver, the two types of adipose tissue responded very similarly, with no significant differences between abdominal and subcutaneous adipose tissue observed.
Discussion
Liver
Calorie restriction extends maximal lifespan in animals largely by decreasing the rate of tumor formation (Dhahbi, et al., 2004; Weindruch, 1996; Weindruch, et al., 1986). In the liver, caloric restriction dramatically lowers the incidence of both spontaneously occurring tumors as well as tumors induced by a carcinogenic agent (Fu, et al., 1994; Yoshida, et al., 1999). These protective effects occur within the first few weeks of initiating a calorie restricted diet (Dhahbi, et al., 2004). Our finding of a rapid, caloric restriction-induced lowering of enzymes controlling fatty acid biosynthesis in the liver is of interest in this regard since recent data demonstrate a tight link between the amount of FAS and the timing and extent of tumor development (De Schrijver, et al., 2003; Kuhajda, 2000; Menendez, et al., 2005; Pizer, et al., 1998). This relationship is particularly evident in a subset of aggressive malignancies that appear to require a high rate of lipogenesis for growth (De Schrijver, et al., 2003; Kuhajda, 2000; Menendez, et al., 2005; Pizer, et al., 1998). Thus our finding that calorie restriction rapidly down regulates ACC2, with qualitatively similar effects (although not statistically significant) in ACC1 and FAS, supports the possibility that a rapidly occurring inhibition of lipid biosynthesis may be a mechanism by which calorie restriction inhibits cancer in animals. We had previously reported that ACC protein levels in the liver were decreased to approximately 25% of baseline after 16 weeks of calorie restriction, and speculated that this might be part of a more general down regulation of lipogenic enzymes (Gonzalez, et al., 2004). In the present report we extend this finding by demonstrating that significant changes in gene expression for ACC actually occur much sooner after the initiation of a calorie restricted diet. This is important since it indicates that the changes in expression of these genes occur within the timeframe of the emerging anti-tumor phenotype (Dhahbi, et al., 2004). Additionally, these data provide evidence for two mechanistic links between calorie restriction and down regulation of these enzyme, PPARγ and insulin, both of which are regulators of FAS gene expression (Assimacopoulos-Jeannet et al., 1995). Taken as a whole, our data suggest that some of the anti-cancer effects of calorie restriction may be mediated by a tissue specific inhibition of fatty acid biosynthesis that is caused by decreased levels of insulin and PPARγ. However, some data indicate that caloric restriction-induced decreases in PPARγ are not sustained in aged mice during long-term caloric restriction (Masternak et al., 2004; Masternak et al., 2005).
A molecule that represses the effects of PPARγ by docking to a negative cofactor, and has itself been implicated in the benefits of calorie restriction, is the histone deacetylase SIRT1 (Cohen, et al., 2004). Overexpression of SIRT1 extends lifespan in several models and at least two reports indicate that rodents fed ad libitum have less SIRT1 protein and/or mRNA than do calorie restricted rodents (Cohen, et al., 2004; Nemoto et al., 2004). It was somewhat surprising that 16 weeks of calorie restriction had no measurable effect on hepatic SIRT1 mRNA or protein levels in our model. One possibility is that mice fed ad libitum have lower tissue levels of SIRT1 than lean controls, and thus calorie restriction appears to raise SIRT1 levels when ad libitum mice are used as the basis for comparison. While our results do not preclude SIRT1 as an important molecule in causing the calorie restriction phenotype, they raise the possibility that effects of calorie restriction on SIRT1 may not be as robust as previously suggested.
One important limitation of our study design was that we only studied mice in the fasting state, not during the potentially important metabolic adjustments that occur during re-feeding. For example, hepatic ACC increases dramatically during the re-feeding phase that CR mice are subjected to on a regular basis (Liang et al., 2002). The intriguing possibility that these types of metabolic adjustments play in a role in the CR-induced aging retardation merits further study.
Adipose Tissue
The recent recognition that white adipose tissue plays a central role in age-related pathologies such as type 2 diabetes and cancer, combined with the fact that adipose tissue is dramatically remodeled by calorie restriction, has led to the suggestion that calorie restriction-induced changes in adipose tissue may play a key role in the calorie restriction phenotype (Barzilai and Gabriely, 2001; Das et al., 2004). Here we evaluated the effects of calorie restriction on two key transcription factors, with several interesting results. First, even though a 20% decrease in body weight occurred during the first 4 weeks of calorie restriction, there were no significant changes in levels of PPARγ and SREBP-1c mRNA in adipose tissue. Thus rapid changes in adipose tissue PPARγ and SREBP-1c do not appear to be a trigger for calorie restriction’s benefits. A second finding was that 16 weeks of calorie restriction induced a dramatic upregulation of SREBP-1c but not PPARγ. Thus the effects of calorie restriction on adipose tissue were slower to occur, and directionally opposite, to those in the liver.
Epidemiological as well as other evidence indicates that abdominal fat is more directly related to negative health outcomes than is subcutaneous fat (Lafontan and Berlan, 2003; Pi-Sunyer, 2004). Therefore we tested the hypothesis that abdominal adipose tissue would be more resistant to calorie restriction-induced changes than subcutaneous adipose tissue. However, we found not only that the two types of adipose tissue were indistinguishable in control mice, but that the calorie restriction-induced changes in transcript levels were the same. Taken as a whole, our data indicate that in contrast to liver, rapid changes in PPARγ in adipose tissue are not a likely mediator of the calorie restriction phenotype. Whether this applies to other transcription factors and other important pathophysiological mediators in adipose tissue such as adipokines is unknown.
Insulin and IGF-1
Several lines of indirect evidence suggest that IGF-1 may play a key role in causing the calorie restriction phenotype (Breese et al., 1991; Shimokawa et al., 2003). Among these are the observations that mutations in the IGF-1 signaling pathway are sufficient to cause lifespan extension in several species. Additionally, long-term calorie restriction is known to decrease plasma IGF-1 (Berrigan et al., 2002; Breese, et al., 1991). However, reports conflict as to whether the calorie restriction-induced fall in IGF-1 levels occurs during the first 8 weeks of calorie restriction (Berrigan, et al., 2002; Sanz et al., 2005). Here our data demonstrate that plasma IGF-1 levels are not altered from baseline during the first 16 weeks of calorie restriction, indicating that a decrease in circulating IGF-1 is not among the early triggers of the calorie restriction phenotype. However, we cannot rule out the possibility that changes in the IGF-1 signaling have occurred within this timeframe, or that eventual falls in plasma IGF-1 levels contribute to some aspects of the calorie restriction phenotype.
In contrast to IGF-1, insulin levels fell by approximately 50% after 1-week of calorie restriction, and remained at low levels throughout the first 16 weeks of the calorie restricted diet. This is consistent with, and extends, a recent report that insulin and glucose are both decreased after 20-days of calorie restriction (Argentino et al., 2005). Combined with the knowledge that manipulation of insulin signaling is sufficient to cause lifespan extension in some models, our finding are consistent with a primary role of calorie restriction-induced decreases in insulin and increases in insulin sensitivity in causing the calorie restriction phenotype. While the insulin and IGF-1 pathways are often considered together because of their overlap and similarities, our data show that they have very distinct temporal responses to calorie restriction. This difference in timing may help clarify their roles in causing specific aspects of the calorie restriction phenotype.
In summary, by examining the early time course of calorie restriction’s effects we were able to identify plasma insulin and hepatic PPARγ as molecules down regulated within the first week of initiating a calorie restricted diet. Given the number of age and cancer related cellular processes influenced by insulin and PPARγ, our data are consistent with their rapid downregulation playing a significant role in the anti-cancer and anti-aging phenotype of calorie restricted animals.
Acknowledgments
The authors would like to thank Dr. Richard Weindruch for his invaluable assistance in conducting this study. This work was supported by National Institute on Aging grant AG-00908, National Heart Lung and Blood Institute grant HL-07936 and a grant from the UW Comprehensive Cancer Center.
Footnotes
Publisher's Disclaimer: This is a PDF file of an unedited manuscript that has been accepted for publication. As a service to our customers we are providing this early version of the manuscript. The manuscript will undergo copyediting, typesetting, and review of the resulting proof before it is published in its final citable form. Please note that during the production process errors may be discovered which could affect the content, and all legal disclaimers that apply to the journal pertain.
References
- Argentino DP, Munoz MC, Rocha JS, Bartke A, Turyn D, Dominici FP. Horm Metab Res. 2005;37:672–9. doi: 10.1055/s-2005-870577. [DOI] [PubMed] [Google Scholar]
- Assimacopoulos-Jeannet F, Brichard S, Rencurel F, Cusin I, Jeanrenaud B. Metabolism. 1995;44:228–33. doi: 10.1016/0026-0495(95)90270-8. [DOI] [PubMed] [Google Scholar]
- Barzilai N, Gabriely I. J Nutr. 2001;131:903S–906S. doi: 10.1093/jn/131.3.903S. [DOI] [PubMed] [Google Scholar]
- Berrigan D, Perkins SN, Haines DC, Hursting SD. Carcinogenesis. 2002;23:817–22. doi: 10.1093/carcin/23.5.817. [DOI] [PubMed] [Google Scholar]
- Blackwell BN, Bucci TJ, Hart RW, Turturro A. Toxicol Pathol. 1995;23:570–82. doi: 10.1177/019262339502300503. [DOI] [PubMed] [Google Scholar]
- Breese CR, Ingram RL, Sonntag WE. J Gerontol. 1991;46:B180–7. doi: 10.1093/geronj/46.5.b180. [DOI] [PubMed] [Google Scholar]
- Cohen HY, Miller C, Bitterman KJ, Wall NR, Hekking B, Kessler B, Howitz KT, Gorospe M, de Cabo R, Sinclair DA. Science. 2004;305:390–2. doi: 10.1126/science.1099196. [DOI] [PubMed] [Google Scholar]
- Das M, Gabriely I, Barzilai N. Obes Rev. 2004;5:13–9. doi: 10.1111/j.1467-789x.2004.00115.x. [DOI] [PubMed] [Google Scholar]
- De Schrijver E, Brusselmans K, Heyns W, Verhoeven G, Swinnen JV. Cancer Res. 2003;63:3799–804. [PubMed] [Google Scholar]
- Dhahbi JM, Kim HJ, Mote PL, Beaver RJ, Spindler SR. Proc Natl Acad Sci U S A. 2004;101:5524–9. doi: 10.1073/pnas.0305300101. [DOI] [PMC free article] [PubMed] [Google Scholar]
- Ettinger SL, Sobel R, Whitmore TG, Akbari M, Bradley DR, Gleave ME, Nelson CC. Cancer Res. 2004;64:2212–21. doi: 10.1158/0008-5472.can-2148-2. [DOI] [PubMed] [Google Scholar]
- Fu PP, Dooley KL, Von Tungeln LS, Bucci T, Hart RW, Kadlubar FF. Carcinogenesis. 1994;15:159–61. doi: 10.1093/carcin/15.2.159. [DOI] [PubMed] [Google Scholar]
- Gonzalez AA, Kumar R, Mulligan JD, Davis AJ, Weindruch R, Saupe KW. Am J Physiol Endocrinol Metab. 2004;287:E1032–7. doi: 10.1152/ajpendo.00172.2004. [DOI] [PubMed] [Google Scholar]
- Ingram DK, Zhu M, Mamczarz J, Zou S, Lane MA, Roth GS, deCabo R. Aging Cell. 2006;5:97–108. doi: 10.1111/j.1474-9726.2006.00202.x. [DOI] [PubMed] [Google Scholar]
- Kirkland JL, Tchkonia T, Pirtskhalava T, Han J, Karagiannides I. Exp Gerontol. 2002;37:757–67. doi: 10.1016/s0531-5565(02)00014-1. [DOI] [PubMed] [Google Scholar]
- Kuhajda FP. Nutrition. 2000;16:202–8. doi: 10.1016/s0899-9007(99)00266-x. [DOI] [PubMed] [Google Scholar]
- Lafontan M, Berlan M. Trends Pharmacol Sci. 2003;24:276–83. doi: 10.1016/S0165-6147(03)00132-9. [DOI] [PubMed] [Google Scholar]
- Liang G, Yang J, Horton JD, Hammer RE, Goldstein JL, Brown MS. J Biol Chem. 2002;277:9520–8. doi: 10.1074/jbc.M111421200. [DOI] [PubMed] [Google Scholar]
- Masternak MM, Al-Regaiey K, Bonkowski MS, Panici J, Sun L, Wang J, Przybylski GK, Bartke A. J Gerontol A Biol Sci Med Sci. 2004;59:784–8. doi: 10.1093/gerona/59.8.b784. [DOI] [PubMed] [Google Scholar]
- Masternak MM, Al-Regaiey KA, Del Rosario Lim MM, Jimenez-Ortega V, Panici JA, Bonkowski MS, Kopchick JJ, Bartke A. J Gerontol A Biol Sci Med Sci. 2005;60:1394–8. doi: 10.1093/gerona/60.11.1394. [DOI] [PubMed] [Google Scholar]
- Menendez JA, Decker JP, Lupu R. J Cell Biochem. 2005;94:1–4. doi: 10.1002/jcb.20310. [DOI] [PubMed] [Google Scholar]
- Nemoto S, Fergusson MM, Finkel T. Science. 2004;306:2105–8. doi: 10.1126/science.1101731. [DOI] [PubMed] [Google Scholar]
- Picard F, Guarente L. Int J Obes (Lond) 2005;29(Suppl 1):S36–9. doi: 10.1038/sj.ijo.0802912. [DOI] [PubMed] [Google Scholar]
- Pi-Sunyer FX. Nutr Rev. 2004;62:S120–6. doi: 10.1111/j.1753-4887.2004.tb00081.x. [DOI] [PubMed] [Google Scholar]
- Pizer ES, Chrest FJ, DiGiuseppe JA, Han WF. Cancer Res. 1998;58:4611–5. [PubMed] [Google Scholar]
- Rossi S, Graner E, Febbo P, Weinstein L, Bhattacharya N, Onody T, Bubley G, Balk S, Loda M. Mol Cancer Res. 2003;1:707–15. [PubMed] [Google Scholar]
- Sanz A, Gredilla R, Pamplona R, Portero-Otin M, Vara E, Tresguerres JA, Barja G. Biogerontology. 2005;6:15–26. doi: 10.1007/s10522-004-7380-0. [DOI] [PubMed] [Google Scholar]
- Semple RK, Chatterjee VK, O’Rahilly S. J Clin Invest. 2006;116:581–9. doi: 10.1172/JCI28003. [DOI] [PMC free article] [PubMed] [Google Scholar]
- Shimokawa I, Higami Y, Tsuchiya T, Otani H, Komatsu T, Chiba T, Yamaza H. Faseb J. 2003;17:1108–9. doi: 10.1096/fj.02-0819fje. [DOI] [PubMed] [Google Scholar]
- Weindruch R. Toxicol Pathol. 1996;24:742–5. doi: 10.1177/019262339602400618. [DOI] [PubMed] [Google Scholar]
- Weindruch R, Walford RL, Fligiel S, Guthrie D. J Nutr. 1986;116:641–54. doi: 10.1093/jn/116.4.641. [DOI] [PubMed] [Google Scholar]
- Wolf G. Nutr Rev. 2006;64:89–92. doi: 10.1301/nr.2006.feb.89-92. [DOI] [PubMed] [Google Scholar]
- Yang J, Goldstein JL, Hammer RE, Moon YA, Brown MS, Horton JD. Proc Natl Acad Sci U S A. 2001;98:13607–12. doi: 10.1073/pnas.201524598. [DOI] [PMC free article] [PubMed] [Google Scholar]
- Yoshida K, Inoue T, Hirabayashi Y, Nojima K, Sado T. J Nutr Health Aging. 1999;3:121–6. [PubMed] [Google Scholar]


