

SUMMARY
Background
The World Health Organization and American Diabetes Association criteria for diagnosing diabetes assume the presence of a glycemic threshold with high sensitivity for identifying retinopathy. However, this assumption is based on data from three previous studies that had significant limitations in detecting retinopathy.
Methods
We examined the relationship of fasting plasma glucose (FPG) with retinopathy in three cross-sectional populations: the Blue Mountains Eye Study (BMES, Australia, n=3162), the Australian Diabetes, Obesity and Lifestyle Study (AusDiab, Australia, n=2182), and the Multi-Ethnic Study of Atherosclerosis (MESA, USA, n=6079). Retinopathy was defined from multiple retinal photographs of each eye, graded according to the modified Airlie House Classification system.
Findings
The overall prevalence of retinopathy was 11.5% (95% confidence interval, CI 10.4–12.6%, BMES), 9.6% (CI 8.4–10.9%, AusDiab) and 15.8% (CI 14.9–16.7%, MESA). In contrast to the findings of the three previous studies, we found inconsistent evidence of a uniform glycemic threshold for prevalent and incident retinopathy, with analyses suggesting a continuous relationship. The widely used diabetes FPG cut-off of ≥ 7.0 mmol/l had sensitivity less than 40% (range 14.8–39.1%) for detecting retinopathy, with specificity between 80.8–95.8%. The area under receiver operating characteristic curves for FPG and retinopathy was low and ranged from 0.56 to 0.61.
Interpretation
There was no evidence of a clear and consistent glycemic threshold for the presence or incidence of retinopathy across different populations. The current FPG cut-off of 7.0 mmol/l used to diagnose diabetes performed poorly at identifying persons with and without retinopathy. These findings suggest that the criteria for diagnosing diabetes may require re-evaluation.
INTRODUCTION
Diabetes mellitus is estimated to affect 380 million people by 2025.(1;2) Both the World Health Organization (WHO)(3) and the American Diabetes Association (ADA)(4) use a fasting plasma glucose (FPG) of ≥ 7.0mmol/l to define diabetes. This criterion is based on an underlying assumption that there exists a clear glycemic threshold that separates persons at high and low risk of diabetic microvascular complications.(5)
Retinopathy (e.g., microaneurysms, retinal haemorrhages) is the most specific microvascular complication of diabetes. Approximately two decades ago, three pivotal epidemiological studies among Pima Indians,(6) Egyptians,(7) and the NHANES III(8) showed that retinopathy signs were rare below a FPG threshold of 7.0 mmol/l, but their prevalence increased dramatically above it.(8) A key observation was that the FPG cut-off of 7.0mmol/l had high sensitivity and specificity for identifying persons with and without retinopathy. This cut-off was therefore used by the WHO and ADA to diagnose diabetes.(8;9)
These three epidemiological studies, however, had a major limitation: an imprecise and incomplete ascertainment of retinopathy. The presence of retinopathy was assessed from a direct clinical ophthalmoscopic examination in one study(6) and from a single retinal photograph in the other two.(7;8) These methods are less reliable, because they only image a small portion of the retina, and have been shown to underestimate retinopathy signs when compared to multiple field retinal photographs, currently the gold standard in clinical trials.(10;11) This limitation had led to continuing uncertainty regarding the existence of a clear glycaemic threshold for retinopathy upon which the current diabetes diagnostic criteria are based. Furthermore, early reports from the Diabetes Prevention Program indicate a substantial prevalence of retinopathy signs in persons with FPG below diabetic levels, casting further doubt on the validity of current diagnostic criteria.(12)
In this study, we sought to clarify the relationship between FPG and retinopathy using data from three large contemporary populations that assessed retinopathy from a standardized, masked grading of multiple field retinal photographs. Our objectives were: first, to provide updated data on the relationship of FPG to retinopathy; second, to assess the diagnostic accuracy of current FPG thresholds in identifying both prevalent and incident retinopathy; and third, to verify the existence of a clear glycaemic threshold for retinopathy in different populations.
METHODS
Study Design and Populations
We analysed cross-sectional data from three population-based cohorts: the Blue Mountains Eye Study (BMES, Australia, n=3,162 participants), the Australian Diabetes, Obesity and Lifestyle Study (AusDiab, Australia, n=2,182 participants) and the Multi-Ethnic Study of Atherosclerosis (MESA, USA, n=6,079 participants). We also analyzed prospective data from the BMES 5-year follow-up examination (n=1,903).
The study populations and retinopathy assessment from retinal photographs have been described extensively in previous reports.(13–19) Retinopathy grading followed the same protocol in all three studies. The Human Research Ethics Committees at each study site approved the examinations and informed consent was obtained from all participants. Details of participant characteristics and methods are summarized in Table 1.
Table 1.
Characteristics of the Three Population-based Studies
| The Blue Mountains Eye Study(14;15) | The AusDiab Study(16;17) | The MESA(18;19) | |
|---|---|---|---|
| Geographical location | Sydney, Australia | Australia-wide | Six US communities |
| Ethnicity | 99% white | >95% white | Whites (39.6%), blacks (27.0%), Hispanic (21.6%), Chinese (11.8%) |
| Eligibility | All adults aged ≥ 49 years living in 2 post code areas | All adults aged ≥ 25 years living in 42 randomly selected urban and rural areas | All adults aged 45–84 inclusive living in 6 US counties |
| Total sample size | 3654 | 2773 | 6237 |
| Sample size (% of total eligible) in analysis | 3162 (71.3) | 2182 (78.7) | 6079 (89.2%) |
| Date of survey | 1992–4 | 1999–2000 | 2002–4 |
| Age, years | 65.9 ±9.4 | 57.5 ±13.8 | 63.5 ±9.5 |
| Age range, years | 45–97 | 25–90 | 45–84 |
| Male - (%) | 1360 (43.0) | 964 (44.2) | 2895 (47.6) |
| Diabetes* – (%) | 253 (8.0) | 733 (33.6) | 778 (12.8) |
| Hypertension† - (%) | 2256 (71.3) | 17.8 (52.2) | 2974 (48.9) |
| Current cigarette smoker – (%) | 464 (14.7) | 261 (12.2) | 763 (12.6) |
| Fasting plasma glucose, mmol/l | 5.3 ±1.6 | 6.5 ±2.2 | 5.9 ±1.4 |
| Systolic blood pressure, mmHg | 146.4 ±21.5 | 137.2 ±19.8 | 124.3 ±20.2 |
| Diastolic blood pressure, mmHg | 83.4 ±10.0 | 72.1 ±12.2 | 70.4 ±10.0 |
| Measurement of fasting glucose | Hitachi 747 biochemistry analyzer, Tokyo, Japan | Olympus AU600 analyser Olympus Diagnostic Systems, Eastleigh, UK | Vitros analyzer, Johnson & Johnson Clinical Diagnostics, USA |
| Retinal photographs | Six 30° | Two 45° | Two 45° |
| Retinopathy grading scale used | Modified Airlie House classification scheme in ETDRS.(23) | ||
| Definition of any retinopathy | ETDRS level ≥ 15 | ETDRS level ≥ 20 | ETDRS level ≥ 20 |
| Definition of moderate retinopathy(24) | ETDRS level ≥ 31 | ETDRS level ≥ 31 | ETDRS level ≥ 31 |
| Grading center | Sydney, Australia | Melbourne, Australia | Wisconsin, Madison |
| Intra-grader reliability kappa | 0.82–0.98 | 0.73 | 0.99 |
| Inter-grader reliability kappa | 0.90 | NA (one grader) | 0.89 |
| Number (%) with retinopathy | 364 (11.5) | 210 (9.3) | 959 (15.8) |
ETDRS refers to Early Treatment Diabetic Retinopathy Study; ETDRS Level 15 defined as “Retinal hemorrhage present without any definite microaneurysms or other lesions” and Level 20 defined as “Microaneurysms present without other typical diabetic lesions (e.g. hard exudates, cotton wool spots, venous beading)”, ± refers to standard deviation
The AusDiab: The Australian Diabetes, Obesity and Lifestyle Study; MESA: Multi-ethnic Study of Atherosclerosis
Diabetes defined as prior medical diagnosis of diabetes, or use of diabetic medications, or with fasting plasma glucose ≥ 7.0mmol/l (126 mg/dl) at time of examination.
Hypertension defined according to WHO criteria i.e. previous diagnosis of hypertension and current use of antihypertensive medications, or systolic blood pressure ≥ 7.8mmHg or diastolic blood pressure ≥ 90mmHg.(20)
The Blue Mountains Eye Study (BMES)
The BMES is a population-based cohort study of vision and eye disease in an urban Australian population aged ≥ 49 years.(13–15) The BMES examined 3,654 of 4,433 eligible residents (82.4%) living in two post-codes of the Blue Mountains, west of Sydney, during 1992–4. After excluding 124 without gradable retinal photographs,(14) and 368 without FPG, 3,162 (71.3%) participants contributed data towards the cross-sectional analyses. For 5-year incident retinopathy analyses, we excluded a further 895 persons who were not re-examined in 1997–9, and 364 with retinopathy at baseline, leaving 1,903 (42.9%) with follow-up data.
The Australian Diabetes, Obesity and Lifestyle (AusDiab) Study
The AusDiab study is a population-based study of 11,247 people aged ≥25 years from 42 randomly selected urban and rural areas of Australia in 1999–2000.(16;17). Participants identified as having diabetes (both known and newly diagnosed), impaired glucose tolerance, impaired fasting glucose and a random sample of those with normal glucose tolerance were eligible to undergo retinal photography in the Complications component of the study. Of the 2,773 eligible, 2,476 attended (overall response rate 89%).(17) After excluding 292 participants without gradable photographs and two without FPG data, 2,182 (78.7%) participants were available for analysis. All participants had FPG measured from venous blood samples, while 2-hour post load glucose (2hPG) was measured only in participants not currently receiving insulin or tablets for treatment of diabetes (n=1,983, 71.5%).
The Multi-Ethnic Study of Atherosclerosis (MESA)
The MESA is a prospective cohort study of persons from 4 different racial groups (white, African-America, Hispanic and Chinese) aged 45–84 years without history of clinical cardiovascular disease living in six U.S. communities.(18;19) At the baseline examination, there were 6,814 participants. Retinal photography was performed at the second examination (2002–04),(18) for which 6,237 (91.5%) participants returned. After excluding 153 without gradable retinal photographs and five without FPG data, 6,079 (89.2%) participants provided data for this analysis.
Standardised Assessment of Retinopathy
All three studies had multiple field retinal photographs and used standardised protocols to assess retinopathy. In the BMES, six 30° retinal photographs per eye were taken after pharmacologic mydriasis at baseline and 5-year follow-up, while in both the AusDiab and the MESA, two 45° retinal photographs per eye were taken. At each site, trained graders masked to diabetes status assessed photographs for presence of retinopathy lesions using the modified Airlie House classification (21) as in the Early Treatment Diabetic Retinopathy Study (ETDRS).(22;23) Definitions of retinopathy are given in Table 1 and are similar to those used in the original studies that described a glycemic threshold for retinopathy.(8) We also defined a more severe level of retinopathy (moderate retinopathy) based on the International Diabetic Retinopathy Disease Severity Scale recommended by the American Academy of Ophthalmology.(24)
Role of the Funding Source
The funding source had no role in the study design; in the collection, analysis, and interpretation of data; in the writing of the report; or in the decision to submit the paper for publication.
Statistical Analyses
We aimed to replicate the analysis of the three previous studies showing evidence of a glycaemic threshold for retinopathy.(6–8) First, we plotted the frequency of retinopathy against FPG in intervals chosen to include 7.0 and 7.8 mmol/l. We examined these plots visually for evidence of a FPG threshold above which the prevalence of retinopathy increased. We tested statistically for thresholds using change point models, which assume a constant prevalence below the change point (threshold), and a linear association above.(17;25) To evaluate performance of FPG in discriminating retinopathy, we plotted receiver operating characteristic (ROC) curves and estimated the area under the curve. We cross-tabulated prevalent retinopathy at three FPG cut-offs – 7.0 mmol/l (the current cut-off for diagnosing diabetes), 5.6 mmol/l (the current cut-off for ‘normal’ FPG), and 7.8 mmol/l (previous cut-off for diagnosing diabetes)(8;9) – and then calculated sensitivity, specificity, positive and negative predictive values and positive and negative likelihood ratios.
We performed three subsidiary analyses: we analysed FPG with 5-year incident retinopathy in the BMES; glycosylated haemoglobin with prevalent retinopathy in the MESA; and 2hPG with prevalent retinopathy in the AusDiab. We used SAS version 9.1 (SAS Institute, Cary, NC) for all analyses.
RESULTS
The overall prevalence of retinopathy was 11.5%, 95% confidence interval, CI 10.4–12.6% (n=364/3,162) in the BMES, 9.6%, CI 8.4–10.9% (n=210/2,182) in the AusDiab and 15.8%, CI 14.9–16.7% (n=959/6,079) in the MESA. Figure 1 shows the cross-sectional frequency distribution of retinopathy and moderate retinopathy by FPG categories. In the BMES, the prevalence of retinopathy even at low levels of FPG was approximately 10% and increased above the 6.3–7.0 mmol/l category. Moderate retinopathy in the BMES occurred in around 1% of the population with low FPG and started increasing above the same threshold (6.3–7.0 mmol/l). In the AusDiab population, the prevalence of retinopathy was approximately 8% among participants with low FPG levels and increased above 7.1–7.8 mmol/l, whereas the prevalence of moderate retinopathy showed a continuous relationship with increasing FPG. In the MESA, the prevalence of retinopathy, even at low FPG, was above 10%, and increased continuously with FPG. Moderate retinopathy was also present at low FPG, and also increased continuously with FPG.
Figure 1.
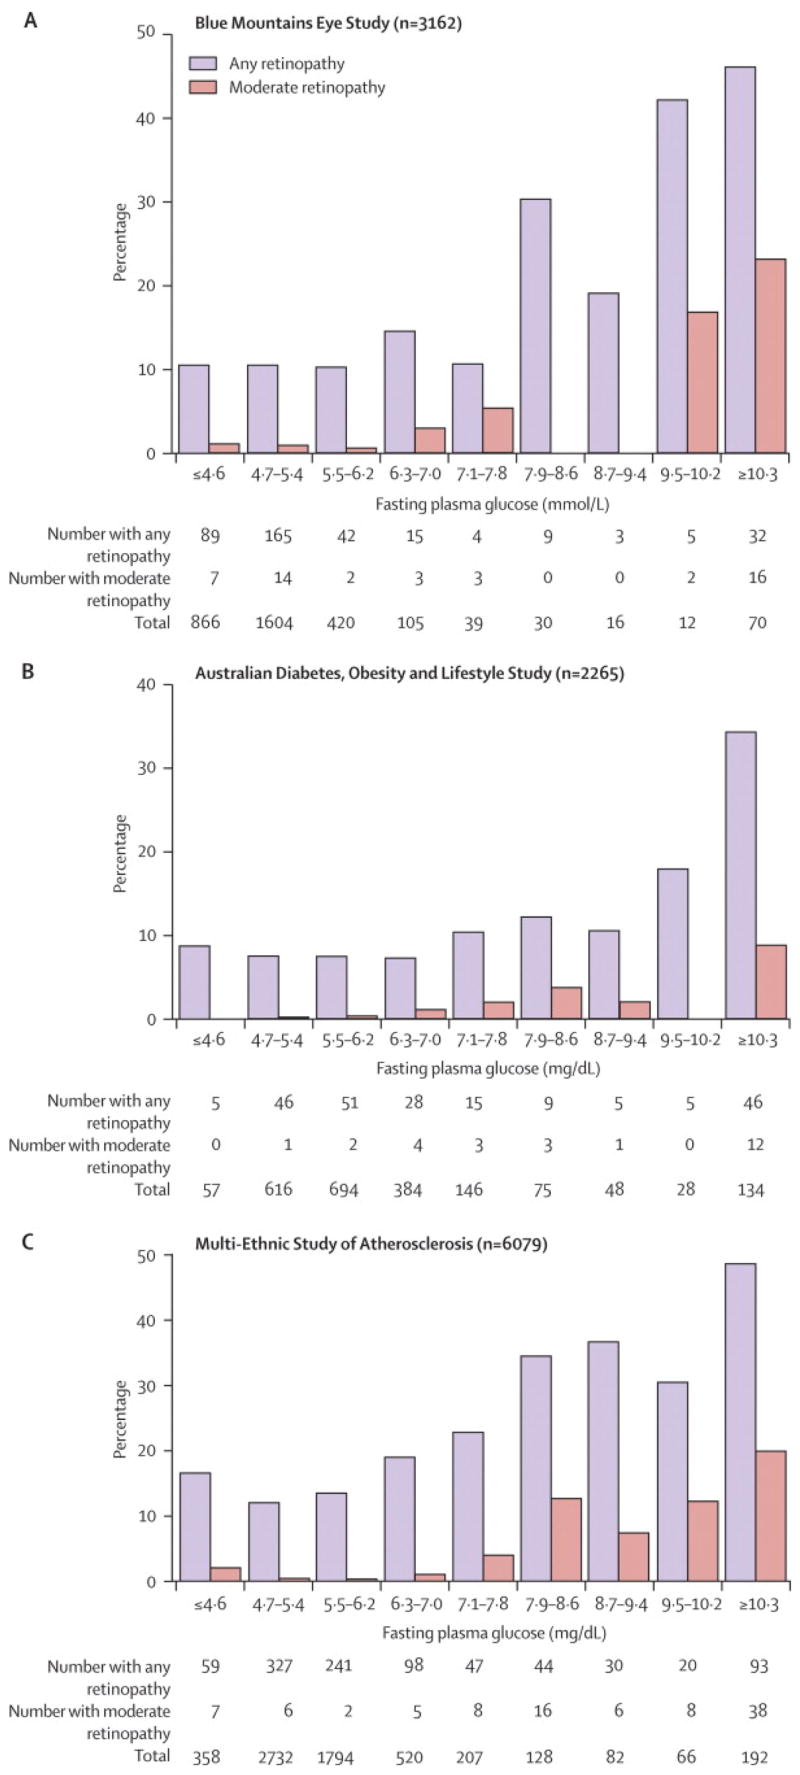
Relationship between Fasting Plasma Glucose and Retinopathy. Intervals Chosen to include the traditional Diabetes Cut-offs of 7.0 and 7.8 mmol/l. To convert from mmol/l to mg/dl, multiply by 18.
The results from change point models were inconsistent and indicated a range of possible glycaemic thresholds that varied between the three populations (Table 2). In some analyses no thresholds were detected.
Table 2.
Fasting Plasma Glucose Thresholds above which the Prevalence of Retinopathy Increases
| Fasting Plasma Glucose Thresholds (mmol/l)
|
|||
|---|---|---|---|
| The Blue Mountains Eye Study | The Australian Diabetes, Obesity and Lifestyle Study | The Multi-Ethnic Study of Atherosclerosis | |
| On visual inspection | 6.3–7.0 | 7.1–7.8 | No clear threshold |
| Change point model (95% CI) | 5.2 (1.6–6.7) | 6.3 (2.5–8.7) | No clear threshold |
CI: confidence intervals
The AusDiab: The Australian Diabetes, Obesity and Lifestyle Study; MESA: Multi-ethnic Study of Atherosclerosis
Adjusted for age, sex and systolic blood pressure.
Figure 2 shows the similarity in ROC curves for FPG and retinopathy in the three populations, with area under the curve of 0.56 (BMES), 0.61 (AusDiab) and 0.60 (MESA). Table 3 presents the performance of three common FPG cut-offs in detecting prevalent retinopathy. Below a 7.0 mmol/l FPG cut-off, a considerable proportion (7.4–13.4%) of participants in all three studies had retinopathy, while 17.8–34.7% had retinopathy above the cut-off. The sensitivity of this FPG cut-off was low (14.8–39.1%), with specificity above 80% (80.8–95.8%) for detecting retinopathy. The positive predictive value of this cut-off was also low (17.8–34.7%), while negative predictive value was higher (86.6–92.6%). Positive likelihood ratios at this cut-off ranged from 2.4–3.0, while negative likelihood ratios ranged from 0.8–0.9. A higher (7.8 mmol/l) cut-off had lower sensitivity but higher specificity, positive predictive values and positive likelihood ratios, with largely unchanged negative predictive values and negative likelihood ratios. A lower cut-off to 5.6mmol/l increased sensitivity, but reduced specificity, positive predictive values and positive likelihood ratios.
Figure 2.
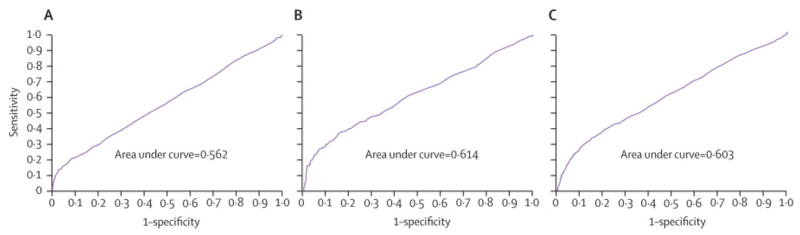
Receiver Operating Characteristic (ROC) curves for Fasting Plasma Glucose (mmol/l) and Prevalent Retinopathy (A: Blue Mountains Eye Study, B: The AusDiab Study and C: The MESA Study)
Table 3.
Sensitivity, Specificity, Positive and Negative Predictive Value for Retinopathy At Different Fasting Plasma Glucose Cut Offs. To convert from mmol/l to mg/dl, multiply by 18.
| Fasting plasma glucose threshold | No of retinopathy cases/Total no of participants (%)
|
Sensitivity (%) | Specificity (%) | Positive Predictive Value (%) | Negative Predictive Value (%) | Positive Likelihood Ratio | Negative Likelihood Ratio | |
|---|---|---|---|---|---|---|---|---|
| Below the cut off | Above the cut off | |||||||
| The Blue Mountains Eye Study | ||||||||
| ≥ 7.8 mmol/l | 314/3030 (10.4) | 50/132 (37.9) | 37.9 | 89.6 | 37.9 | 89.6 | 3.6 | 0.7 |
| ≥ 7.0 mmol/l | 310/2990 (10.4) | 54/172 (31.4) | 31.4 | 89.6 | 31.4 | 89.6 | 3.0 | 0.8 |
| ≥ 5.6 mmol/l | 262/2568 (10.2) | 102/594 (17.2) | 17.2 | 89.8 | 17.2 | 89.8 | 1.7 | 0.9 |
| The Australian Diabetes, Obesity and Lifestyle Study | ||||||||
| ≥ 7.8 mmol/l | 144/1884 (7.6) | 66/298 (22.2) | 22.2 | 92.4 | 22.2 | 92.4 | 2.9 | 0.8 |
| ≥ 7.0 mmol/l | 128/1722 (7.4) | 82/460 (17.8) | 17.8 | 92.6 | 17.8 | 92.6 | 2.4 | 0.9 |
| ≥ 5.6 mmol/l | 57/773 (7.4) | 153/7.89 (10.9) | 10.9 | 92.6 | 10.9 | 92.6 | 1.5 | 1.0 |
| The Multi-Ethnic Study of Atherosclerosis | ||||||||
| ≥ 7.8 mmol/l | 772/5611 (13.8) | 187/468 (40.0) | 40.0 | 86.2 | 40.0 | 86.2 | 2.9 | 0.7 |
| ≥ 7.0 mmol/l | 725/5404 (13.4) | 234/675 (34.7) | 34.7 | 86.6 | 34.7 | 86.6 | 2.6 | 0.8 |
| ≥ 5.6 mmol/l | 450/3524 (12.8) | 509/2555 (19.9) | 19.9 | 87.2 | 19.9 | 87.2 | 1.6 | 0.9 |
We repeated the analyses in Table 3 for moderate retinopathy. In all three populations, the performance of a 7.0 mmol/l FPG cut-off at detecting moderate retinopathy improved slightly, but remained generally poor.
We performed the following subsidiary analyses. We examined the relationship between baseline FPG and incident retinopathy in the BMES (Figure 3A). On visual inspection, the incidence of retinopathy increased continuously with FPG. Change point models indicated no thresholds. At a baseline 7.0 mg/dl FPG cut-off, sensitivity for incident retinopathy was very low at 10.2%, specificity 97.4%, positive predictive value 30.8%, negative predictive value 90.4%, positive likelihood ratio 3.9, negative likelihood ratio 0.9, and area under the ROC curve 0.59. A similar continuous relationship of prevalent retinopathy with glycosylated haemoglobin, with no evidence of a threshold from change point models, was observed in the MESA (Figure 3B). Finally, we examined the relationship between 2hPG and retinopathy in the AusDiab study. The performance of an 11.1 mmol/l 2hPG cut-off in identifying prevalent retinopathy in this population was poorer than for FPG, with sensitivity 24.8%, specificity 81.1%, positive predictive value 8.9%, negative predictive value 93.5%, positive likelihood ratio 1.3, negative likelihood ratio 0.9 and area under the ROC curve of 0.54 (data not shown).
Figure 3.
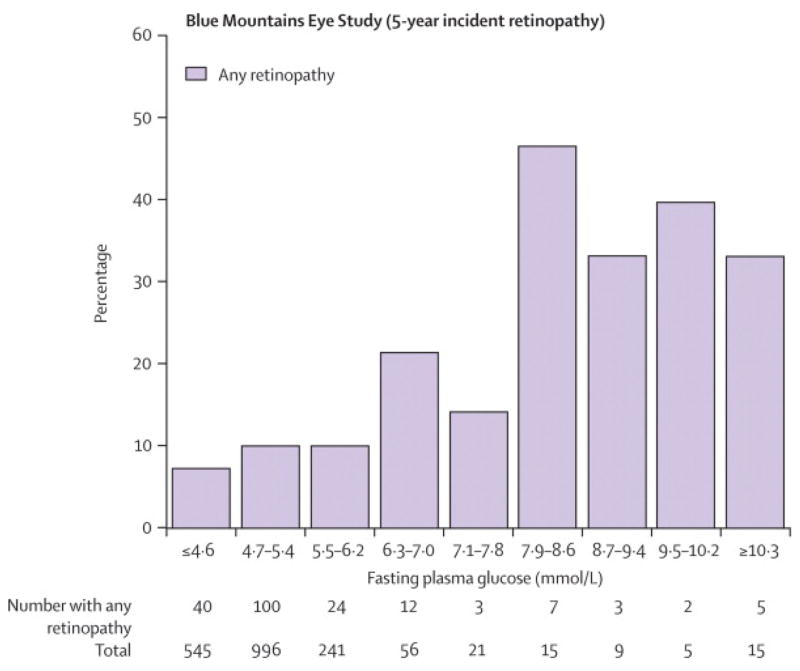
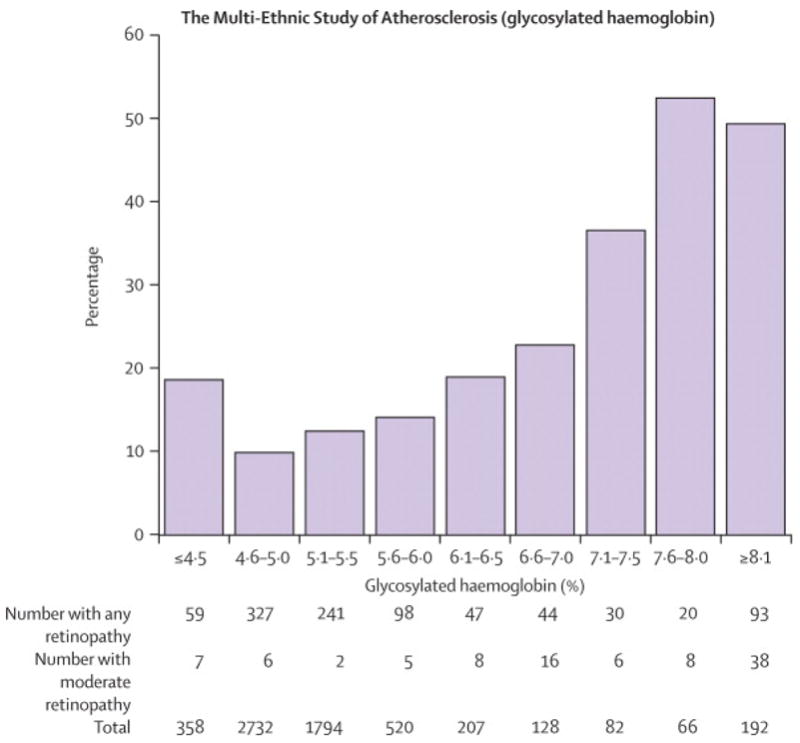
Relationship between Baseline Fasting Plasma Glucose and Incident Retinopathy, the Blue Mountains Eye Study; Relationship between Glycosylated Haemoglobin and Retinopathy, the Multi-Ethnic Study of Atherosclerosis. To convert from mmol/l to mg/dl, multiply by 18.
DISCUSSION
The current WHO(3) and ADA(4) criteria to diagnose diabetes are centered on the key assumption that a distinct glycaemic threshold exists which accurately separates persons at high and low risk of microvascular complications, specifically retinopathy signs typical of diabetes. The basis for this assumption is data from three early population studies that found a consistent FPG glycaemic threshold at 7.0 mmol/l that had high sensitivity and specificity for identifying retinopathy. However, these earlier studies had limited precision for detecting retinopathy signs.
Our study highlights several important findings. First, we found little evidence of a clear glycaemic threshold for retinopathy that is consistent across populations, in contrast to the findings of the three previous studies on which the current diabetes diagnostic criteria are based. (6–8) Our results show a more gradual increase of retinopathy prevalence with FPG, and strongly suggest a continuous relationship. It is possible our findings differ from the three previous studies because they were only able to detect more severe retinopathy. However, in an analysis of moderate retinopathy, we also did not find any clearer evidence of a glycaemic threshold, with the data again suggesting a continuous relationship. These results of FPG and retinopathy are therefore consistent with observations that the relationship of glucose and macrovascular complications such as cardiovascular disease is continuous with no threshold (26–29), and is analogous to the continuous relationship of end-organ damage found with other cardiovascular risk factors such as blood pressure and serum cholesterol levels.
A second major finding from our work is the poor performance of current and past cut-offs used to diagnose diabetes at separating persons with and without retinopathy. This is largely a consequence of the much higher prevalence of retinopathy at “low” or “normal” levels of FPG than reported in the three previous studies, despite using the same or similar definitions of retinopathy. These earlier studies suggested that retinopathy is uncommon (2–4%,(6–8)) at FPG levels below 5.6mmol/l. Using retinal photographs of multiple fields, which permit a larger area of the retina to be assessed, we now show that retinopathy signs occur in 7–13% of the population below this FPG level, indicating that earlier studies had underestimated retinopathy prevalence by two to five-fold. This underestimate of retinopathy at low glucose levels likely inflated the sensitivity of the FPG cut-offs used to diagnose diabetes that were derived from the previous studies. At a 7.0 mmol/l FPG cut-off, we observed sensitivities of less than 40% as compared to greater than 80% from the earlier studies in Pima Indians(6) and Egyptians.(7). We further report a smaller area under the ROC curve for FPG and retinopathy (less than 0.60) as compared to previous reports (e.g., 0.85 in Egyptians(7)).
In the BMES, we also demonstrated that FPG performed poorly at predicting incident retinopathy after 5 years, with most incident retinopathy cases occurring in persons with FPG below the 7.0 mmol/l cut-off. This contrasts to the previous study in Pima Indians(6) which showed little incident retinopathy below the 7.0mmol/l cut-off, but is consistent with newer studies in which retinopathy was detected from retinal photographs, showing that numerically more incident retinopathy lesions occur in persons below this cut-off than above it.(30;31)
New data from the Diabetes Prevention Program(12) and other studies(32;33) support our findings of higher prevalence of retinopathy at “low” and “normal” FPG. In fact, there is now evidence that retinopathy signs in these persons is only weakly related to hyperglycemia,(34;35) and is likely the result of other vascular processes such as hypertension,(14) rather than being specific to hyperglycemia. It is possible that more advanced retinopathy lesions may be more strongly related to hyperglycaemia (e.g., neovascularisation), suggesting that examining the relationship of these lesions to FPG may be more useful in deriving diagnostic thresholds for diabetes. We are planning a meta-analysis of these as well as additional studies that will provide greater power to examine the relationship of more severe, but less common, retinopathy outcomes to FPG. A glycemic threshold with these clinically significant outcomes will clearly be highly relevant. Examining the relationship of glucose to other diabetic complications (e.g., nephropathy) may also provide alternative approaches to deriving diagnostic thresholds. If no threshold were found, then an appropriate pragmatic means of setting a diagnostic cut-point would involve identifying a blood glucose level below which the likelihood of missing people at high risk of clinically significant diabetic complications was acceptably small.
The proportion of retinopathy in “non-diabetic” (<7.0 mmol/l) persons in our populations ranged from 7.4–13.4%. This range of retinopathy prevalence is likely due to different population age and race structures, different distribution of hypertension and other vascular diseases, different numbers of retinal photographs taken, as well as the short-term variability in FPG measurements that may cause variation in prevalence estimates.(36) After adjusting for age, race and hypertension, these differences in retinopathy prevalence were not statistically significant. Regardless of the source of this variability, our study does not support the existence of a clear glycemic FPG threshold and highlights the considerable prevalence of retinopathy that can exist in the absence of hyperglycaemia.
Strengths of this study include the use of three large population-based cohorts in diverse communities, multiple field retinal photographs to define retinopathy signs, and new subgroup analyses (incident retinopathy, 2hPG and glycosylated haemoglobin) that support the conclusions of our main analyses. In particular the use of standardised retinopathy grading using the same gold standard protocols as in clinical trials supports the validity of our findings. Our study had limitations, which we note also apply to the three previous studies on which the current diagnostic criteria for diabetes are based. First, selection biases may have influenced our findings, as there were participants who had ungradable retinal photographs and were excluded from analysis. However, persons with ungradable photographs in all three studies were older (by 10 years in BMES and AusDiab and 5 years in the MESA), but were similar in gender, FPG and hypertension status compared to persons with gradable photos. Second, in our main analysis, we included persons with diabetes who were taking diabetic medications to maintain the population-based nature of the three study populations and to replicate the methods of the previous studies.(6–8) As diabetic medications lower plasma glucose, this may partly explain the higher prevalence of retinopathy at low FPG. Excluding persons taking diabetic medications or those on diet control resulted in considerably worse performance of FPG at discriminating retinopathy, arguing against this possible bias. Third, the use of FPG may miss some persons with diabetes. However, our analyses of 2hPG in AusDiab and glycosylated haemoglobin in MESA also did not demonstrate any clear evidence of a glycaemic threshold with retinopathy.
In conclusion, the current diagnostic criteria for diabetes are based on the assumption of a glycemic threshold with retinopathy, which is the only diabetic complication believed to show a strong threshold effect. We now provide new data in three contemporary populations on the relationship of FPG to both prevalent and incident retinopathy, ascertained accurately from multiple field retinal photographs. We found no uniform FPG glycemic threshold for retinopathy across different populations and poor performance of current FPG cut-offs in separating individuals with and without retinopathy, largely due to the much higher prevalence of retinopathy at low FPG levels than previous studies reported. These findings help unify the understanding of the risk of complications from diabetes, suggesting that both macrovascular and microvascular complications do not appear to respect a glycaemic threshold. These findings further question the validity of the current WHO and ADA approach of using retinopathy to derive FPG thresholds for diagnosing diabetes, and point to the need to revisit current diagnostic criteria for diabetes.
Acknowledgments
FUNDING
The Blue Mountains Eye Study is supported by the Australian National Health & Medical Research Council, Canberra Australia (NHMRC Grant No:153948, 302068, 211069)
The Multi-Ethnic Study of Atherosclerosis study is supported by contracts N01-HC-95159 through N01-HC-95165 and N01-HC-95169 from the National Heart, Lung, and Blood Institute. Additional support was provided by NIH grant HL69979-03 (Klein R and Wong TY).
The AusDiab study is supported by an Australian National Health & Medical Research Council, Canberra Australia (NHMRC Grant 233200), and in-kind support from the Australian Institute of Health and Welfare who provided the mortality data. In addition the AusDiab study has received financial and in-kind support from the Australian Government Department of Health and Ageing, Abbott Australasia, Alphapharm, AstraZeneca, Aventis Pharma, Bio-Rad Laboratories, Bristol-Myers Squibb, City Health Centre Diabetes Service Canberra, Department of Health and Community Services Northern Territory, Department of Health and Human Services Tasmania, Department of Health New South Wales, Department of Health Western Australia, Department of Human Services South Australia, Department of Human Services Victoria, Diabetes Australia, Diabetes Australia Northern Territory, Eli Lilly Australia, Estate of the Late Edward Wilson, GlaxoSmithKline, Highpoint Shopping Centre, Jack Brockhoff Foundation, Janssen-Cilag, Kidney Health Australia, Marian & EH Flack Trust, Menzies Research Institute, Merck Sharp & Dohme, Multiplex, Novartis Pharmaceuticals, Novo Nordisk Pharmaceuticals, Pfizer Pty Ltd, Pratt Foundation, Queensland Health, Roche Diagnostics Australia, Royal Prince Alfred Hospital Sydney and Sanofi-Synthelabo.
The authors thank the other investigators, the staff, and the participants of the Blue Mountains Eye Study, the AusDiab Study and the MESA study for their valuable contributions.
Footnotes
Conflict of interest statement
Wong had full access to all the data in the study and has final responsibility for the decision to submit the manuscript for publication. All authors state that they have no conflicts of interest.
Publisher's Disclaimer: This is a PDF file of an unedited manuscript that has been accepted for publication. As a service to our customers we are providing this early version of the manuscript. The manuscript will undergo copyediting, typesetting, and review of the resulting proof before it is published in its final citable form. Please note that during the production process errors may be discovered which could affect the content, and all legal disclaimers that apply to the journal pertain.
References
- 1.Sicree R, Shaw J, Zimmet P. The Global Burden. Diabetes and Impaired Glucose Tolerance. Prevalence and Projections. In: Gan D, editor. Diabetes Atlas. 3. Brussels: International Diabetes Federation; 2006. pp. 16–103. [Google Scholar]
- 2.Lefebvre P, Silink M. Diabetes fights for recognition. Lancet. 2006 November 11;368(9548):1625–6. doi: 10.1016/S0140-6736(06)69671-2. [DOI] [PubMed] [Google Scholar]
- 3.World Health Organization. Definition and diagnosis of diabetes mellitus and intermediate hyperglycemia. 2007 Available from URL: http://www.who.int/diabetes/publications/Definition%20and%20diagnosis%20of%20diabetes_new.pdf.
- 4.American Diabetes Association. All about diabetes. Available from URL: http://www.diabetes.org/about#diabetes.jsp.
- 5.Arky RA. Doctor, is my sugar normal? N Engl J Med. 2005 October 6;353(14):1511–3. doi: 10.1056/NEJM2e058204. [DOI] [PubMed] [Google Scholar]
- 6.McCance DR, Hanson RL, Charles MA, Jacobsson LT, Pettitt DJ, Bennett PH, et al. Comparison of tests for glycated haemoglobin and fasting and two hour plasma glucose concentrations as diagnostic methods for diabetes. BMJ. 1994 May 21;308(6940):1323–8. doi: 10.1136/bmj.308.6940.1323. [DOI] [PMC free article] [PubMed] [Google Scholar]
- 7.Engelgau MM, Thompson TJ, Herman WH, Boyle JP, Aubert RE, Kenny SJ, et al. Comparison of fasting and 2-hour glucose and HbA1c levels for diagnosing diabetes. Diagnostic criteria and performance revisited. Diabetes Care. 1997 May;20(5):785–91. doi: 10.2337/diacare.20.5.785. [DOI] [PubMed] [Google Scholar]
- 8.Report of the Expert Committee on the Diagnosis and Classification of Diabetes Mellitus. Diabetes Care. 1997 July;20(7):1183–97. doi: 10.2337/diacare.20.7.1183. [DOI] [PubMed] [Google Scholar]
- 9.Report of the expert committee on the diagnosis and classification of diabetes mellitus. Diabetes Care. 2003 January;26(Suppl 1):S5–20. doi: 10.2337/diacare.26.2007.s5. [DOI] [PubMed] [Google Scholar]
- 10.Diabetes Control and Complications Trial Research Group. Progression of retinopathy with intensive versus conventional treatment in the Diabetes Control and Complications Trial. Ophthalmology. 1995;102(4):647–61. doi: 10.1016/s0161-6420(95)30973-6. [DOI] [PubMed] [Google Scholar]
- 11.UK Prospective Diabetes Study (UKPDS) Group. Intensive blood-glucose control with sulphonylureas or insulin compared with conventional treatment and risk of complications in patients with type 2 diabetes (UKPDS 33) Lancet. 1998;352(9131):837–53. [PubMed] [Google Scholar]
- 12.The prevalence of retinopathy in impaired glucose tolerance and recent-onset diabetes in the Diabetes Prevention Program. Diabet Med. 2007 February;24(2):137–44. doi: 10.1111/j.1464-5491.2007.02043.x. [DOI] [PMC free article] [PubMed] [Google Scholar]
- 13.Cumming RG, Mitchell P, Leeder SR. Use of inhaled corticosteroids and the risk of cataracts. N Engl J Med. 1997;337(1):8–14. doi: 10.1056/NEJM199707033370102. [DOI] [PubMed] [Google Scholar]
- 14.Yu T, Mitchell P, Berry G, Li W, Wang JJ. Retinopathy in older persons without diabetes and its relationship to hypertension. Arch Ophthalmol. 1998;116(1):83–9. doi: 10.1001/archopht.116.1.83. [DOI] [PubMed] [Google Scholar]
- 15.Mitchell P, Smith W, Wang JJ, Attebo K. Prevalence of diabetic retinopathy in an older community. The Blue Mountains Eye Study. Ophthalmology. 1998;105(3):406–11. doi: 10.1016/S0161-6420(98)93019-6. [DOI] [PubMed] [Google Scholar]
- 16.Dunstan DW, Zimmet PZ, Welborn TA, Cameron AJ, Shaw J, De Court, et al. The Australian Diabetes, Obesity and Lifestyle Study (AusDiab)–methods and response rates. Diabetes Res Clin Pract. 2002 August;57(2):119–29. doi: 10.1016/s0168-8227(02)00025-6. [DOI] [PubMed] [Google Scholar]
- 17.Tapp RJ, Zimmet PZ, Harper CA, De Court, McCarty DJ, Balkau B, et al. Diagnostic thresholds for diabetes: The association of retinopathy and albuminuria with glycaemia. Diabetes Res Clin Pract. 2006 April 24; doi: 10.1016/j.diabres.2006.02.008. [DOI] [PubMed] [Google Scholar]
- 18.Wong TY, Klein R, Islam FM, Cotch MF, Folsom AR, Klein BE, et al. Diabetic retinopathy in a multi-ethnic cohort in the United States. Am J Ophthalmol. 2006 March;141(3):446–55. doi: 10.1016/j.ajo.2005.08.063. [DOI] [PMC free article] [PubMed] [Google Scholar]
- 19.Bild DE, Bluemke DA, Burke GL, Detrano R, Diez Roux AV, Folsom AR, et al. Multi-ethnic study of atherosclerosis: objectives and design. Am J Epidemiol. 2002 November 1;156(9):871–81. doi: 10.1093/aje/kwf113. [DOI] [PubMed] [Google Scholar]
- 20.2003 World Health Organization (WHO)/International Society of Hypertension (ISH) statement on management of hypertension. J Hypertens. 2003 November;21(11):1983–92. doi: 10.1097/00004872-200311000-00002. [DOI] [PubMed] [Google Scholar]
- 21.Klein R, Klein BE, Magli YL, Brothers RJ, Meuer SM, Moss SE, et al. An alternative method of grading diabetic retinopathy. Ophthalmology. 1986;93(9):1183–7. doi: 10.1016/s0161-6420(86)33606-6. [DOI] [PubMed] [Google Scholar]
- 22.ETDRS Coordinating Center UoMDoEaPM. Early Treatment Diabetic Retinopathy Study (ETDRS) Manual of Operation. Springfield, VA 22161: National Technical Information Service. (Accession Number #PB85223006); 1980. [Google Scholar]
- 23.ETDRS report number 10. Early Treatment Diabetic Retinopathy Study Research Group. Grading diabetic retinopathy from stereoscopic color fundus photographs–an extension of the modified Airlie House classification. Ophthalmology. 1991 May;98(5 Suppl):786–806. [PubMed] [Google Scholar]
- 24.American Academy of Ophthalmology and International Clinical Diabetic Retinopathy Disease Severity Scale. American Academy of Ophthalmologists. 2007 Available from URL: http://www.aao.org/education/statements/recommendations/international_dr.cfm.
- 25.Ulm K. A statistical method for assessing a threshold in epidemiological studies. Stat Med. 1991 March;10(3):341–9. doi: 10.1002/sim.4780100306. [DOI] [PubMed] [Google Scholar]
- 26.Gerstein HC, Yusuf S. Dysglycaemia and risk of cardiovascular disease. Lancet. 1996 April 6;347(9006):949–50. doi: 10.1016/s0140-6736(96)91420-8. [DOI] [PubMed] [Google Scholar]
- 27.Balkau B, Bertrais S, Ducimetiere P, Eschwege E. Is there a glycemic threshold for mortality risk? Diabetes Care. 1999 May;22(5):696–9. doi: 10.2337/diacare.22.5.696. [DOI] [PubMed] [Google Scholar]
- 28.The absence of a glycemic threshold for the development of long-term complications: the perspective of the Diabetes Control and Complications Trial. Diabetes. 1996 October;45(10):1289–98. [PubMed] [Google Scholar]
- 29.Shaw JE, Zimmet PZ, Hodge AM, De Court, Dowse GK, Chitson P, et al. Impaired fasting glucose: how low should it go? Diabetes Care. 2000 January;23(1):34–9. doi: 10.2337/diacare.23.1.34. [DOI] [PubMed] [Google Scholar]
- 30.van Leiden HA, Dekker JM, Moll AC, Nijpels G, Heine RJ, Bouter LM, et al. Risk factors for incident retinopathy in a diabetic and nondiabetic population: the Hoorn study. Arch Ophthalmol. 2003 February;121(2):245–51. doi: 10.1001/archopht.121.2.245. [DOI] [PubMed] [Google Scholar]
- 31.Ito C, Maeda R, Ishida S, Harada H, Inoue N, Sasaki H. Importance of OGTT for diagnosing diabetes mellitus based on prevalence and incidence of retinopathy. Diabetes Res Clin Pract. 2000 August;49(2–3):181–6. doi: 10.1016/s0168-8227(00)00156-x. [DOI] [PubMed] [Google Scholar]
- 32.Klein R, Klein BE, Moss SE, Wang Q. Hypertension and retinopathy, arteriolar narrowing, and arteriovenous nicking in a population. Arch Ophthalmol. 1994 January;112(1):92–8. doi: 10.1001/archopht.1994.01090130102026. [DOI] [PubMed] [Google Scholar]
- 33.Kawasaki R, Wang JJ, Rochtchina E, Taylor B, Wong TY, Tominaga M, et al. Cardiovascular risk factors and retinal microvascular signs in an adult Japanese population: the Funagata Study. Ophthalmology. 2006 August;113(8):1378–84. doi: 10.1016/j.ophtha.2006.02.052. [DOI] [PubMed] [Google Scholar]
- 34.Wong TY, Mohamed Q, Klein R, Couper DJ. Do retinopathy signs in non-diabetic individuals predict the subsequent risk of diabetes? Br J Ophthalmol. 2006 March;90(3):301–3. doi: 10.1136/bjo.2005.084400. [DOI] [PMC free article] [PubMed] [Google Scholar]
- 35.Klein R, Klein BEK, Moss S, Wong TY. The relationship of retinopathy in persons without diabetes to the fifteen year incidence of diabetes and hypertension: the Beaver Dam Eye Study. Transactions of the American Ophthalmological Society. 2006 January 1;104:98–107. [PMC free article] [PubMed] [Google Scholar]
- 36.Selvin E, Crainiceanu CM, Brancati FL, Coresh J. Short-term Variability in Measures of Glycemia and Implications for the Classification of Diabetes. Archives of Internal Medicine. 2007 July 23;167(14):1545–51. doi: 10.1001/archinte.167.14.1545. [DOI] [PubMed] [Google Scholar]