

Abstract
A multimodal nonlinear optical imaging system that integrates coherent anti-Stokes Raman scattering (CARS), sum-frequency generation (SFG), and two-photon excitation fluorescence (TPEF) on the same platform was developed and applied to visualize single cells and extracellular matrix in fresh carotid arteries. CARS signals arising from CH2-rich membranes allowed visualization of endothelial cells and smooth muscle cells of the arterial wall. Additionally, CARS microscopy allowed vibrational imaging of elastin and collagen fibrils which are also rich in CH2 bonds. The extracellular matrix organization were further confirmed by TPEF signals arising from elastin’s autofluorescence and SFG signals arising from collagen fibrils’ non-centrosymmetric structure. Label-free imaging of significant components of arterial tissues suggests the potential application of multimodal nonlinear optical microscopy to monitor onset and progression of arterial diseases.
Keywords: Carotid artery, coherent anti-Stoke Raman scattering, collagen fibrils, elastin, endothelial cells, extracellular matrix, label-free imaging, nonlinear optical microscopy, smooth muscle cells, sum frequency generation, two-photon excitation fluorescence
1. Introduction
With intrinsic 3D resolution and relatively large penetration depth, nonlinear optical (NLO) microscopy has opened up a new avenue to tissues imaging [1]. First demonstrated in 1990 [2], two-photon excited fluorescence (TPEF) microscopy has been extensively applied to biological imaging by utilizing intrinsic fluorescence or extrinsic labeling of bio-molecular structures [3]. Being sensitive to non-centrosymmetric structures [4], second harmonic generation (SHG) imaging was first demonstrated in 1970s [5]. Both SHG and electronic sum-frequency generation (SFG) have been utilized for imaging biological samples such as membranes [6] and protein fibrils [7–9]. TPEF and SHG were simultaneously generated by a single femtosecond laser in many tissue imaging studies [10–12]. In addition to these methods, a third-order NLO microscopy based on coherent anti-stokes Raman scattering (CARS) allows chemically selective imaging [13]. In CARS microscopy, a pump beam at ωp and a Stokes beam at ωs are ollinearly combined and tightly focused into a sample. CARS signal can be significantly enhanced by tuning ωp–ωs to a Raman-active vibration band, thus providing chemical selectivity. Although CARS microscopy was first experimentally reported in 1982 [14], its robust potential for biological research was not realized until its revival in 1999 [15]. Significant technical advances including integration of near-IR picosecond pulse excitation [16], collinear beam geometry [15], epi-detection [16,17], and laser scanning [18] have produced a new generation of CARS microscope with high sensitivity, sub-micron 3D spatial resolution, and high acquisition speed [13]. CARS microscopy has demonstrated the capability for label-free imaging of a wide range of bio-molecular structures including single lipid bilayers [19–21], myelin sheath in nervous systems [22,23], native drug molecules [24], tumor cells and adipose tissues [25], and skin [26].
With cardiovascular diseases becoming a prevalent malady in both developed and developing countries [27,28], there is a strong demand for technologies that allow high-resolution imaging of arterial components in the ex vivo and in vivo conditions. In general, an elastic artery, such as carotid artery or iliac artery, comprises three layers (Fig. 1). The innermost layer is tunica intima which consists of endothelial cells and an internal elastic lamina. The intermediate layer is tunica media which consists of smooth muscle cells, collagen fibrils, and elastin lamellas. The outermost layer is adventitia which consists of collagen and elastin fibrils. In recent years, TPEF and SHG microscopy has been applied to vascular imaging. Being sensitive to non-centrosymmetric structures, SHG microscopy has been applied to visualize collagen fibrils of the arterial wall [11,29]. Relying on intrinsic autofluorescence, TPEF microscopy has been applied to visualize elastin fibers [11,30,31]. Moreover, TPEF microscopy has been used to image fluorescently labeled endothelial cells, smooth muscle cells, and macrophages [32]. However, imaging arterial components with fluorescent labels faces tremendous technical challenges including non-specific binding and inefficient diffusion into arterial wall. It is known that endothelial cells and smooth muscle cells play leading roles in normal arterial function [33–35] as well as in arterial disease onset [36–38]. Therefore, label-free visualization of endothelial cells and smooth muscle cells would be crucial for investigating the early stages of cardiovascular diseases.
Figure 1.
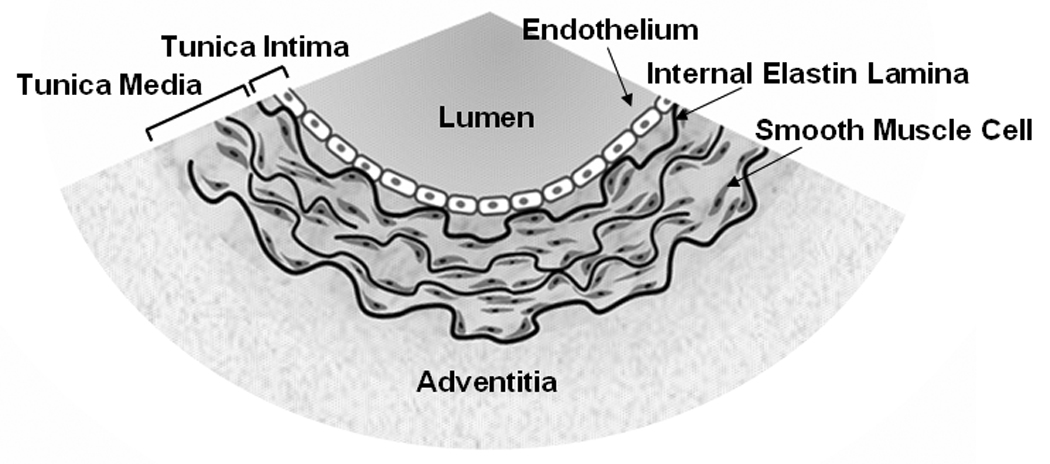
Cross-sectional redition of an artery. An arterial wall consists of three layers, tunica intima, tunica media, and adventitia. Tunica intima consists of an endothelium and an internal elastic lamina. Tunica media consists of smooth muscle cells, elastin lamellas, and collagen fibrils (not shown). Adventitia consists mainly of collagen and elastin fibrils.
In this paper, we demonstrate label-free visualization of significant arterial components using a microscope that integrated CARS, SFG, and TPEF imaging modalities on the same platform. Spectrally resolved CARS, SFG, and TPEF signals were generated simultaneously from the same arterial sample by two synchronized picosecond lasers. We show that CARS imaging based on the CH2 vibrations allowed visualization of endothelial cells, smooth muscle cells, elastin, and collagen fibrils of the arterial wall. CARS images were further confirmed by TPEF and SFG signals. The demonstrated label-free imaging capability of multimodal NLO microscopy suggests its potential application to the studies of arterial functions and cardiovascular diseases.
2. Experimental Method and Materials
Nonlinear optical imaging system
CARS, TPEF, and SFG imaging were integrated into the same microscope via the multimodal system shown in Fig. 2. Two mode-locked 5-ps Ti:sapphire lasers (Tsunami, Spectra-Physics, Mountain View, CA) were synchronized to each other (one as master and the other as slave) through an electronic module controller (Lok-to-Clock, Spectra-Physics). The two parallel-polarized laser beams were collinearly combined and sent into a laser scanning confocal microscope (FV300/IX71, Olympus America, Center Valley, PA). Wavelengths of the master and slave lasers, measured by a wavemeter (WA-1100, Burleigh), were tunable from 690 to 810 nm and from 690 to 1025 nm, respectively.
Figure 2.
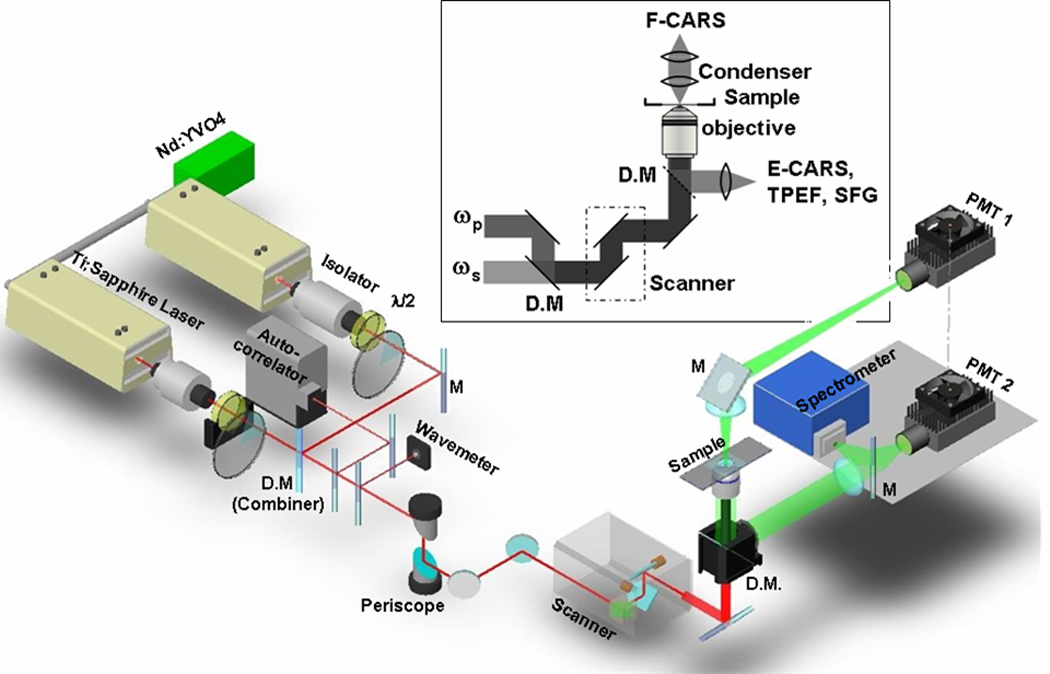
Schematic diagram of a multimodal NLO microscope for forward-detected CARS (F-CARS), epi-detected CARS (E-CARS), TPEF, and SFG imaging. Two 5-ps lasers were collinearly combined, synchronized, and tightly focused into a sample. F-CARS signals were collected by an air condenser and detected by PMT1. E-CARS, TPEF, and SFG signals were collected by the objective and detected by PMT2. A spectrometer installed at the back port can be externally triggered by the confocal scanner for micro-spectral analysis with single pixel resolution.
A 60x water immersion objective with a 1.2 NA (numerical aperture) and a 20x air objective with a 0.75 NA were used to focus the laser beams for imaging the sagittal-section and transection artery samples, respectively. Using neutral-density filter wheels, the average powers of the master and slave beams were attenuated to 40 mW and 20 mW at the sample. Two external photomultiplier tube (PMT, H7422-40, Hamamatsu, Japan) detectors were installed for receiving signals in both forward and backward (epi-) directions (PMT1 and PMT2 in Fig. 2). The epi-detected NLO signals were collected by the objective, while the forward CARS signal was collected by using a 0.55 NA condenser.
The mechanisms of forward and backward CARS have been thoroughly studied. For a thin sample, the forward-detected CARS (F-CARS) signal is mainly contributed by large objects and the bulk medium, while the epi-detected CARS (E-CARS) signal is generated from objects in small size compared to excitation wavelengths and from the interface between a sizable scatterer and its surrounding medium [18]. For a thick and turbid biological tissue such as the skin, it was shown that forward CARS can be highly scattered and received in epi-channel [26]. In our case, the E-CARS and F-CARS contrast were found to be identical (data not shown), indicating that the E-CARS signal was mainly contributed by back-scattering of forward CARS by the artery wall. This mechanism provides the viability of E-CARS imaging in a thick and turbid tissue for which the scattering may effectively attenuate the F-CARS signal. In our experiments, the epi-channel was used when only CARS images were acquired. Because the forward channel is not sensitive to TPEF or SFG, we used F-CARS for colocalization study of the CARS contrast with the epi-detected SFG or TPEF contrast and for simultaneous visualization of different structures.
For CARS imaging, the master laser beam was tuned to ~14140 cm−1 (ωp) and the slave laser beam was tuned to ~11300 cm−1 (ωs), generating a frequency difference of ~2840 cm−1 that matches the symmetric CH2 stretch vibration [13,22]. The power of the master and slave lasers at the sample was 40 mW and 20 mW, respectively. A bandpass filters (600/65 nm, Ealing Catalog, Rocklin, CA) were used to transmit the CARS signal around 588 nm.
The two 5-ps laser beams were also utilized for SFG imaging at the same wavelengths used for CARS imaging. Backward SFG signal around 393 nm was collected by the objective, transmitted through two bandpass filters (HQ375/50m-2p, Chroma) and probed by PMT2 at the back port of the microscope. For TPEF imaging of elastin and FITC-IB4, two bandpass filters (hp520/40m-2p, Chroma) were used to transmit the green fluorescence signal. For TPEF imaging of doxorubicin labeled sample, 600/65 nm filters were used for a better coverage of its emission spectrum. TPEF images of labeled tissues were acquired by using the master laser at the same excitation wavelength (~707 nm) used for CARS imaging.
Microspectroscopy analysis of arterial components was carried out by using a spectrometer (Sharmrock 303i, Andor Technology, Belfast, Ireland) equipped with an electron multiplying charge-coupled device (EM-CCD, Newton-970N-BV, Andor), installed at the back port of the microscope, and externally triggered by the confocal scanner. In this method, an image was first acquired. The lasers were then focused into a pixel of interest by using the point-scan mode. The point-scan action triggered the spectrometer to record a spectrum of the NLO signals arising from the focal region.
CARS spectra were obtained from a series of CARS images taken at the same region. The wavenumber of the master laser was fixed, and the slave laser was tuned to generate different Raman shifts that cover the whole vibrational band. The CARS intensity at each Raman shift was normalized by the nonresonant CARS signal generated from glass at the same Raman shift.
Sample preparation
Fresh carotid arteries were isolated from 3-month-old healthy Yorkshire pigs weighted between 25 kg to 35 kg. The samples were harvested within 30 minutes after the animals were sacrificed, and kept in 0.8 % saline immediately. After rinsing with phosphate-buffered saline to wash out the blood, the samples were placed in a culture medium (RPMI, Invitrogen) for further processing. For luminal and adventitial imaging, the arteries were sliced longitudinally. For cross-sectional imaging, the arteries were sliced horizontally. Ex vivo imaging of unlabeled fresh samples was carried out within 6 hrs after animal sacrificing. Excess arteries were fixed with 4 % buffered formalin and used for labeling experiments. Fluorescein isothiocyanate conjugated isolectin B4 (FITC-IB4) that selectively labels endothelial cell membrane [39] was used to verify the CARS contrast from endothelial cells. Doxorubicin, a strong DNA intercalator [40], was used to label the nuclei of smooth muscle cells.
3. Results
3.1 Endothelium
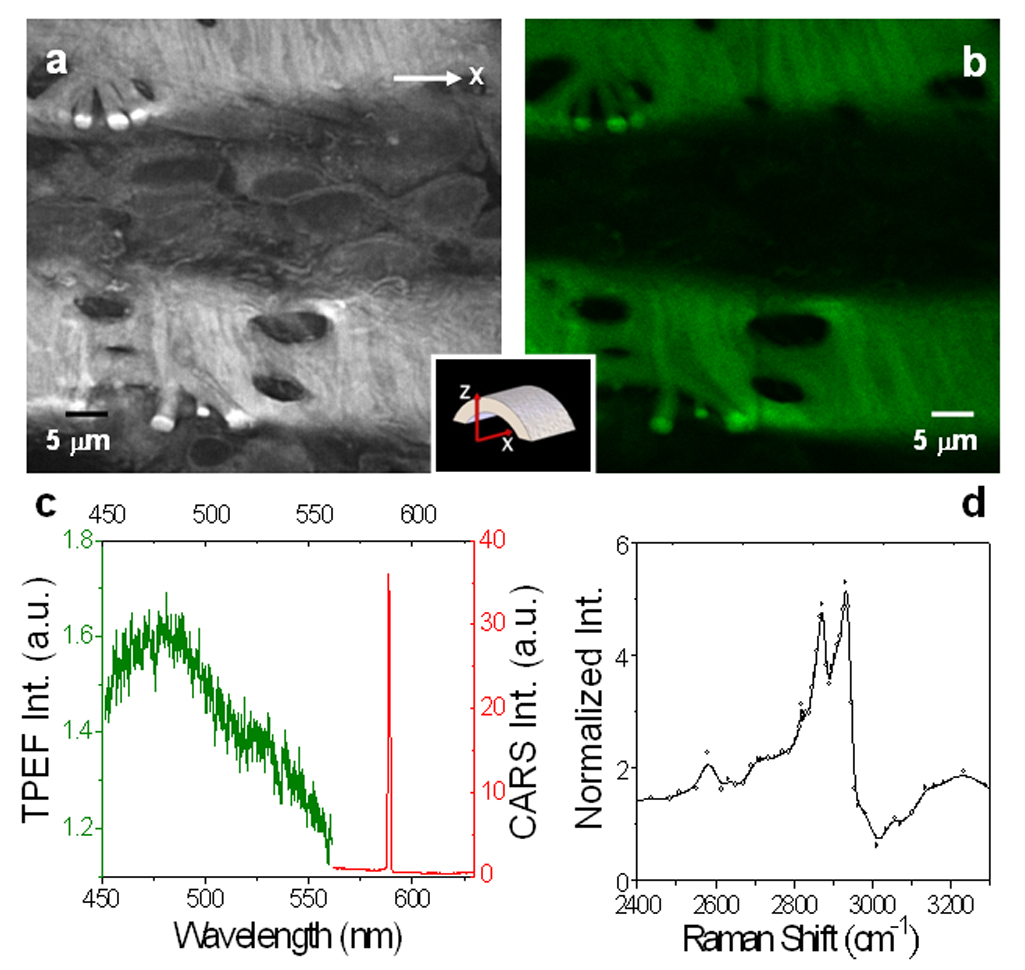
We first applied multimodal NLO microscopy to visualize the innermost layer of the artery. Freshly harvested carotid arteries were dissected longitudinally and imaged from the lumen side. By means of CARS imaging with ωp–ωs tuned to 2845 cm−1, the endothelium formed by a single layer of endothelial cells could be clearly detected (Fig. 3a). The enlarged image (Fig. 3b) clearly shows single endothelial cells and cell junctions with sub-micrometric spatial resolution. It is conceivable that CARS is capable of imaging endothelial cells due to the abundant CH2 groups in cell membrane. Microspectrometry measurement (Fig. 3c) of cell membranes showed strong CARS signals peaked around 588 nm which corresponds to 2ωp-ωs (Methods). Autofluorescence signal was undetectable in the endothelium region (Fig. 3c). To further confirm that CARS signal is indeed arisen from endothelial cells, we labeled the sample with an endothelial cell-specific marker, FITC-IB4 [39]. TPEF visualization of FITC-IB4 labeled endothelial cells (Fig. 3d) proved the capability of CARS microscopy for imaging endothelial cell membranes.
Figure 3.

CARS imaging of endothelium of ex vivo carotid artery without any labeling. (a) CARS image of unstained endothelium on the lumen surface. The white bands are the innermost surface of the undulated internal elastin lamina. (b) Zoom-in image of the red rectangular area in (a) for single cell observation. (c) Spectral profile of the NLO signal from endothelium in the 450 to 650 nm range. A sharp CARS band generated at 2ωp–ωs was located around 588 nm. Little fluorescence was detected. (d) TPEF image of the plasma membrane of endothelial cells stained with FITC-IB4.
3.2 Internal elastic membrane
At approximately 2 µm deep from the lumen, an undulated layer of internal elastic membrane emerged from both CARS (Fig. 4a) and TPEF imaging (Fig. 4b). The elastin signals from these two imaging modalities perfectly overlapped with each other. Further microspectroscopy measurements confirmed that both CARS and TPEF were generated from elastin (Fig. 4c). Spectral analysis showed strong elastin CARS signal which peaked at 588 nm and elastin TPEF emission signal which peaked around 480 nm. The distinct separation between CARS and TPEF spectra allowed both signals to be collected simultaneously through bandpass filters (Methods). The maximum emission peak of elastin from our measurement is consistent with previously reported values in the literature [29,41]. It is generally believed that intrinsic autofluorescence of elastin is attributed to the cross-linking structure of elastin fibers. Whereas, it is conceivable that CARS signals of elastin are attributed to the CH2-rich amino acid side chains of lysines, which are present predominantly at the cross-linking region [42].
Figure 4.
Imaging and micro-spectral analysis of unstained elastin in the internal elastic lamina. The lasers were focused at ~2 µm inside the lumen surface of a fresh sample. (a) F-CARS (gray) and (b) TPEF (green) image of elastin bands. (c) NLO signal spectrum of elastin. The CARS peak (red) located around 588 nm was 20 times larger than the TPEF peak around 480 nm (Green) under the same acquisition condition. (d) CARS spectrum of elastin measured by tuning the Stoke frequency from 10807 cm−1 to 11758 cm−1. The two major peaks were located at 2870 cm−1 and 2930 cm−1.
To further investigate the source of CARS signal arising from elastin, we recorded elastin CARS spectrum over a broad range of Raman shifts (Methods). Two CARS peaks at 2870 cm−1 and 2930 cm−1 were observed in the CH vibration region (Fig. 4d). These two peaks were also reported previously with FTIR spectral measurements of bovine elastin [43]. We further compared the CARS spectrum of elastin with that of lipids which has been well studied [19,20,22]. For lipid membranes, the stretching vibration bands of acyl chains CH2 groups are located between 2800 and 3000 cm−1, with the symmetric and asymmetric CH2 stretching bands peaked around 2850 and 2880 cm−1, respectively [44]. In CARS imaging of lipid bilayers, symmetric CH2 stretching band is enhanced by polarized excitation, while asymmetric stretching band is suppressed by high-frequency dip of CH2 symmetric band. Consequently, CH2 symmetric stretching band around 2845 cm−1 dominates CARS spectrum [20,22]. However, we observed no polarization dependency in CARS intensity for elastin (data not shown). While polarization dependence of CARS intensity is due to ordered orientation of CH2 groups in lipid bilayer, polarization independence of elastin is probably due to disordered orientation of CH2-rich residues in the cross-linking region. Therefore, whereas CARS intensity for lipid bilayer arises mainly from symmetric CH2 stretching band, CARS intensity for elastin probably arises from both symmetric and asymmetric CH2 stretching bands. Furthermore, the presence of carbonyl groups of the cross-linking residues of elastin [42] could cause a blue shift of the CH2 stretching vibration frequencies. With these considerations, we assigned the two peaks at 2870 cm−1 and 2930 cm−1 (Fig. 4c) to the symmetric and asymmetric CH2 stretching bands of elastin, respectively.
3.3 Tunica media
By focusing the laser beams at greater than 10 µm deep from the lumen, highly ordered rod-shape cells and stripes of elastin were observed with CARS imaging (Fig. 5a). Comparing our observation with histology, we assigned rod-shaped cells as smooth muscle cells. In addition, simultaneous SFG imaging showed strong presence of collagen fibrils around smooth muscle cells (Fig. 5b). The distribution of collagen fibrils around smooth muscle cells is in agreement with previous descriptions of tunica media structural organization [36]. To further verify our assignment, we used doxorubicin, a DNA intercalator that targets the nuclei of smooth muscle cells [45], to label a fixed artery sample. We showed that TPEF images of doxorubin-labeled nuclei were located within CARS images of smooth muscle cell membranes (Fig. 5c, d). This observation further supports our assignment of smooth muscle cells to the rod-shaped cells visualized by CARS.
Figure 5.
CARS imaging of single smooth muscle cells in the tunica media layer. (a) E-CARS image of unstained smooth muscle cells at ~10 µm inside luminal surface. The transverse white bands are attributed to elastin lamella. (b) Overlaid E-CARS and SFG image of the red rectangle area marked in (a). The SFG (blue) signal around the smooth muscle cells is attributed to the collagen-rich basement membrane. (c) F-CARS image and (d) TPEF image of smooth muscle cells located at ~12 µm from the lumen surface. The sample was labeled with doxorubicin. The green arrow indicates a single smooth muscle cell.
3.4 Adventitia
To image arterial structures within the adventitia, we focused the laser beams onto the outer surface of an artery. Examination with CARS (Fig. 6a), TPEF (Fig. 6b), and SFG (Fig. 6c) showed that adventitia comprises mainly collagen and elastin. In consistence with Fig. 3–Fig. 5, TPEF and SFG are sensitive to elastin and collagen, respectively, while the CARS image displays both structures. Microspectroscopy measurement of collagen fibrils (Fig. 6d) showed two signal peaks at 588 nm and 393 nm, which were attributed to CARS and SFG signals, respectively. The CARS spectrum of collagen is shown in Fig. 6e. Like elastin, CARS signals from collagen fibrils are most likely arisen from the stretching vibrations of CH2-rich residues in the cross-linking region [46]. Because SFG signals peak at ~393 nm, TPEF signals peak at ~480 nm, and CARS signals peak at ~588 nm, signals from all three imaging modalities can be collected through three distinctive bandpass filters. As three NLO signals were generated from the same laser source, CARS imaging of collagen and elastin could be immediately confirmed with SFG and TPEF imaging, respectively. Hence, multimodal NLO imaging should significantly improve the accuracy of detection of arterial components.
Figure 6.
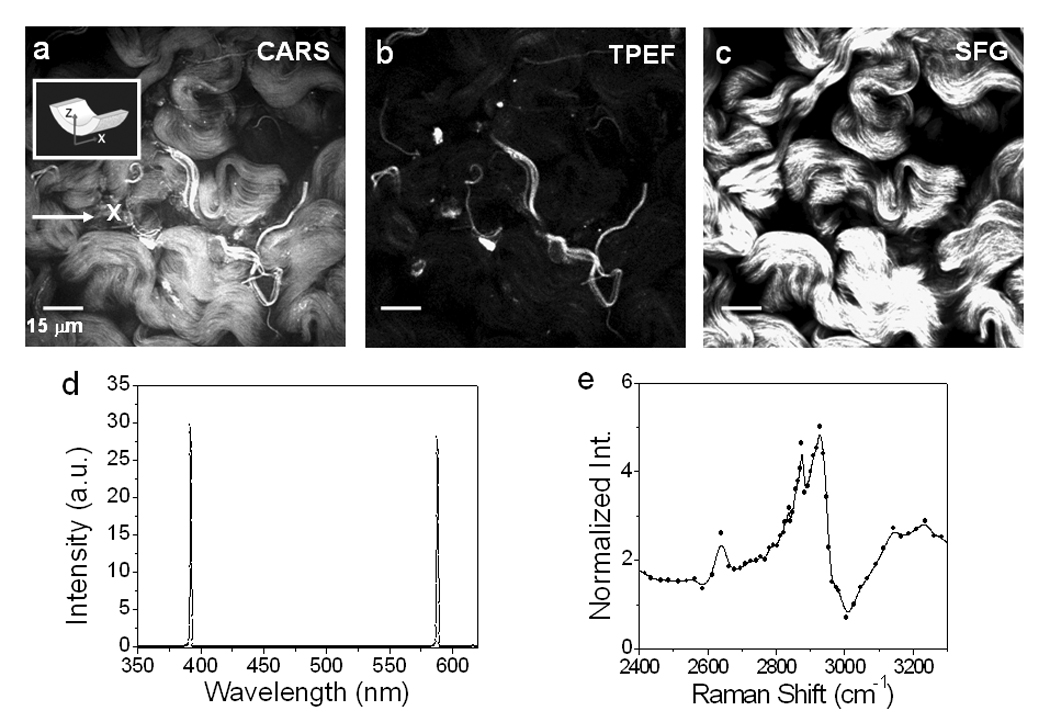
NLO imaging of adventitia. (a) CARS, (b) TPEF, (c) SFG images of adventitia in an unstained carotid artery. The lasers were focused at ~2 µm from an artery outer surface. (d) NLO signal spectrum from collagen. The two peaks at 588 nm and 393 nm were contributed by CARS and SFG, respectively. (e) CARS spectrum of collagen measured by tuning the Stoke frequency from 10823 cm−1 to 11750 cm−1. The two major peaks were located around 2875 cm−1 and 2930 cm−1.
3.5 Cross-sectional view of carotid artery
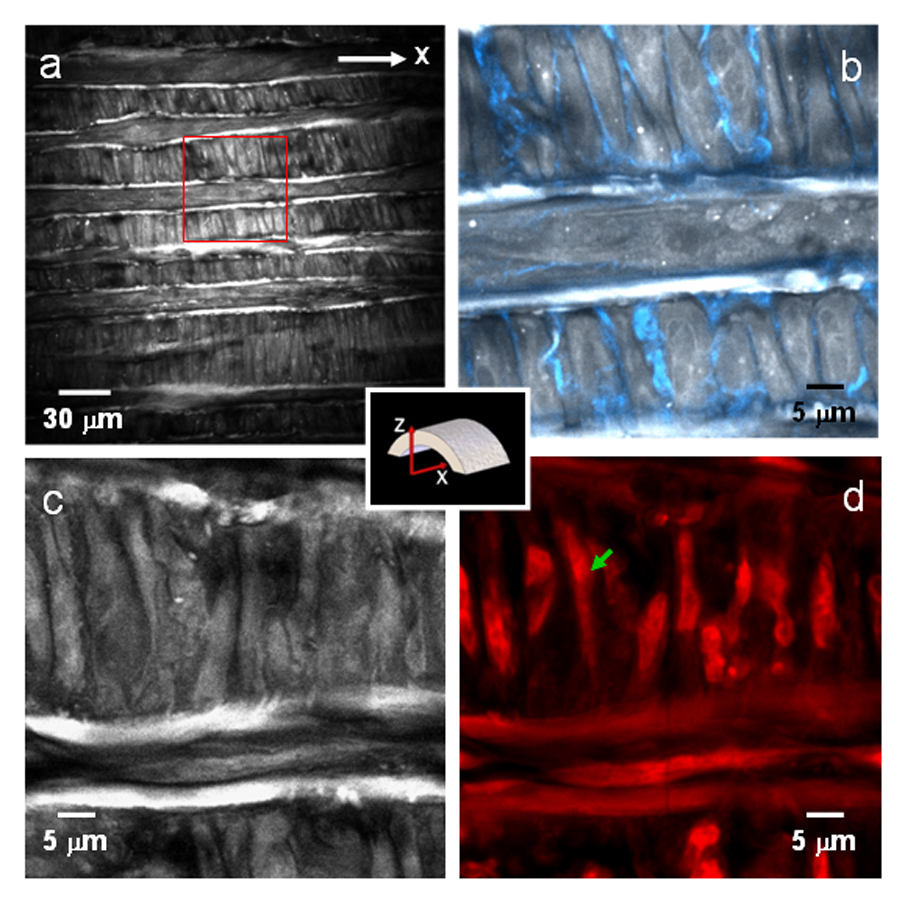
To present an entire view from lumen to adventitia of the carotid artery, we acquired multiple NLO image of the cross-section of an arterial and then stitched them together. As shown in Fig. 7, the integrated image allowed clear visualization of the distribution of collagen and elastin fibrils in arterial wall. CARS imaging by itself is sufficient to provide visualization of collagen fibrils and elastin (Fig. 7a), as confirmed by selective TPEF imaging of elastin (Fig. 7b) and SFG imaging of collagen fibrils (Fig. 7c). Within the adventitia, we found that the outer layer was rich in collagen fibrils and the inner layer was rich in elastin (Fig. 7b,c). In the tunica media, we found collagen and elastin signals entwined with one another (Fig. 7c). Although it appears that most collagen signals were in parallel with elastin (Fig. 7c), higher resolution images showed that many collagen fibrils arranged themselves along the polarity of smooth muscle cells in the direction perpendicular to elastin (Fig. 5). Taken together, we have shown that multimodal NLO imaging is a powerful imaging tool that can clearly resolve arterial composition and structural organization. Such capability should be invaluable to the evaluation of artery structural integrity or lack-there-of during the onset and progression of arterial diseases.
Figure 7.
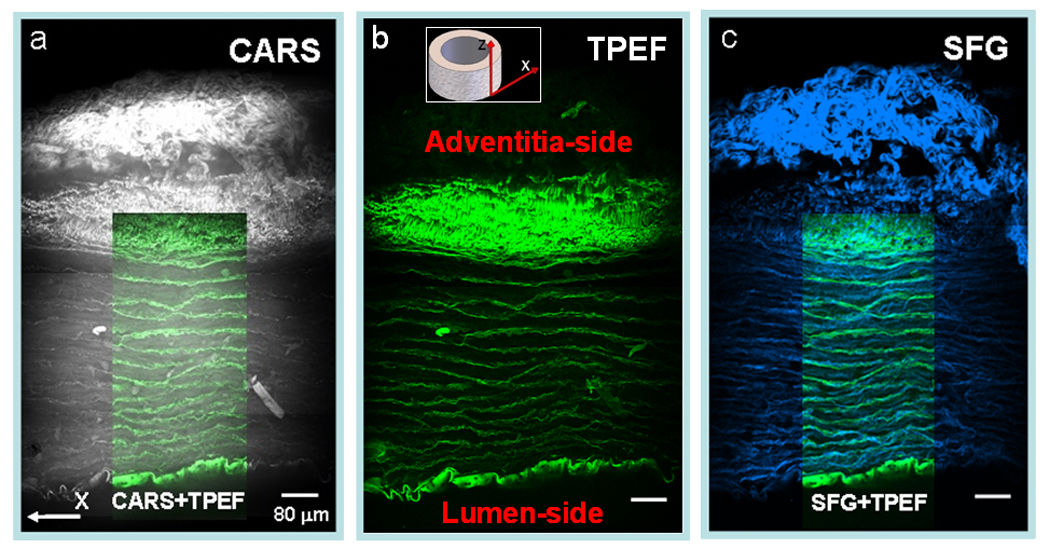
Stitched cross-sectional images of a fixed carotid artery characterized by NLO (CARS, TPEF, and SFG) imaging with a 20x objective. (a) CARS (grey) image of an entire artery cross-section. Overlaid image depicts the overlapping elastin bands viewed by CARS (grey) and TPEF (green). (b) TPEF (green) image of the artery cross-section at the same region. (c) SFG (blue) image at identical place. Overlaid image shows the organization of elastin and collagen in tunica media.
4. Discussion
Current clinical diagnosis for cardiovascular diseases utilizes several well-developed imaging techniques, such as magnetic resonance imaging, intra-vascular ultrasound, optical coherence tomography, and X-ray angiography [47–49]. While providing powerful mapping of vasculature morphology, these techniques lack both resolution and specificity to visualize vasculature composition and structural organization [47].
By utilizing two picosecond lasers, we demonstrated in this paper multimodal NLO microscopy that allows label-free visualization of individual endothelial cells and smooth muscle cells, as well as their organization with respect to elastin and collagen fibrils of the extracellular matrix. Multimodal NLO imaging has been realized by using two picosecond lasers for CARS imaging with a high resonant signal to nonresonant background ratio and an additional femtosecond laser for SHG and TPEF imaging on the same platform [50]. The use of two picosecond lasers at the 80 MHz repetition rate for CARS, SFG, and TPEF signal generation in the current work significantly lowers the system cost and complexity. In comparison with femtosecond pulse excitation, a relatively higher average power (c.a. 60 mW) at the sample was used, which compensates the relatively lower peak power associated with picosecond pulses. As a result, we have been able to produce strong SFG signals from collagen fibrils and TPEF signals from elastin and fluorescent markers. Importantly, we did not observe photodamage to the artery for the use of a higher average power. In NLO microscopy, a major source of photodamage arises from multiphoton absorption. As shown in previous work [51], because the exponent of the power law of damage is higher than that of TPEF, the signal can be larger with longer pulses at constant damaging potentials. Therefore, picosecond pulse excitation allows multimodal CARS, TPEF, SFG imaging with minimal photodamage.
As show in this work, CARS imaging allows the visualization of tightly packed endothelial membranes and of smooth muscle cells surrounded by collagen-rich basement membranes. Packing density of endothelial cells is an important feature to evaluate the integrity of arterial lumen. Similarly, organization of smooth muscle cells is a crucial feature to assess structural strength and contraction ability of arterial walls. Compromises in the organization of endothelial cells and smooth muscle cells are often observed in arterial diseases including atherogenesis, thrombosis, vasoconstriction, and hemorrhage [47,52]. Hence, label-free CARS imaging of arterial cells and their organization with respect to the extracellular matrix opens up a new avenue to functional and pathological studies of the vasculature.
Additionally, multimodal NLO imaging would be a valuable tool for the dynamic studies of arterial disease onset and progression. For example, atherosclerosis, a major arterial disease leading to heart disease and stroke, progresses through many different stages. The initial stage is characterized by the presence of injurious agent such as lipoproteins or other oxidative species. The response stage is characterized by the invasion of monocytes across the endothelial monolayer and their maturation into lipoprotein-engulfing foamy macrophages. And the lesion stage is characterized by the leaky endothelium more susceptible to monocytes infiltration, migration of smooth muscle cells into the intima, proliferation of smooth muscle cells, accumulation of extracellular lipid droplets, and development of a fibrous extracellular matrix [52]. With the demonstrated label-free visualization of endothelial cells, smooth muscle cells, elastin, and collagen fibers reported in this work and of lipid-rich foam cells reported elsewhere [50], multimodal NLO microscopy has the capacity to monitor all stages of atherogenesis. Its applications can include studying response of endothelium monolayer to injurious agents, migration of smooth muscle cells, hyperplasia of extracellular matrix, formation of fatty streaks, and even the impact of drug therapies on the regression of atherogenesis. Along with the development of NLO endoscopy [53,54], our efforts in detailing the capability of NLO technologies for ex vivo imaging of arterial composition serve as a reference for future in vivo imaging of vasculature in normal and diseased stages.
Acknowledgements
The authors would thank Mr. B. Schoenlein and M. Otlewski for their generously gifts of carotid artery samples, H. Wang and B. T. Huff for their kind help in the construction of the imaging system. This work is supported by a NIH grants R21 EB004906 and R01 EB007243.
Footnotes
Publisher's Disclaimer: This is a PDF file of an unedited manuscript that has been accepted for publication. As a service to our customers we are providing this early version of the manuscript. The manuscript will undergo copyediting, typesetting, and review of the resulting proof before it is published in its final citable form. Please note that during the production process errors may be discovered which could affect the content, and all legal disclaimers that apply to the journal pertain.
References
- 1.Helmchen F, Denk W. Nature Methods. 2005;2:932–940. doi: 10.1038/nmeth818. [DOI] [PubMed] [Google Scholar]
- 2.Denk W, Strickler JH, Webb WW. Science. 1990;248:73–76. doi: 10.1126/science.2321027. [DOI] [PubMed] [Google Scholar]
- 3.Zipfel WR, Williams RM, Webb WW. Nat. Biotech. 2003;21:1369–1377. doi: 10.1038/nbt899. [DOI] [PubMed] [Google Scholar]
- 4.Shen YR. Nature. 1989;337:519–525. [Google Scholar]
- 5.Fine S, Hansen WP. Appl. Opt. 1971;10:7081–7086. doi: 10.1364/AO.10.002350. [DOI] [PubMed] [Google Scholar]
- 6.Moreaux L, Sandre O, Mertz J. J. Opt. Soc. Am. B. 2000;17:1685–1694. [Google Scholar]
- 7.Campagnola PJ, Loew LM. Nat. Biotech. 2003;21:1356–1360. doi: 10.1038/nbt894. [DOI] [PubMed] [Google Scholar]
- 8.Williams RM, Zipfel WR, Webb WW. Biophys. J. 2005;88:1377–1386. doi: 10.1529/biophysj.104.047308. [DOI] [PMC free article] [PubMed] [Google Scholar]
- 9.Fu Y, Wang H, Shi R, Cheng JX. Biophys. J. 2007;92:3251–3259. doi: 10.1529/biophysj.106.089011. [DOI] [PMC free article] [PubMed] [Google Scholar]
- 10.Zoumi A, Yeh A, Tromberg BJ. Proc. Natl. Acad. Sci. USA. 2002;99:11014–11019. doi: 10.1073/pnas.172368799. [DOI] [PMC free article] [PubMed] [Google Scholar]
- 11.Zipfel WR, Williams RM, Christie R, Nikitin AY, Hyman BT, Webb WW. Proc. Natl. Acad. Sci. USA. 2003;100:7075–7080. doi: 10.1073/pnas.0832308100. [DOI] [PMC free article] [PubMed] [Google Scholar]
- 12.Pena AM, Strupler M, Boulesteix T, Schanne-Klein MC. Opt. Express. 2005;13:6268–6274. doi: 10.1364/opex.13.006268. [DOI] [PubMed] [Google Scholar]
- 13.Cheng JX, Xie XS. J. Phys. Chem. B. 2004;108:827–840. [Google Scholar]
- 14.Duncan MD, Reintjes J, Manuccia TJ. Opt. Lett. 1982;7:350–352. doi: 10.1364/ol.7.000350. [DOI] [PubMed] [Google Scholar]
- 15.Zumbusch A, Holtom GR, Xie XS. Phys. Rev. Lett. 1999;82:4142–4145. [Google Scholar]
- 16.Cheng JX, Volkmer A, Book LD, Xie XS. J. Phys. Chem. B. 2001;105:1277–1280. [Google Scholar]
- 17.Volkmer A, Cheng JX, Xie XS. Phys. Rev. Lett. 2001;87:0239011–0239014. [Google Scholar]
- 18.Cheng JX, Jia YK, Zheng G, Xie XS. Biophys. J. 2002;83:502–509. doi: 10.1016/S0006-3495(02)75186-2. [DOI] [PMC free article] [PubMed] [Google Scholar]
- 19.Wurpel GWH, Schins JM, Müller M. J. Phys. Chem. B. 2004;108:3400–3403. [Google Scholar]
- 20.Li L, Wang H, Cheng J-X. Biophys. J. 2005;89:3480–3490. doi: 10.1529/biophysj.105.065607. [DOI] [PMC free article] [PubMed] [Google Scholar]
- 21.Potma EO, Xie XS. Chemphyschem. 2005;6:77–79. doi: 10.1002/cphc.200400390. [DOI] [PubMed] [Google Scholar]
- 22.Wang H, Fu Y, Zickmund P, Shi R, Cheng JX. Biophys. J. 2005;89:581–591. doi: 10.1529/biophysj.105.061911. [DOI] [PMC free article] [PubMed] [Google Scholar]
- 23.Huff TB, Cheng JX. J. Microscopy. 2007;225:190–197. doi: 10.1111/j.1365-2818.2007.01729.x. [DOI] [PMC free article] [PubMed] [Google Scholar]
- 24.Kang E, Wang H, Kwon IK, Robinson J, Park K, Cheng JX. Anal. Chem. 2006;78:8036–8043. doi: 10.1021/ac061218s. [DOI] [PubMed] [Google Scholar]
- 25.Le TT, Rehrer CR, Huff TB, Nichols MB, Camarillo IG, Cheng JX. Mol Imaging. 2007 in press. [PMC free article] [PubMed] [Google Scholar]
- 26.Evans CL, Potma EO, Puoris'haag M, Côté D, Lin CP, Xie S. Proc. Natl. Acad. Sci. USA. 2005;102:16807–16812. doi: 10.1073/pnas.0508282102. [DOI] [PMC free article] [PubMed] [Google Scholar]
- 27.CDC. Summary health statistics for U.S. adults: national health interview survey 2005. U.S. Dept. Health and Human Services; 2006. [PubMed] [Google Scholar]
- 28.Yusuf S, Reddy S, Ounpuu S, Anand S. Circulation. 2001;104:2746–2753. doi: 10.1161/hc4601.099487. [DOI] [PubMed] [Google Scholar]
- 29.Zoumi A, lu X, Kassab GS, Tromberg BJ. Biophys. J. 2004;87:2778–2786. doi: 10.1529/biophysj.104.042887. [DOI] [PMC free article] [PubMed] [Google Scholar]
- 30.Konig K, Schenke-Layland K, Riemann I, Stock UA. Biomaterials. 2005;26:495–500. doi: 10.1016/j.biomaterials.2004.02.059. [DOI] [PubMed] [Google Scholar]
- 31.Boulesteix T, Pena AM, Pages N, Godeau G, Sauviat MP, Beaurepaire E, Schanne-Klein MC. Cytometry. 2005:20–26. doi: 10.1002/cyto.a.20196. [DOI] [PubMed] [Google Scholar]
- 32.Zandvoort M, Engels W, Douma K, Beckers L, Egbrink M, Daemen M, Slaaf DW. J. Vasc. Res. 2004;41:54–63. doi: 10.1159/000076246. [DOI] [PubMed] [Google Scholar]
- 33.Dejana E. Nat. Rev. Mol. Cell Biol. 2004;5:261–270. doi: 10.1038/nrm1357. [DOI] [PubMed] [Google Scholar]
- 34.Osawa M, Masuda M, Kusano K, Fujiwara K. J. Cell Biol. 2002;158:773–785. doi: 10.1083/jcb.200205049. [DOI] [PMC free article] [PubMed] [Google Scholar]
- 35.Ross R, Klebanoff SJ. J. Cell Biol. 1971;50:159–171. doi: 10.1083/jcb.50.1.159. [DOI] [PMC free article] [PubMed] [Google Scholar]
- 36.Ross R, Engl. N. J. Med. 1986;314:488–500. doi: 10.1056/NEJM198602203140806. [DOI] [PubMed] [Google Scholar]
- 37.Eriksson EE, Xie XUN, Werr J, Thoren P, Lindbom L. FASEB J. 2001;15:1149–1157. doi: 10.1096/fj.00-0537com. [DOI] [PubMed] [Google Scholar]
- 38.Libbly P. Nature. 2002;420:868–874. doi: 10.1038/nature01323. [DOI] [PubMed] [Google Scholar]
- 39.Streit WJ, Kreutzberg GW. J. Neurocytol. 1987;16:249–260. doi: 10.1007/BF01795308. [DOI] [PubMed] [Google Scholar]
- 40.Chul JL, Kang JS, Kim MS, Lee KP, Lee MS. Bull. Korean Chem. Soc. 2004;25:1211–1216. [Google Scholar]
- 41.Richards-Kortum R, Sevick-Muraca E. Annu. Rev. Phys. Chem. 1996;47:555–606. doi: 10.1146/annurev.physchem.47.1.555. [DOI] [PubMed] [Google Scholar]
- 42.Kielty CM, Sherratt MJ, Shuttleworth CA. J. Cell Sci. 2002;115:2817–2828. doi: 10.1242/jcs.115.14.2817. [DOI] [PubMed] [Google Scholar]
- 43.Debelle L, Alix AJP, Jacob M-P, Huvenne J-P, Berjot M, Sombret B, Legrand P. J. Biol. Chem. 1995;270:26099–26103. doi: 10.1074/jbc.270.44.26099. [DOI] [PubMed] [Google Scholar]
- 44.Levin IW. Vibrational spectroscopy of membrane assembles. In: Clark RJH, Hester RE, editors. Advances in Infrared and Raman Spectroscopy. New York: Wiley Heyden; 1984. pp. 1–48. [Google Scholar]
- 45.Ito H, Miller SC, Billingham ME, Akimoto H, Torti SV, Wade R, Gahlmann R, Lyons G, Kedes L, Torti FM. Proc. Natl. Acad. Sci. USA. 1990;87:4275–4279. doi: 10.1073/pnas.87.11.4275. [DOI] [PMC free article] [PubMed] [Google Scholar]
- 46.Eyre DR, Paz MA, Gallop PM. Annu. Rev. Biochem. 1984;53:717–748. doi: 10.1146/annurev.bi.53.070184.003441. [DOI] [PubMed] [Google Scholar]
- 47.Naghavi M, Libby P, Falk E, Casscells SW, Litovsky S, Rumberger J, Badimon JJ, Stefanadis C, Moreno P, Pasterkamp G, Fayad Z, Stone PH, Waxman S, Raggi P, Siscovickadjid M, Zarrabi A, Burke A, Yuan C, Fitzgerald PJ, Korte DSCLd, Aikawa M, Airaksinen KEJ, Assmann G, Becker CR, Chesebro JH, Farb A, Galis ZS, Jackson C, Jang I-K, Koenig W, Lodder RA, March K, Demirovic J, Navab M, Priori SG, Rekhter MD, Bahr R, Grundy SM, Mehran R, Colombo A, Boerwinkle E, Ballantyne C, Insull W, Schwartz RS, Vogel R, Serruys PW, Hansson GK, Faxon DP, Kaul S, Drexler H, Greenland P, Muller JE, Virmani R, Ridker PM, Zipes DP, Shah PK, Willerson JT. Circulation. 2003;108:1664–1672. doi: 10.1161/01.CIR.0000087480.94275.97. [DOI] [PubMed] [Google Scholar]
- 48.Botnar RM, Perez AS, Witte S, Wiethoff AJ, Laredo J, Hamilton J, Quist W, Parsons EC, Vaidya A, Kolodziej A, Barrett JA, Graham PB, Weisskoff RM, Manning WJ, Johnstone MT. Circulation. 2004;109:2023–2029. doi: 10.1161/01.CIR.0000127034.50006.C0. [DOI] [PMC free article] [PubMed] [Google Scholar]
- 49.Stamper D, Weissman NJ, Brezinski M. J. Am. Coll. Cardiol. 2006;47:C69–C79. doi: 10.1016/j.jacc.2005.10.067. [DOI] [PubMed] [Google Scholar]
- 50.Le TT, Langohr IM, Lockr MJ, Sturek M, Cheng JX. J. Biomed. Opt. 2007 doi: 10.1117/1.2795437. in press. [DOI] [PMC free article] [PubMed] [Google Scholar]
- 51.Hopt A, Neher E. Biophys. J. 2001;80:2029–2036. doi: 10.1016/S0006-3495(01)76173-5. [DOI] [PMC free article] [PubMed] [Google Scholar]
- 52.Lusis AJ. Nature. 2000;407:233–241. doi: 10.1038/35025203. [DOI] [PMC free article] [PubMed] [Google Scholar]
- 53.Flusberg BA, Cocker ED, Piyawattanametha W, Jung JC, Cheung ELM, Schnitzer MJ. Nat. Meth. 2005;2:941–950. doi: 10.1038/nmeth820. [DOI] [PMC free article] [PubMed] [Google Scholar]
- 54.Evans CL, Ganikhanov F, Xie XS. Opt. Express. 2006;14:4427–4432. doi: 10.1364/oe.14.004427. [DOI] [PubMed] [Google Scholar]