

Abstract
Distinct automatic and controlled processes are presumed to influence social evaluation. Most empirical approaches examine automatic processes using indirect methods, and controlled processes using direct methods. We distinguished processes from measurement methods to test whether a process distinction is more useful than a measurement distinction for taxonomies of attitudes. Results from two studies suggest that automatic components of attitudes can be measured directly. Direct measures of automatic attitudes were reports of gut reactions (Study 1) and behavioral performance in a speeded self-report task (Study 2). Confirmatory factor analyses comparing two-factor models revealed better fits when self-reports of gut reactions and speeded self-reports shared a factor with automatic measures versus sharing a factor with controlled self-report measures. Thus, distinguishing attitudes by the processes they are presumed to measure (automatic vs. controlled) is more meaningful than distinguishing based on the directness of measurement.
Keywords: attitudes, implicit attitudes, attitude measurement, automatic processes
Attitude researchers have proposed several “dual-process theories,” suggesting that evaluations can be meaningfully parsed into distinct types. Smith and DeCoster (1999) contend that all dual-process models share the assumption that people can process information using simple, low-effort, readily accessible decision rules, and also through a second type of processing involving the active, effortful scrutiny of relevant information. Further, most models postulate that people use deliberative processing only when they are sufficiently motivated, and when time and cognitive capacity permit (Fazio, 1990). The terms used to describe attitudes in the most common dual-process models vary and include: “automatic” or “controlled” (Fazio, Sanbonmatsu, Powell, & Kardes, 1986), “spontaneous” or “deliberate” (Fazio, 1990), “implicit” or “explicit” (Greenwald & Banaji, 1995; Wilson, Lindsey, & Schooler, 2000), “impulsive” or “reflective” (Strack & Deutsch, 2004), and “rule-based” or “associative” (Smith & Decoster, 1999).
A common way to parse the dual-components of attitudes is by considering whether the measurement is “indirect” or “direct” (Bassili & Brown, 2005; De Houwer, in press; Fazio & Olson, 2003). With direct attitude measures, the response is a reflection of the evaluation, such as a warm-cold rating in response to the question “How warmly do you feel about Canadians?” Indirect measures, by contrast, infer the evaluation, often by comparing performance conditions in response latency tasks such as the Implicit Association Test (IAT; Greenwald, McGhee, & Schwartz, 1998) or with self-report measures that obscure the content of measurement.
Theoretical conceptualizations and empirical support for dual-process models have largely assumed equivalence between the method of measurement (direct or indirect) and dual-process constructs (e.g., controlled or automatic). Some conceptualizations, for example, use the terms “direct” and "indirect" interchangeably with “automatic” and “controlled” (Bassili & Brown, 2005). Payne, Jacoby, and Lambert (2005) point out that, “one popular approach in recent social cognition research identifies automatic processes with performance on indirect tests, and controlled processes with performance on direct tests” (p. 394). Fazio and Olson (2003) argue “it is more appropriate to view the measure as implicit or explicit, not the attitude (or whatever other construct)” (page 303; italics in original), and articulate a preference for distinguishing by mode of measurement rather than latent constructs. Finally, De Houwer (in press) argues that the functional properties of an outcome (e.g., implicit or automatic attitudes) should not be confused with measurement procedures (indirect measures) and suggests that measurement terms should not be used interchangeably with, or instead of, the terms that define the construct taxonomy.
The purpose of this article is to disentangle a construct distinction (automatic versus controlled) from a measurement one (direct versus indirect) to identify which provides a better account of relations among attitude measures. Despite widespread interest in this question, empirical tests of the competing accounts are few. Conrey et al.’s (2005) QUAD Model and Payne’s (2001) adaptation of Jacoby’s Process Dissociation Procedure (PDP) investigate multiple process influences within a single task. This work points out that no task is process-pure and attempts to decompose individual tasks.
Our approach complements these. We pursue a comparative assessment across multiple tasks to identify common underlying properties among measures with distinct surface features or procedures. Together, multinomial models of single measures (e.g., Conrey et al., 2005), and comparative model fitting of multiple measures will foster development of construct taxonomies. Here, we suggest that differences among attitude measures are better understood by distinguishing between the presumed processes they engage, rather than the directness or indirectness of assessment.
Study 1
Study 1 examined whether a process distinction provided a better account than a measurement distinction in characterizing the relations among direct, controlled measures (i.e., self-report ratings of “actual feelings”); indirect measures of automatic processes (i.e., Implicit Association Test [IAT], Greenwald et al., 1998, Go/No-go Association Task [GNAT], Nosek & Banaji, 2001, and Sorting Paired Features [SPF], Bar-Anan, Vianello, & Nosek, 2006), and direct measures about automatic processes (self-reported “gut feelings”) of attitudes toward gay people relative to straight people.
In measurement terms, reports of gut feelings are direct, require introspection, and are controllable, all of which are hallmarks of explicit attitudes (Bargh, 1994). This presents a strong test for our hypothesis that such assessments will be more similar to indirect measures that do not require introspection and are presumed to reflect automatic evaluation processes. Relying upon participants’ introspective reports of their automatic processes requires either (a) some awareness of their operation, or (b) a good theory about how one’s automatic processes operate. We expected that covariation among measures would be best described when gut reaction measures shared a latent factor with indirect measures of automatic processes versus sharing a latent factor with the other direct attitude measures.
Hypothesis Testing Through Structural Equation Modeling
Comparing nested structural equation models allows for confirmatory testing of hypotheses about how variables are related (McArdle, Johnson, Hishinuma, Miyamoto, & Andrade, 2001). Our baseline model assumes a single underlying attitude construct (Model 1). In Model 2, attitudes are characterized by dual components distinguished by measurement type (Direct-Indirect). In Model 3, attitudes are characterized by dual components distinguished by their underlying process, regardless of how they are measured (Automatic-Controlled). If the Automatic-Controlled model shows a better fit than the Direct-Indirect model, that suggests attitudes are more meaningfully distinguished by the function of their underlying processes than by the form of their measurement. In addition, we tested a three-factor model taking into account both directness and automaticity (Model 4). This model would be the best fit if there is variance in self-reported gut reactions that is distinct from both the automatic-indirect and controlled-direct attitude measures. For example, if introspection about automatic processes is based partly on experiential awareness and partly on accuracy of self-theories (without introspective access) then a three-factor model might be best fitting.
Assessment of model fit was based on the root-mean-square error of approximation (RMSEA or εa; Steiger & Lind, 1980), an index that weighs model fit against model parsimony (Steiger, 2000). If two models fit equally well, the more constrained model would show a better εa value. Model fit interpretation followed conventions with εa<.05 considered a “close” fit, .05-.08 a “fair” fit, .08-.10 a “mediocre” fit, and εa>.10 a “poor” fit (MacCallum, Browne, & Sugawara, 1996). Because we are testing hypotheses by contrasting models, the critical tests concern the comparison of model fits. A 95% confidence interval around the change in εa from one model to another reveals whether there is a meaningful difference between two model fits.
Method
Participants
Seventy students (29 women and 41 men, mean age=19.1 years) participated for a course requirement.
Materials
Implicit Association Test (IAT)
The IAT (Greenwald et al., 1998) assesses associations among two concept categories (gay people and straight people) and two evaluative attributes (good and bad). See the Appendix for a list of stimuli used in this and subsequent implicit measures.
The IAT consisted of seven trial blocks following the recommendation of Nosek, Greenwald, and Banaji (2005), and was scored with the D algorithm recommended by Greenwald, Nosek, and Banaji (2003) for contrasted latency conditions with the following features: response latencies <400ms were removed, and trial latencies were calculated from the beginning of the trial until the time of a correct response, regardless of whether an error was made prior to the correct response. A positive IAT D score indicates an implicit preference for straight people compared to gay people.
Go/No-go Association Test (GNAT)
Like the IAT, the GNAT (Nosek & Banaji, 2001) assesses the strength of associations between concepts and attribute categories. Participants judged whether or not stimulus items belonged to one of the target categories positioned at the top of the screen. If the item belonged to a target category, participants pressed the spacebar; if not, they did nothing until the item disappeared. If an item was judged incorrectly, either by failing to respond to a target or by responding to a distracter, a red “X” appeared for 200ms directly underneath the stimulus item.
The GNAT consisted of eight trial blocks with the following categorization rules: (1) 11 trials distinguishing good word targets from bad distracters, (2) 11 trials distinguishing bad word targets from good distracters, (3) 11 trials distinguishing pictures of gay people from straight people distracters, (4) 11 trials distinguishing pictures of straight people from gay people distracters, (5) 50 trials distinguishing gay people and good words from distracters (straight people and bad words) with a 2400ms trial length, (6) repetition of block 5 with a 2200ms trial length, (7) 50 trials distinguishing gay people and bad words from distracters (straight people and good words) with a 2400ms trial length, (8) repetition of block 7 with a 2200ms trial length. Across all blocks, distracters were presented for 1000ms.
Participants always completed block 1 first, followed by blocks 2, 3, and 4 in random order. The gay+good blocks (5 and 6) and the gay+bad blocks (blocks 7 and 8) were counterbalanced.
The GNAT was scored by applying the D algorithm (Greenwald et al., 2003) to target response trials. The difference between the gay+good and gay+bad response conditions were calculated for the 2400ms condition and the 2200ms condition. The median error rate was 0%; data from one participant was excluded due to an extreme error rate of 28%.
Four-Category Sorting Paired Features Task (SPF-4)
In the SPF (Baranan et al., 2006), participants categorized two stimulus items simultaneously into categories representing their conjoint group membership. Assessment of gay and straight evaluations involved representation of four category pairs (gay people+good, gay people+bad, straight people+good, straight people+bad) in the four corners of the computer screen. Participants sorted pairs of words and pictures into one of the four categories using the “Q”, “C”, “P”, and “M” keys. For example, the word “sunrise” might appear in the center of the screen along with a picture of a gay couple, and the participant would categorize this pair into the gay+good category. Participants were instructed to respond quickly while making as few mistakes as possible. If a pair was incorrectly categorized, a red “X” appeared in the center of the screen until it was categorized correctly.
Each participant completed three identical blocks of 80 trials each. Between subjects, the key position of the conjoint categories was counterbalanced. Following the D scoring algorithm for comparing contrasted conditions (Greenwald et al., 2003) we calculated separate gay and straight evaluation D scores. In order to obtain an SPF score with a comparative meaning, we calculated the difference between the gay and straight D scores, resulting in a single score indexing attitudes toward gay people relative to straight people.
Ratings of gut reactions and actual feelings
Participants were instructed to reflect on both the “gut reaction” they experience when initially thinking about gay and straight people, asked separately, and the “actual feeling” toward gay and straight people they experience when given enough time for full consideration. They used separate bar ratings (1 = very negative to 8 = very positive) to indicate their gut and actual feelings.
Attitude timeline
Participants were instructed to reflect on how their evaluative experiences emerge over time (See Figure 1). They rated their attitude toward the two target and four filler attitude objects on a 6-point scale (very negative to very positive) at each of five imagined time points: (1) instant reaction, (2) reaction a split-second later, (3) reaction after one second, (4) reaction after five seconds, and (5) reaction when given enough time to think fully. Importantly, the responses were introspective accounts of how one experiences their evaluations emerging over time, not a direct assessment of evaluations over this time course. Only time points 1 (gut reaction) and 5 (actual feeling) were used for analysis.
Figure 1.
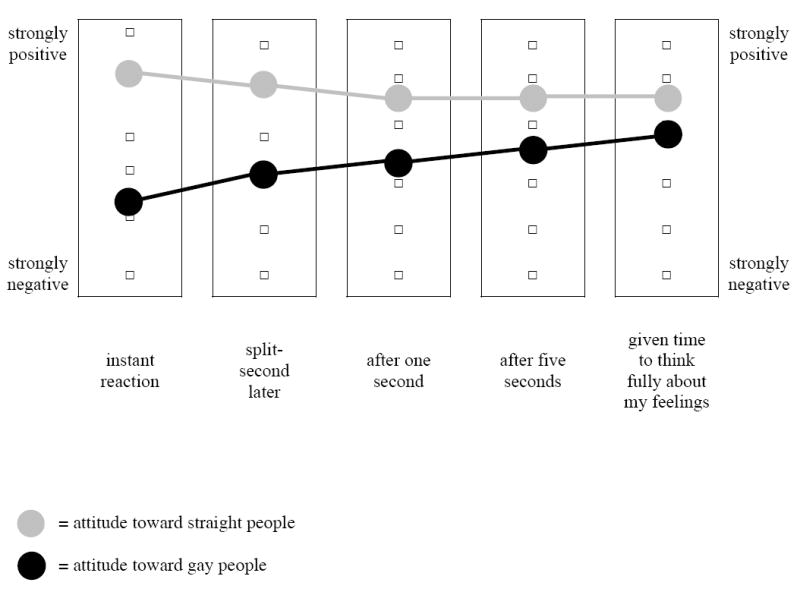
Participants used the attitude timeline measure to report how their attitudes unfold over time. They reported the positivity of their attitude toward gay people at each of the five imagined time points listed above. They then did the same for their attitudes toward straight people. A difference score was calculated for each time point by subtracting the positivity for gay people from that for straight people such that higher numbers reflect a preference for straight people relative to gay people.
Procedure
Presentation order of direct and indirect measures was counterbalanced between subjects. Among indirect measures, presentation order was counterbalanced.1
Results and Discussion
Descriptive Statistics
Mean differences between ratings of straight and gay people reflect a preference for straight people relative to gay people across all measures and measurement types. Table 1 presents descriptive statistics. Participants reported more negativity in their gut reactions (M=2.83, SD=2.02) than in ratings of their actual feelings (M=1.16, SD=1.78) toward gay relative to straight people, t(67)=8.41, p<.0001, d=-0.87. Responses to the attitude timeline followed the same pattern (see Figure 1); Time 0 ratings (M=2.31, SD=1.62) were more negative toward gay compared to straight people than were Time 5 ratings (M=.87, SD=1.38), t(69)=7.95, p<.0001, d=-0.96, though both were strongly negative.
Table 1.
Descriptive statistics for Studies 1 and 2.
| Study 1: Gay/Straight Attitudes
| |||
|---|---|---|---|
| Variable | M | SD | Cohen’s d |
| IAT | .49 | .36 | 1.36 |
| GNAT | .19 | .36 | .53 |
| SPFgay | -.10 | .22 | .45 |
| SPFstraight | .22 | .23 | .96 |
| Attitude Timeline | |||
| Time 0 | 2.31 | 1.62 | 1.43 |
| Split Second | 1.91 | 1.55 | 1.23 |
| One-Second | 1.47 | 1.61 | .91 |
| Two-Seconds | 1.20 | 1.57 | .76 |
| Time 5 | .87 | 1.38 | .63 |
| Bar Ratings | |||
| Gut | 2.83 | 2.02 | 1.40 |
| Actual | 1.16 | 1.78 | .65 |
|
Study 2: Gay/Straight Attitudes
| |||
| Variable | M | SD | Cohen’s d |
|
| |||
| IAT | .28 | .26 | 1.08 |
| Speeded Self-Report | .74 | 1.12 | .66 |
| Standard Self-Report | .74 | 1.01 | .73 |
|
Study 2: Teen Pop/Jazz Attitudes
| |||
| Variable | M | SD | Cohen’s d |
|
| |||
| IAT | .14 | .28 | .50 |
| Speeded Self-Report | -.42 | 1.15 | -.37 |
| Standard Self-Report | -.55 | 1.04 | -.53 |
Note. With the exception of the SPFgay, SPFstraight and GNAT, all measures are coded such that a higher score indicates a preference for straight people relative to gay people or teen pop music relative to jazz music. A higher score on the SPFgay and SPFstraight indicates a preference for that target group. A higher score on the GNAT indicates a stronger association between gay people and bad than between gay people and good. Cohen’s d is the effect size of the comparison to zero, with 0 indicating no preference between gay and straight or jazz versus teen pop. Means for all measures differ significantly from 0 at the p < .05 level.
Relations among Self-reported Gut Reactions and Automatic and Controlled Measures
The primary hypotheses concern whether distinguishing evaluations by their method of measurement (direct-indirect) is superior to a distinction based on the processes thought to influence evaluative responding (automatic-controlled). Correlations among study measures appear in the Appendix. Note that comparative model fitting is a formal test of attitude structure that supercedes eyeballing correlation patterns to infer relations among measures. Figure 2 presents the general progression of models tested in both studies.
Figure 2.
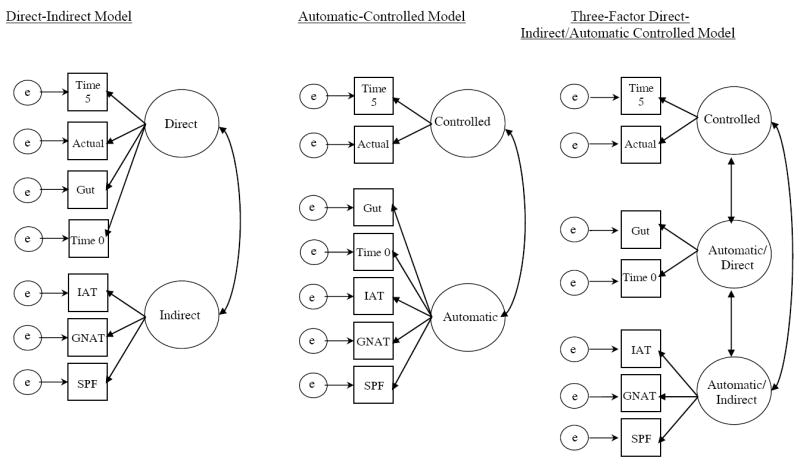
Representation of structural equation models comparing competing characterizations of relations among measures of attitudes toward gay relative to straight people. Squares depict measured variables and circles depict latent factors. The measured variables presented here are those for Study 1. The progression of models was identical for gay-straight and teen pop-jazz attitudes in Study 2; however, the indicators of the controlled factor were responses on the standard self-report measure, the indicators of the automatic/direct factor were responses on the speeded self-report measure, and the indicators of the automatic/indirect factor were split-halves of the IAT.
One-factor Model: Single Attitude Construct
A single-factor model serves as a baseline against which to compare the competing dual-process models. Conceptually, this model represents the hypothesis that sexual orientation attitudes can be represented by a single construct, regardless of measurement method or underlying processes. The single-factor model represented the common variance of seven observed attitude indicators (IAT, GNAT, SPF, self-reported Gut Feeling, self-reported Actual Feeling, self-reported Instant Feeling and self-reported Fully Considered Feeling). This model proved to be a poor fit to the data (χ2(15)=70.4, εa=.23), indicating room for improvement in representing the relationships among attitude measures.2 Factor loadings for all models appear in the Appendix.
Two-factor Models: Direct-Indirect and Automatic-Controlled
Both the automatic-controlled and direct-indirect models are nested within the single-attitude model. For the direct-indirect model, the indirect measures (IAT, GNAT, SPF) comprise one factor that is distinct from a second factor of all the direct measures (Gut Feeling, Instant Feeling, Actual Feeling, and Fully Considered Feeling). This model prioritizes the directness of the ‘gut feelings’ and ‘instant reaction’ self-reports over their introspective accounts of automatic evaluative processes. This model was a significant improvement over the single-attitude model (Δχ2(1)=11.1, 95%C.I. εaΔ=.17-.64) but still showed an overall poor fit to the data (χ2(14)=59.3, εa=.22).
As a contrasting dual-factor account, the automatic-controlled model distinguished factors based on the evaluative processes that the attitude indicators were presumed to emphasize, rather than the directness of assessment. The IAT, GNAT, SPF, Gut Feeling, and Instant Feeling measures were treated as common indicators of the automatic factor, and Actual Feeling and Fully Considered Feeling measures were common indicators of the controlled factor. As before, these factors were allowed to covary. This model showed a significant and substantial improvement over the baseline single-attitude model (Δχ2(1)=48.3, 95%C.I. εaΔ =.60-1.07), and showed an overall “fair” fit to the data (χ2(14)=22.1, εa=.09).
Because these models are not nested and have the same number of degrees of freedom, it is not possible to calculate a 95% confidence interval around εa of Δ. However, a comparison of their improvements over the baseline model suggests that the characterization of attitudes as automatic-controlled (Δχ2 = 48.3) is superior to the model characterizing attitudes by direct-indirect measurement (Δχ2=11.1), as evidenced by the substantial difference in Δχ2 (Δχ2(0)=37.2). Also, their overall difference in model fit (εa=.22 in the measurement model, εa=.09 in the process model) is dramatic.3
These findings support the hypothesis that distinguishing attitude assessments by their presumed process components represents covariation among measures better than distinguishing by the directness of measurement. This was a particularly difficult test because the critical indicators – gut feelings and instant feelings – are not automatic measures in any formal sense; they were direct, introspective accounts of automatic processes. Even so, these assessments showed a better fit when sharing a factor with indirect indicators of evaluation (IAT, GNAT, SPF) than when sharing a factor with direct indicators of “actual feelings.”
Three-factor Model
Asking participants to report their automatic evaluations is an unusual request. The improvement from a single-factor model to a dual-factor automatic-controlled model suggests that participants have some ability, either through accurate introspection or good self-theories, to report evaluative associations that are not considered one’s actual feelings but do correspond to evaluative associations assessed by indirect methods. Because introspective accounts about automatic evaluations are unusual, it is possible, perhaps likely, that they capture distinct information that corresponds with neither automatic nor controlled evaluations uniquely. To test this possibility, we also fit a three-factor model.
In the three-factor model, self-reported gut feelings (Gut Feeling, Instant Feeling) comprised their own attitude factor distinct from a factor comprised of the indirect, automatic measures (IAT, GNAT, SPF) and from a factor comprised of the direct, controlled measures (Actual Feeling, Fully Considered Feeling). The data were an excellent fit (χ2(12)=10.8, εa=.00). Also, the three-factor attitude model was a significant improvement over the automatic-controlled model, the best of the dual-attitude models (Δχ2(2)=11.3, 95%C.I. εaΔ=.10-.44).
While self-reported gut feelings were more similar to the indirect measures than to the other self-reported attitude measures, there was some unique variance in self-reported gut feelings that was distinct from both. One possibility is that these reports are a self-theory that has some but not complete correspondence with automatic evaluations. Alternately, reporting relatively unbiased ‘actual feelings’ may reduce self-presentation concerns by providing one the moral credentials to report a more negative ‘gut feeling’ that enables unadulterated report that is usually dismissed as not one’s real feelings. This explanation is consistent with the framework of the Justification-Suppression Model of Prejudice (JSM; Crandall & Eshleman, 2003) that posits a myriad of factors leading to the suppression of negative attitudes toward outgroups. A third possibility is that measures like the IAT, GNAT, and SPF partly assess automatic evaluations that are “experienced” and amenable to introspective report, and partly evaluations that are not.4
While these are interesting possibilities for explaining the unique component of ‘gut reactions’ that led the three-factor model to be an improvement over the two-factor model, our hypothesis is that the self-report of “gut feelings” is a meaningful account of some components of automatic evaluation. That is, the improved three-factor account can be seen as a weakness in that it suggests a less parsimonious fact that different measures load best when they are represented by different latent factors. More impressive for theory and taxonomy is when distinct measures can be combined effectively into a single latent factor. This was evident in the contrast between the two-factor models in which two measures that were substantially similar in surface features and procedure – reported gut reactions and actual feelings – actually fit better when loaded on distinct factors and gut reactions shared a factor with methods that had dramatically different surface features and procedure. This strongly supports our contention that a taxonomy of attitudes by measurement features is not as effective as one that distinguishes by presumed component processes. This is analogous to considerations of the relative effectiveness of defining species taxonomies by phenotype (surface features) or genotype (underlying genetic structure).
In sum, Study 1 demonstrates that distinguishing measures by presumed processes provides a better fit than by directness of assessment. Study 2 pursued a complementary measurement strategy that uses a distinct operationalization of direct assessment of automatic reactions, rather than continue to unravel the unique properties of the ‘gut reaction’ measures.
Study 2
In Study 2, we replaced the self-reported gut reaction measure with a speeded self-report measure of attitudes. This change increases the likelihood of capturing actual automatic reactions directly, rather than relying on introspective report.5 This is a conceptual replication using a very different procedure. In this second study we attempted to test our hypothesis in two attitude domains - attitudes toward gay/straight people and attitudes toward teen pop/jazz music, and used just the IAT for measuring evaluations indirectly.
Method
Participants
One-hundred fourteen students (64 women and 50 men, mean age=19.1 years) participated in order to partially fulfill a course requirement.
Materials
Gay/Straight attitude IAT
The procedural details of the gay/straight IAT used in this study were identical to those in Study 1. Data were parceled to form two indicators for the structural models.
Teen Pop/Jazz attitude IAT
For this IAT, the evaluative category labels were teen pop, jazz, good, and bad. Stimuli were names of widely recognized pop and jazz singers (e.g. Britney Spears, Justin Timberlake, Ella Fitzgerald, Miles Davis). Procedures were identical to those of the previous IATs; a positive D score indicates an implicit preference for teen pop over jazz music.
Speeded Attitude Self-Report
Participants were required to respond to stimulus items within a 700ms response deadline. Responses to stimulus words were on a 4-point scale (--, -, +, ++) indicating negativity to positivity and corresponding to the 2, 4, 7, and 9 keys. Participants rated items as quickly as possible. If the item was not rated before the response deadline, a buzzer sounded for 200ms and a red “X” appeared on the screen. Averaged across participants, 18% of trials failed to meet the response deadline.
The task involved 20 practice and 48 critical trials. The target concepts gay people, straight people, teen pop, and jazz, were each presented three times in the critical phase. The practice trials and remaining 36 trials in the critical phase were filler items (see Appendix). The difference of the average rating for the gay versus straight and for jazz versus teen pop provided an index of comparative preference. Each score was an indicator in the structural models.
Unlimited Time Attitude Self-Report
To measure attitudes directly without time pressure, we used the same procedure with no response deadline.
Procedure
IATs and self-report measurement order was counterbalanced across participants. Within measurement type, the IAT order was counterbalanced as were the self-report measures.
Results and Discussion
Relations among Speeded Self-Report, Standard Self-Report, and IAT
The hypothesis was that a dual attitude model distinguishing between automatic and controlled components would account for relations among attitude measures better than a model representing a single attitude construct or a dual-attitude model with direct-indirect components. The same series of model comparisons from Study 1 were used for gay/straight attitudes and a conceptual replication with teen pop/jazz attitudes.
Gay/Straight Attitudes
The baseline, single-factor model of attitudes toward gay people was a mediocre fit to the data (χ2(20)=42.3, εa=.10). The direct-indirect model did not offer a significant improvement over the single-attitude model (Δχ2(1)=3.3, 95% C.I. εaΔ=.00-.36), suggesting that distinguishing by directness of measurement provides no meaningful improvement in accounting for attitude structure. However, when the speeded self-report and IAT indicators shared a common factor in the automatic-controlled model, the overall model fit was fair (χ2(19)=27, εa=.06) and, importantly, we observed a significant improvement in model fit (Δχ2(1)=15.3, 95%C.I. εaΔ=.18-.55). Although speeded self-report is a direct measurement, attitude components are better clarified when it is considered a common indicator with the IAT than when it is considered a common indicator with direct measures that allow for deliberative consideration.
In the three-factor model, the IAT, speeded self-report measure and standard self-report measure were each distinct, covarying factors. Unlike Study 1, this model did not offer a significant improvement in fit over the more parsimonious automatic-controlled model (Δχ2(2)=6.02, 95%C.I. εaΔ=.00-.28), suggesting that only two attitude factors were necessary to account for the relations among these attitude measures.
Teen Pop/Jazz Attitudes
The baseline, single-factor model was a poor fit to the data (χ2(20)=91.9, εa=.18). As with gay-straight attitudes, the direct-indirect model for jazz-teen pop attitudes (χ2(19)=86.9, εa=.18) was not a significant improvement over the single-factor model (Δχ2(5)=1, 95%C.I. εaΔ=.00-.40). On the other hand, the automatic-controlled model was a close fit to the data (χ2(19)=19.9, εa=.02) and, unlike the direct-indirect measurement model, was a significant improvement over the single-attitude model (Δχ2(1)=72, 95%C.I. εaΔ=.61-.98). Again, characterization of attitudes as automatic-controlled was superior to a model characterizing attitudes by measurement type, as evidenced by the sizable difference in χ2 (Δχ2 (0)=60), and εa (εa=.18 versus εa=.02).
Finally, a three-factor model was fit to the data and, again, the three-factor model did not offer a significant improvement in fit over the more parsimonious automatic-controlled model (Δχ2(2)=4.8, 95%C.I. εaΔ=.00-.34). In summary, the jazz-teen pop attitude models replicated the findings for the gay-straight attitude models.
Distinguishing attitude measures based on the processes that they are presumed to engage provides an excellent fit for attitude structure and distinguishing by directness of measurement does not. Further, in Study 2, a three-factor model did not improve over the automatic-controlled structure.
General Discussion
In two studies we found that attitude measures are more sensibly parsed by the processes they are presumed to engage than by their measurement features. In Study 1, participants self-reported their gut reactions and actual feelings toward gay/straight people. In Study 2, participants completed a speeded self-report task designed to be a direct behavioral performance of their gut reaction to gay/straight people and teen pop/jazz music. In both studies, model comparison using confirmatory factor analysis showed the data were better fit to a two-factor model distinguishing automatic and controlled components of attitudes than to a model distinguishing attitudes by whether they were measured directly or indirectly.
These results fit neatly with modern dual-process theories of evaluation, most directly Fazio’s MODE model (Fazio, 1990). The MODE model emphasizes the adjustment of automatically activated evaluations to the extent that motivation and opportunity are available to do so. Measures that preclude opportunities for adjustment either by measuring indirectly (e.g., IAT) or by requiring rapid responses (e.g., speeded self-report) should converge, while measures offering an opportunity for adjustment (e.g., ‘standard’ self-report) will elicit distinct evaluations when motivation exists to override one’s automatic response.
Implications
These findings suggest that direct measures can be devised to capture automatic components of attitudes despite suggestions that indirect measures are essential for such assessments. One possible explanation is that indirect measures might not tap attitudes entirely outside introspective access. One goal of this work was to challenge the notion of ‘unconscious’ by giving participants every opportunity to report on automatic experience. At the same time, we are skeptical that this issue can achieve definitive resolution. Unawareness is a flexible phenomenon – people can be unaware of something in the moment that they could, in theory, be aware of under other conditions. One point of view says that this means that the associations are not unconscious, even though there are conditions in which the person is not aware that they are present or operating.
Indirect measures might capture associations not normally accessible via the sort of introspection induced by traditional forms of direct attitude measures, but these associations may produce subjectively accessible experiences that can be reported under the right circumstances. One such circumstance may be to produce those attitudes quickly before control processes can be brought to bear. Bargh (1994) points out that one way in which a person may be unaware of a mental process is by being unaware of the influences determining a subjective feeling-state. By having participants focus on their gut feelings, it is possible that participants are referring to aspects of their cognitive or affective experience that are more related to automatic processes than they would when responding to a typical self-report measure.
Another possibility for Study 1 is that participants are not actually reporting on their automatic attitudes proper, but are reporting their theories of their automatic attitudes. If people are just reporting self-theories rather than on experiential awareness, it is interesting that those theories are ‘accurate’ in the sense that reports of gut reactions load better with responses on automatic measures than with standard self-report measures. Also, Study 2 results are less likely to be attributable to self-theories because participants “performed” their gut reactions in the speeded self-report task. At the same time, participants in Study 2 may not have experiential awareness of the automatic evaluations assessed in speeded report. Their unintended responses might have been experienced as ‘errors,’ not reflections of subjective experience. Distinguishing self-theories from subjective experience is an intriguing issue for future research.
Conclusion
The present studies suggest that attitudes have distinct but related automatic and controlled factors contributing to social evaluation and that parsing attitudes by underlying processes is superior to parsing attitude measures by measurement features. This suggests that “automatic” and “controlled” should not be used interchangeably with “indirect” and “direct;” and that theoretical dual-process models of attitudes are more usefully specified by automatic and controlled processes than by mode of assessment.
Table 2.
Hypothesis Tests relating Gut Reactions to Automatic and Controlled Measures for Studies 1 and 2. Presented in a Series of Structural Model Fit Comparisons.
| Study 1: Gay/Straight Attitudes
| |||||
|---|---|---|---|---|---|
| Model | χ2 | df | Δχ2/df | εa | 95% CI εa of Δ |
| Model 1: Single-Attitude Model | 70.4 | 15 | .23 | ||
| Model 2: Dual-Attitude Model - Measurement Distinction | 59.3 | 14 | 11.1/1 | .22 | .165-.637 |
| Model 3: Dual-Attitude Model - Process Distinction | 22.1 | 14 | 48.3/1 | .09 | .600-1.07 |
| Model 4: Triple-Attitude Model | 10.8 | 12 | 11.3/2 | .00 | .098-.443 |
|
| |||||
|
Study 2: Teen Pop/Jazz Attitudes
| |||||
| Model | χ2 | df | Δχ2/df | εa | 95% CI εa of Δ |
|
| |||||
| Model 1: Single-Attitude Model | 91.9 | 20 | .18 | ||
| Model 2: Dual-Attitude Model - Measurement Distinction | 86.9 | 19 | 5.0/1 | .18 | .000-.395 |
| Model 3: Dual-Attitude Model - Process Distinction | 19.9 | 19 | 72.0/1 | .02 | .614-.983 |
| Model 4: Triple-Attitude Model | 15.1 | 17 | 4.8/2 | .01 | .000-.339 |
|
| |||||
|
Study 2: Gay/Straight Attitudes
| |||||
| Model | χ2 | df | Δχ2/df | εa | 95% CI εa of Δ |
|
| |||||
| Model 1: Single-Attitude Model | 42.3 | 20 | .10 | ||
| Model 2: Dual-Attitude Model - MeasurementDistinction | 39.0 | 19 | 3.3/1 | .10 | .000-.355 |
| Model 3: Dual-Attitude Model - Process Distinction | 27.0 | 19 | 15.3/1 | .06 | .184-.552 |
| Model 4: Triple-Attitude Model | 20.8 | 17 | 6.02/2 | .05 | .000-.283 |
Note. εa = root mean-square error of approximation (RMSEA) for that model. For Models 1, 2, and 4, Δχ2/df = change in chi-square and degrees of freedom relative to the previous model. Because Model 3 is not nested under Model 2, it is always compared to Model 1. 95% CI εa of Δ = confidence interval around RMSEA of the change in fit between models. If the CI contains .050, then model fits are not considered to be significantly different.
Appendix Table A1.
Correlations Among Study Measures in Studies 1 and 2
| Study 1: Gay/Straight Attitudes
| |||||||
|---|---|---|---|---|---|---|---|
| IAT | GNAT | SPF | Gut | Actual | Time 0 | Time 5 | |
| IAT | 1 | ||||||
| GNAT | .36** | 1 | |||||
| SPF | .26* | .18 | 1 | ||||
| Gut | .23 | .33** | .12 | 1 | |||
| Actual | .16 | .31* | .01 | .65*** | 1 | ||
| Time 0 | .19 | .31 | .16 | .85*** | .50*** | 1 | |
| Time 5 | .01 | .24* | .01 | .54*** | .81*** | .50*** | 1 |
|
Study 2: Gay/Straight Attitudes
| |||||||
| IAT | Speeded Self-Report | ||||||
|
| |||||||
| IAT | |||||||
| Speeded Self-Report | .20* | ||||||
| Standard Self-Report | .27* | .70*** | |||||
|
Study 2: Teen Pop/Jazz Attitudes
| |||||||
| IAT | Speeded Self-Report | ||||||
|
| |||||||
| IAT | |||||||
| Speeded Self-Report | .43*** | ||||||
| Standard Self-Report | .40*** | .81*** | |||||
Note. Correlations marked with an *** are significant at the p < .0001, ** at the p < .01, and * at the p < .05.
Appendix Table A2.
Factor loadings relating Gut Reactions to Automatic and Controlled Measures for Studies 1 and 2.
| Study 1: Gay/Straight Attitudes
| |||||||||
|---|---|---|---|---|---|---|---|---|---|
| Two-Factor Direct-Indirect | Loading | Two-Factor Auto-Controlled | Loading | Three-Factor | Loading | ||||
| Direct | Controlled | Controlled | |||||||
| Gut | 1.00 | Actual | .98 | Actual | .98 | ||||
| Actual | .66 | Time 5 | .92 | Time 5 | .83 | ||||
| Time 0 | .85 | Automatic | Auto/Direct | ||||||
| Time 5 | .56 | Gut | 1.00 | Gut | 1.00 | ||||
| Indirect | Time 0 | .85 | Time0 | .85 | |||||
| IAT | .54 | IAT | .19 | Auto/Indirect | |||||
| SPF | .34 | SPF | .33 | IAT | .52 | ||||
| GNAT | .70 | GNAT | .12 | SPF | .73 | ||||
| GNAT | .32 | ||||||||
| Factor Covariances | |||||||||
| Direct <-> Indirect = .43 | Controlled<->Auto = .67 | Controlled <-> Auto/Direct = .67 | |||||||
| Controlled <-> Auto/Indirect = .34 | |||||||||
| Auto/Direct <-> Auto/Indirect = .42 | |||||||||
|
Study 2: Gay/Straight Attitudes
| |||||||||
| Two-Factor Direct-Indirect | Loading | Two-Factor Auto-Controlled | Loading | Three-Factor | Loading | ||||
|
| |||||||||
| Direct | Controlled | Controlled | |||||||
| Slow 1 | .73 | Slow 1 | .92 | Slow 1 | .92 | ||||
| Slow 2 | .63 | Slow 2 | .91 | Slow 2 | .91 | ||||
| Slow 3 | .62 | Slow 3 | .84 | Slow 3 | .84 | ||||
| Fast 1 | .92 | Automatic | Auto/Direct | ||||||
| Fast 2 | .90 | Fast 1 | .25 | Fast 1 | .84 | ||||
| Fast 3 | .84 | Fast 2 | .17 | Fast 2 | .78 | ||||
| Indirect | Fast 3 | .85 | Fast 3 | .75 | |||||
| IAT 1 | .50 | IAT 1 | .76 | Auto/Indirect | |||||
| IAT 2 | .42 | IAT 2 | .73 | IAT 1 | .49 | ||||
| IAT 2 | .43 | ||||||||
| Factor Covariances | |||||||||
| Direct <-> Indirect = .62 | Controlled<->Auto = .79 | Controlled <-> Auto/Direct = .80 | |||||||
| Controlled <-> Auto/Indirect = .49 | |||||||||
| Auto/Direct <-> Auto/Indirect = .34 | |||||||||
|
Study 3: Teen Pop/Jazz Attitudes
| |||||||||
| Two-Factor Direct-Indirect | Loading | Two-Factor Auto-Controlled | Loading | Three-Factor | Loading | ||||
|
| |||||||||
| Direct | Controlled | Controlled | |||||||
| Slow 1 | .91 | Slow 1 | .91 | Slow 1 | .91 | ||||
| Slow 2 | .95 | Slow 2 | .94 | Slow 2 | .96 | ||||
| Slow 3 | .94 | Slow 3 | .94 | Slow 3 | .94 | ||||
| Fast 1 | .65 | Automatic | Auto/Direct | ||||||
| Fast 2 | .77 | Fast 1 | .76 | Fast 1 | .76 | ||||
| Fast 3 | .77 | Fast 2 | .92 | Fast 2 | .92 | ||||
| Indirect | Fast 3 | .91 | Fast 3 | .91 | |||||
| IAT 1 | .51 | IAT 1 | .39 | Auto/Indirect | |||||
| IAT 2 | .60 | IAT 2 | .38 | IAT 1 | .55 | ||||
| IAT 2 | .56 | ||||||||
| Factor Covariances | |||||||||
| Direct <-> Indirect = .62 | Controlled<->Auto = .79 | Controlled <-> Auto/Direct = .79 | |||||||
| Controlled <-> Auto/Indirect = .60 | |||||||||
| Auto/Direct <-> Auto/Indirect = .65 | |||||||||
Acknowledgments
This research was supported by a grant from the National Institute of Mental Health (R01 MH 68447-01) to Brian Nosek. We would like to thank Yoav Bar-Anan, Jesse Graham, Jennifer Joy, and Fred Smyth for their helpful comments.
Appendix
| Study 1: Words used in IAT, GNAT, and SPF | |||
|---|---|---|---|
| pleasant | funny | horrible | Crash |
| delight | wonderful | angry | Evil |
| helpful | triumph | terrible | Humiliate |
| joy | glee | noxious | Disaster |
| sunrise | superb | tragic | Nasty |
| beautiful | marvelous | yucky | Gross |
| smile | laugh | hate | Unpleasant |
| brilliant | cheerful | destroy | Ugly |
| success | enjoy | brutal | Dirty |
|
Study 2: Words used in speeded self-report task
| |||
| jazz (3) | Justin Timberlake | conformity | Peace |
| teen pop (3) | Britney Spears | rebellion | Sunrise |
| gay people (3) | Nick Carter | rich people | Happy |
| straight people (3) | homosexual | poor people | Death |
| Ella Fitzgerald | heterosexual | Male | Poison |
| Britney Spears | George Bush | female | Education |
| John Coltrane | Al Gore | books | Guns |
| Miles Davis | coffee | television | vomit |
| Mandy Moore | tea | flowers | abuse |
|
Study 2: Words used in Jazz/Teen Pop IAT
| |||
| Ella Fitzgerald | Justin Timberlake | celebrating | vulgar |
| Diana Krall | Britney Spears | pleasure | tragic |
| John Coltrane | Nick Carter | friendly | brutal |
| Miles Davis | Mandy Moore | joyful | nasty |
|
Study 2: Words used in Gay/Straight IAT
| |||
| Gay | celebrating | vulgar | |
| Homosexual | pleasure | tragic | |
| Straight | friendly | brutal | |
| Heterosexual | joyful | nasty | |
Footnotes
For Study 1, order of tasks did not significantly influence means or correlations. There was one order effect in Study 2. Participants who completed the Jazz/Teen-Pop IAT before the explicit measures showed a greater IAT effect (M=.22, SD=.29) than those who completed explicit measures first (M=.06, SD=.29), t(108)=2.95, p=.004. However, no differences in correlations were observed.
In Models 2 and 3 the estimated variance of the error term on the gut reaction indictor was negative. This can occur because of small sample size, too few indicators of a latent variable, or high multicolinearity between measured variables (called a Heywood Case; Dillon, Kumar, & Mulani, 1987). To allow for an estimation of χ2, we constrained the error variance of that indicator to 0 (Dillon et al., 1987, Nasser & Wisenbaker, 2003). Because this additional constraint results in an extra degree of freedom, we set the error variance on the gut factor to 0 for all models so none would benefit from the additional degree of freedom.
One might normally be concerned that the relatively small sample size would be underpowered to detect differences in model fits. However, the effects were sufficiently large so that each of the less constrained models showed significantly better model fit than the more constrained models.
Another possibility is that reporting both gut and actual feelings might invoke demand characteristics to report discrepancies. However, there is no reason that this would lead to gut responses loading better with the implicit measures. Also, discrepancies in gut and actual feelings were not similarly observed in foil attitude objects.
It is sometimes assumed that speeded self-report is more similar to automatic than to controlled measures, however, there exists little empirical support. Wilson et al. (2000) are cited for this, but they report an unpublished study in which the speeded report was 3 seconds and the comparison was mean responses, not interindividual correspondence.
Publisher's Disclaimer: This is a PDF file of an unedited manuscript that has been accepted for publication. As a service to our customers we are providing this early version of the manuscript. The manuscript will undergo copyediting, typesetting, and review of the resulting proof before it is published in its final citable form. Please note that during the production process errors may be discovered which could affect the content, and all legal disclaimers that apply to the journal pertain.
References
- Bar-Anan Y, Vianello M, Nosek BA. The Sorting Paired Features Task. 2006 doi: 10.1027/1618-3169.56.5.329. Unpublished Manuscript. [DOI] [PubMed] [Google Scholar]
- Bargh JA. The four horsemen of automaticity: Awareness, efficiency, intention and control in social cognition. In: Wyer R Jr, Srull T, editors. Handbook of social cognition. 2. Hillsdale, NJ: Erlbaum; 1994. pp. 1–40. [Google Scholar]
- Bassili JN, Brown RD. Implicit and explicit attitudes: Research, challenges, and theory. In: Albarracin D, Johnson B, Zanna M, editors. The handbook of attitudes. Hillsdale, NJ: Erlbaum; 2005. pp. 543–574. [Google Scholar]
- Conrey FR, Sherman JW, Gawronski B, Hugenberg K, Groom CJ. Separating multiple processes in implicit social cognition: The QUAD Model of implicit task performance. Journal of Personality and Social Psychology. 2005;89:469–487. doi: 10.1037/0022-3514.89.4.469. [DOI] [PubMed] [Google Scholar]
- Crandall CS, Eshleman A. A justification-suppression model of the expression and experience of prejudice. Psychological Bulletin. 2003;129:414–446. doi: 10.1037/0033-2909.129.3.414. [DOI] [PubMed] [Google Scholar]
- De Houwer J. What are implicit measures and indirect measures of attitudes? Social Psychology Review in press. [Google Scholar]
- Dillon WR, Kumar A, Mulani N. Offending estimates in covariance structure analysis: Comments on the causes of and solutions to Heywood Cases. Psychological Bulletin. 1987;101:126–135. [Google Scholar]
- Fazio RH. Multiple processes by which attitudes guide behavior: The MODE model as an integrative framework. In: Zanna M, editor. Advances in experimental social psychology. Vol. 23. New York: Academic Press; 1990. pp. 75–109. [Google Scholar]
- Fazio RH, Olson MA. Implicit measures in social cognition: Their meaning and use. Annual Review of Psychology. 2003;54:297–327. doi: 10.1146/annurev.psych.54.101601.145225. [DOI] [PubMed] [Google Scholar]
- Fazio RH, Sanbonmatsu DM, Powell MC, Kardes FR. On the automatic activation of attitudes. Journal of Personality and Social Psychology. 1986;50:229–238. doi: 10.1037//0022-3514.50.2.229. [DOI] [PubMed] [Google Scholar]
- Greenwald AG, Banaji MR. Implicit social cognition: Attitudes, self-esteem, and stereotypes. Psychological Review. 1995;102:4–27. doi: 10.1037/0033-295x.102.1.4. [DOI] [PubMed] [Google Scholar]
- Greenwald AG, McGhee DE, Schwartz JLK. Measuring individual differences in implicit cognition: The Implicit Association Test. Journal of Personality and Social Psychology. 1998;74:1464–1480. doi: 10.1037//0022-3514.74.6.1464. [DOI] [PubMed] [Google Scholar]
- Greenwald AG, Nosek BA, Banaji MR. Understanding and using the Implicit Association Test: I. An improved scoring algorithm. Journal of Personality and Social Psychology. 2003;85:197–216. doi: 10.1037/0022-3514.85.2.197. [DOI] [PubMed] [Google Scholar]
- MacCallum RC, Browne MW, Sugawara HM. Power analysis and determination of sample size for covariance structure modeling. Psychological Methods. 1996;1:130–149. [Google Scholar]
- McArdle JJ, Johnson RC, Hishinuma ES, Miyamoto RH, Andrade NN. Structural equation modeling of group differences in CES-D ratings of native Hawaiian and non-Hawaiian high school students. Journal of Adolescent Research. 2001;16:108–149. [Google Scholar]
- Nasser F, Wisenbaker J. A Monte Carlo study investigating the impact of item Parceling on measures of fit in confirmatory factor analysis. Educational and Psychological Measurement. 2003;63:729–757. [Google Scholar]
- Nosek BA, Banaji MR. The go/no-go association task. Social Cognition. 2001;19:625–666. [Google Scholar]
- Nosek BA, Greenwald AG, Banaji MR. Understanding and using the Implicit Association Test: II. Method variables and construct validity. Personality and Social Psychology Bulletin. 2005;31:166–180. doi: 10.1177/0146167204271418. [DOI] [PubMed] [Google Scholar]
- Payne KB. Prejudice and Perception: The role of automatic and controlled processes in misperceiving a weapon. Journal of Personality and Social Psychology. 2001;81:181–192. doi: 10.1037//0022-3514.81.2.181. [DOI] [PubMed] [Google Scholar]
- Payne BK, Jacoby LL, Lambert AJ. Attitudes as accessibility bias: Dissociating automatic and controlled processes. In: Hassan R, Bargh J, Uleman J, editors. The new unconscious. Oxford, England: Oxford University Press; 2005. [Google Scholar]
- Smith ER, DeCoster J. Associative and rule-based processing: A connectionist interpretation of dual-process models. In: Chaiken S, Trope Y, editors. Dual-process theories in social psychology. New York: Guilford Press; 1999. pp. 323–337. [Google Scholar]
- Steiger JH. Point estimate, hypothesis testing, and interval estimation using the RMSEA: Some comments and a reply to Hayduck and Glaser. Structural Equation Modeling. 2000;7:149–162. [Google Scholar]
- Steiger JH, Lind J. Statistically based tests for the number of factors. Paper presented at the annual spring meeting of the Psychometric Society; Iowa City, IA. 1980. May, [Google Scholar]
- Strack F, Deutsch R. Reflective and impulsive determinants of social behavior. Personality and Social Psychology Review. 2004;8:220–247. doi: 10.1207/s15327957pspr0803_1. [DOI] [PubMed] [Google Scholar]
- Wilson TD, Lindsey S, Schooler TY. A model of dual attitudes. Psychological Review. 2000;107:101–126. doi: 10.1037/0033-295x.107.1.101. [DOI] [PubMed] [Google Scholar]