Abstract
Effective transverse relaxation rate (T2*)-weighted echo-planar imaging (EPI) is extensively used for functional magnetic resonance imaging (fMRI), because of its high speed and good sensitivity to the blood oxygenation level-dependent (BOLD) signal. Nevertheless, its use is limited in areas with severe static magnetic field inhomogeneities that cause frequency shifts and T2* relaxation-related distortions of the MR signal along the time-domain (k-space) trajectory, resulting in disperse time-domain signals and generating susceptibility-induced signal losses. Echo planar images are commonly smoothed with k-space spatial low-pass filters to improve the signal-to-noise ratio (SNR) and reduce reconstruction artifacts. Here, we show that when such filters are applied to the dispersed echo-signals (not perfectly centered in k-space), part of the image information from the object is removed, thereby enhancing signal-loss artifacts in the images. To avoid this artifact, the dispersed echo signal has to be refocused before k-space filtering.
Keywords: EPI-GRE, signal loss, k-space, spatial low-pass filter
Introduction
Functional MRI (fMRI) with blood oxygenation-level-dependent (BOLD) contrast is frequently used in neuroscience researches (Bandettini et al., 1992; Kwong et al., 1992; Menon et al., 1993; Ogawa et al., 1992; Turner et al., 1993). Most fMRI studies use gradient-recalled echo EPI (GRE-EPI) pulse sequences , because of its high sensitivity to BOLD-related susceptibility changes (Ogawa et al., 1993). However, EPI is also sensitive to intravoxel dephasing caused by macroscopic magnetic field gradients. Such gradients are generated by differences in susceptibility among various body compartments, such as brain tissue, muscle, bone, and air (Caparelli, 2005; Glover and Law, 2001; Li et al., 1995). In-plane susceptibility-related field gradients disperse the k-space signal (De Panfilis and Schwarzbauer, 2005; Deichmann et al., 2003; Deichmann et al., 2002), and ultimately reduce the intensity of the MR signal in specific brain regions, such as the orbitofrontal cortex and the medial- and inferior-temporal lobes (Finsterbusch and Frahm, 1999; Lipschutz et al., 2001; Ojemann et al., 1997). Furthermore, the signal loss observed in the EPI is not only due to in-plane dispersion of intravoxel magnetization, but it also arises from through-plane intravoxel dispersion (Deichmann et al., 2003; Frahm et al., 1988).
Images acquired with high temporal resolution techniques, such as EPI, typically exhibit a poor SNR (Alexander et al., 2000), in part because fast acquisition methods often employ a large bandwidth (100–200kHz) that entails high-frequency noise in the raw data (Lowe and Sorenson, 1997). For “in vivo” experiments, the MRI noise is composed of physiological noise from the sample and electronic noise of thermal origin from the conductors in the MR equipment (white noise). The statistics of the white noise are spatially invariant; however, the Fourier decomposition of the physiological noise typically peaks at low temporal frequencies (< 1/l0 sec) (Solo et al., 1997). While the level of white noise can be lowered by improving the hardware, such as by advancing the transmit-receive coil, the physiological noise, which rises with increasing signal intensity, can be reduced by increasing the spatial resolution (Kruger et al., 2001; Triantafyllou et al., 2005). Because both kinds of noise degrade the quality of the MRI datasets, affecting the interpretation of the results, low-pass filters are frequently used to eliminate its high-spatial-frequency components. Generally, denoising algorithms assume that noise is an additive Gaussian parameter, because the noise contribution that arise from the scanner’s electronics are additive for each of the real and imaginary parts of the k-space data, uncorrelated and characterized by a zero-mean Gaussian probability-density function (Hoult and Lauterbur, 1979).
The Fermi filter, normally employed in GE scanners (Friedman et al., 2006; Lowe and Sorenson, 1997), and the Hamming filter (Hamming, 1982; Holland et al., 2001; Lowe and Sorenson, 1997) are commonly used for smoothing of fMRI data. These filters usually ensure that the low-frequency data remains intact, but attenuate the high frequency components of the k-space signal. Since the power of the MRI spectrum is greatest at the center of k-space, low-pass filters predominantly eliminate noise information. However, because GRE-EPI acquisitions are highly sensitive to local magnetic field fluctuations generated by susceptibility gradients, the raw GRE-EPI datasets are typically not centered, but are dispersed in the k-space (De Panfilis and Schwarzbauer, 2005; Deichmann et al., 2003; Deichmann et al., 2002). Therefore, when a k-space spatial low-pass filter is applied to a dispersed raw dataset, important parts of the object’s information in the MR image may be attenuated and additional signal loss introduced (Posse, 1992).
Here, we quantify the additional signal loss artifacts resulting from k-space spatial low-pass filtering of GRE-EPI datasets using an iterative phase correction method (Caparelli et al., 2005). Our study was carried out at high field strength (4 Tesla) for different image parameters and head sizes.
Methods
Subjects
The images were acquired from twelve adult healthy volunteers (9 men; 3 women; aged 34 ± 11 years). Before each study, the participants signed a written consent form approved by the Brookhaven National Laboratory’s Institutional Review Board.
Data acquisition
MRI was conducted on a 4 Tesla Varian scanner (Varian, Inc., USA) equipped with a self-shielded whole-body SONATA/Siemens (Siemens AG, Germany) gradient set (maximum gradient strength per channel 44mT/m, slew rate 176 mT/m/ms). Images were acquired using a standard quadrature head coil and a single-shot gradient-echo EPI sequence (20 × 20 cm field-of-view, 4mm-slice thickness, 1-mm gap, coronal orientation, acquisition bandwidth: 200 kHz and 4.9 kHz along the Z-readout and X-phase encoding directions, respectively) with under-the-ramp sampling. Three different EPI-protocols were used to evaluate the effect of matrix size and echo time (TE); EPI-protocol #1: 29 coronal slices, 64×64 matrix size, TE/TR=25/3000 ms, echo spacing = 430 μs; EPI-protocol #2: 31 coronal slices, 48×64 matrix size, TE/TR=25/3000 ms, echo spacing = 410 μs; and, EPI-protocol #3: 31 coronal slices, 64×64 matrix size, TR=5000 ms, echo spacing = 431 μs, and 40 different TE values, from 20 ms to 117.5 ms, 2.5 ms increments. EPI-protocol #2 was used to acquire the fMRI time series in 10 subjects (about 33 slices covering the whole brain, time-frames=84). Full k-space was acquired in all EPI-protocols.
Stimulus paradigm: 2-back working memory
The working memory paradigm (Tomasi et al., 2006) is a blocked design (“Task” blocks: 30 seconds; “Resting” blocks: 30 seconds; 4 “Task”-“Resting” cycles) wherein random alphabetical letters are sequentially presented at a rate of one letter per second, and the subjects were instructed to press a response button whenever the letter currently displayed is identical to the one displayed two events back. The stimuli were presented to the volunteers via MRI-compatible goggles connected to a personal computer.
Data processing
Data reconstruction
All calculations were performed using the interactive data language (IDL, Research System, Inc., Boulder, CO), on a Compaq Alpha workstation XP 1000. The raw data were timereversed (every second k-space line) and a global phase correction was applied to minimize ghost artifacts (Buonocore and Gao, 1997).
To reorganize the k-space, we present here a modified version of the phase correction initially proposed for a half k-space reconstruction (Jesmanowicz et al., 1998). For each slice, an additional M×M matrix, B, was calculated by using N centerlines from the original complex EPI raw-data set, A, and zero-filling the outer k-space lines
| [1] |
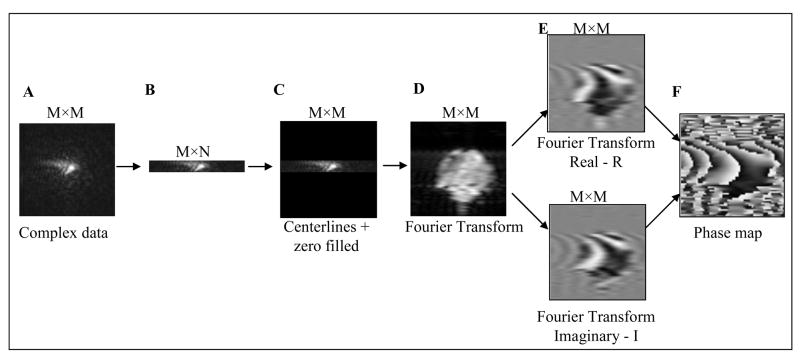
where Ajk and Bjk are, respectively, the jk element of matrixes A and B. After Fourier transformation, a low-resolution phase map was calculated (see Fig. 1) for each slice as follows
Figure 1.
Phase map calculation using an arbitrary number of k-space lines. A) Complex data in k-space after time-reversal and ghost correction; B) Extraction of N centerlines in k-space; C) Zero–filling of M x N matrix; D) Amplitude image after Fourier- transformation; E) Real and imaginary parts of a complex image; and, F) Phase image (Arc-tangent of the imaginary part-to-real part ratio). The K-space maps show the magnitude only.
| [2] |
where φjk is the low-resolution phase map, and Rjk and Ijk are the real and imaginary parts of the Fourier-transformed matrix. The original raw dataset also was Fourier transformed, yielding a complex matrix S, with each element given by Sjk=|Sjk| exp{iθjk}. A phase correction was then applied to the original data in the image domain, using the low-resolution phase-map described in equation 2. Next, the phase corrected image, Scorr, was back-transformed to yield a corrected data set in k-space.
| [3] |
The low-pass Hamming filter was applied in the k-space of the corrected and uncorrected datasets. Image reconstruction was completed with a final Fourier transform (FT) of the filtered k-space datasets and the absolute values were calculated.
The number of centerlines, N, used in the calculation was varied to maximize the image’s quality. Specifically, an iterative algorithm was developed in IDL that used N=2*n (n = 1, … , 32) k-space centerlines. The relative mean-signal change, S̄Rel (n) , was calculated for the total imaging volume, and for each phase correction step, n, comparing the mean-signal of the corrected image, S̄(n) , with that of the uncorrected one , S̄(n = 0) = S̄0.
| [4] |
The mean-signal of the total image volume, composed by L slices, is defined by
| [5] |
The iterative phase correction was determined to be completed when the difference between relative mean signal differences S̄Rel (n) − S̄Rel (n − 1) was below 1%.
Statistical analyses
Three different reconstruction methods were used to evaluate the impact of the proposed method on BOLD, SNR, and the MR signal: (1) Phase corrected and k-space filtered, (2) phase uncorrected and k-space filtered, and, (3) phase uncorrected and k-space unfiltered. Thus, three time series were generated from each individual imaging dataset acquired under EPI-protocol #2.
Pre-processing
For each time series the first four volumes were discarded to avoid non-equilibrium effects. Subsequent analyses were performed with the statistical parametric mapping package SPM2 (Wellcome Department of Cognitive Neurology, London, UK). The images were realigned to correct for head motion, normalized to the Talairach frame, and smoothed with an 8-mm full-width-half-maximum Gaussian kernel.
BOLD signal
The general linear model was used to estimate the amplitude of the BOLD signal in the images generated with the reconstruction methods (1) and (2). The blocked analysis was based on a box-car design convolved with a canonical hemodynamic response function (HRF) and a high-pass filter (1/128 seconds frequency cutoff).
SNR calculation
For each voxel in the brain, we calculated the SNR as the ratio between the average and the standard deviation of the MRI signal in the voxel as a function of time. This voxel-wise SNR-calculation was carried out for the fMRI time series generated with the reconstruction methods (1) and (3), resulting in two SNR-maps per subject.
Group analysis
Statistical analyses were performed to compare maps of the BOLD responses, SNR, and the MR signal amplitude of the first imaging volume (after standard SPM realignment, normalization, and smoothing) for each subject using random effects analyses in SPM (paired T-tests). To evaluate benefit of the proposed reconstruction method on BOLD, SNR, and the MR signal, images from the following reconstruction methods were compared: a) Method (1) against method (2) for BOLD and the MR signal; b) method (1) against method (3) for SNR and the MR signal. For all group analyses, a pcorr < 0.05, corrected for multiple comparisons was considered statistically significant.
Results
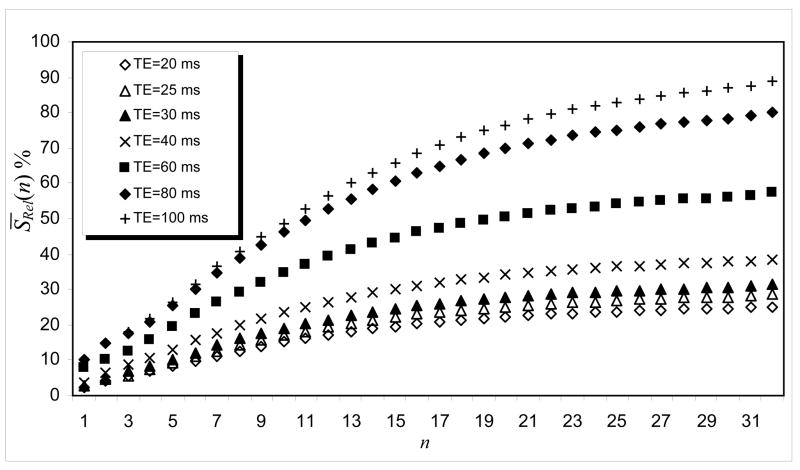
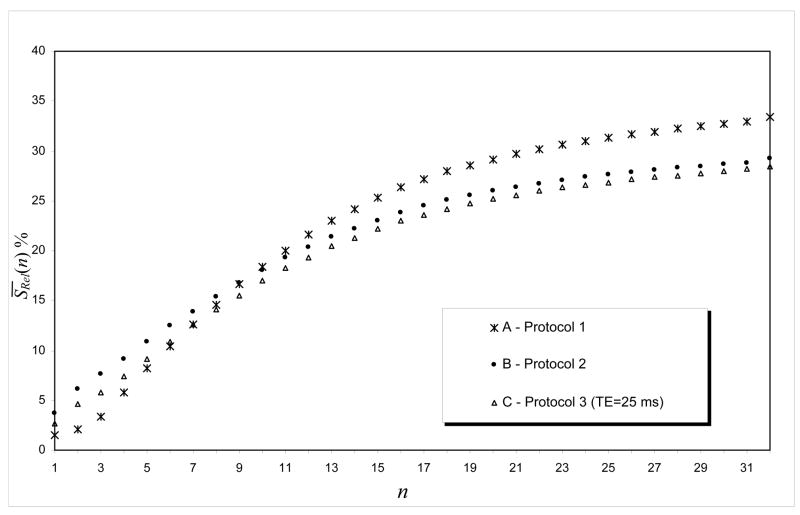
Figures 2 and 3 present the relative mean-signal, S̄Rel (n) , for n = 1, …, 32, for EPI images obtained with the three EPI-protocols described under Methods. They illustrate that the final correction depends on the number of k-space lines used to calculate the phase map. For all three EPI-protocols, the best result was obtained when we used all 64 lines in the k-space to re-organize the k-space data, since those lines in the phase direction finished before reaching the expected convergence criterion. Signal recovery was larger for EPI-protocol 1 than for EPI-protocols 2 and 3 (Fig 3) and increased with TE (Fig 2). In addition, the relative percentage change in the mean-signal, S̄Rel (n) , was slightly higher for EPI-protocol #2 than for EPI-protocol #3; however, the difference in their S̄Rel (n) remained constant for each step of the phase correction (Fig. 3). These results show that the additional signal loss effect caused by k-space low-pass filtering depends on the sequence parameters and also on the size or position of the person’s head inside the MRI scanner.
Figure 2.
S̄Rel as a function of the number of k-space lines for different TE values (64×64 matrix size, 31 slices, TR=5000ms; EPI-protocol #3).
Figure 3.
S̄Rel (n) as a function of the number of k-space lines for different EPI-protocols (TE = 25 ms): A) EPI-protocol #1 (64 × 64, 29 slices), B) EPI-protocol #2 (48 × 64, 31 slices) and C) EPI-protocol #3 (64 × 64, 31 slices).
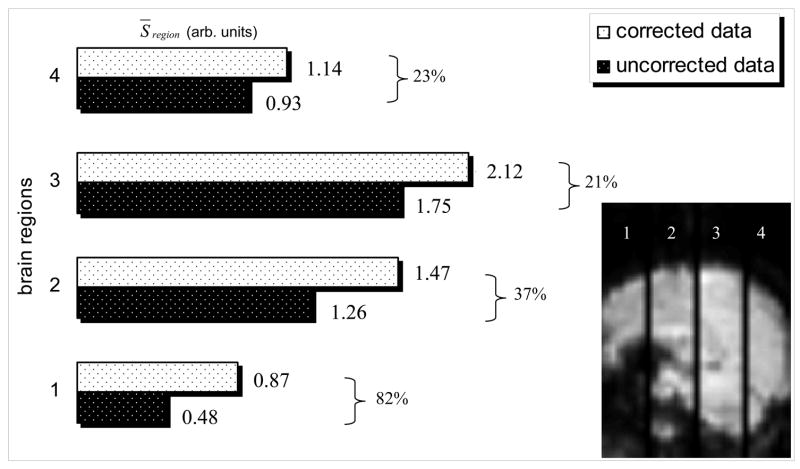
Figures 4, 5, and 6, comparing the corrected images (N=64) with the original phase-uncorrected ones, illustrate the improvements due to k-space reorganization. Figure 4 exemplifies the susceptibility-related k-space dispersion (B1), and how much signal loss (A1) is enhanced (A2) if the dispersed k-space data is low-pass filtered (B2). However, when a k-space low-pass filter is applied to the corrected k-space signal (B3) the MR signal loss is not enhanced (A3). We point out that avoiding the use of k-space filtering prevents additional signal losses (A1, A3); however, using k-space filtering after phase correction does not lead to additional signal losses, and improves both SNR (Figs. C1, C2 and C3) and signal intensity (SI; Figs. D1, D2 and D3), which is proportional to the BOLD sensitivity (BS) and the TE used (Deichmann et al., 2002), in several brain regions. Figure 5 depicts how much this additional signal loss artifact affects image quality and the BOLD signal. Compared to phase-uncorrected low-pass filtered images, the phase-corrected and low-pass-filtered dataset exhibits higher BOLD contrast-to-noise during the 2-back WM task in some brain areas (Fig. 5A) and improved SI (BS) in regions near the sinus cavity, temporal lobes, and the brain’s surface (Fig. 5B). Finally, Fig. 6 quantifies the artifact for four different brain regions limited by the absence of three coronal slices.
Figure 4. GRE-EPI k-space signal dispersion and image signal loss artifact for a coronal slice in the frontal lobe.
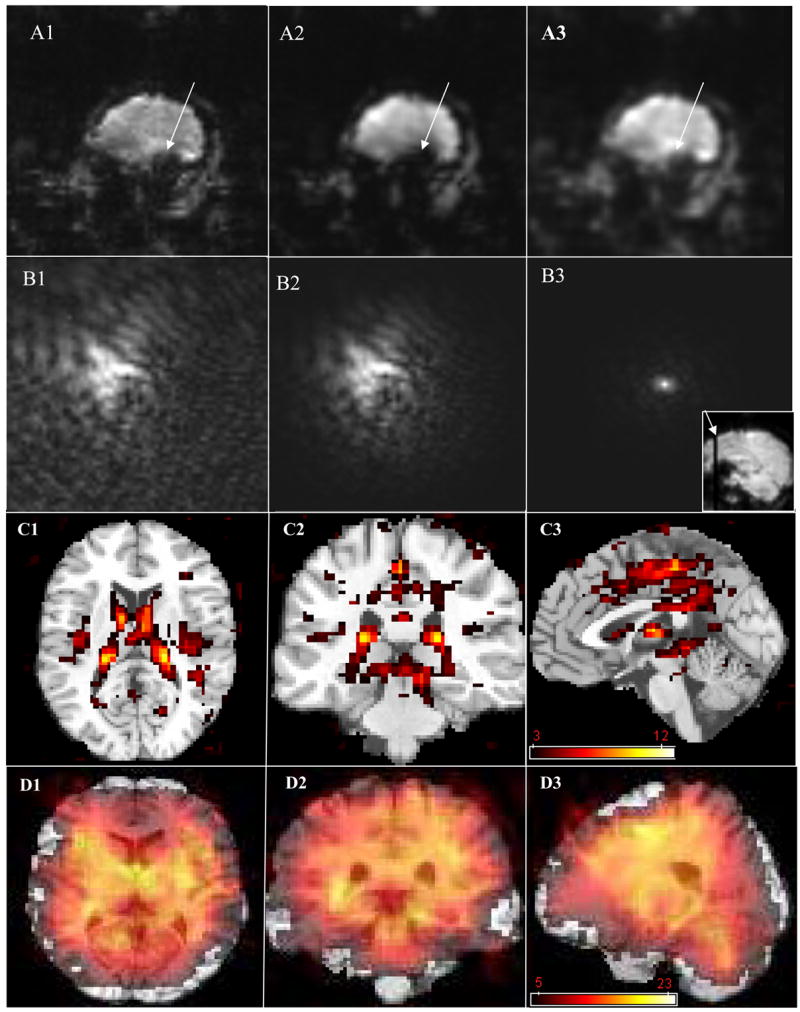
(A1, A2) without phase correction, (A3) with phase correction, and (B1, B2, and B3) respective k-space. A1 and B1: image and k-space domains without Hamming filter. A2, B2, A3, and B3 are the results with the Hamming filter. A sagittal localizer EPI image is at bottom-right corner of figure B3. The statistical maps of differential SNR (C1–C3) and signal intensity (D1–D3) compare the results for two reconstruction methods: (1) phase-correction (all 64 k-space lines) and k-space filtering and (3) the raw data. The three orthogonal views of an anatomical T1-weighted image and the superimposed statistical (color-coded) maps highlight significant differences between the methods (pcorrected < 0.05, minimum cluster size = 10 voxels). Sample size: 10 subjects.
Figure 5.
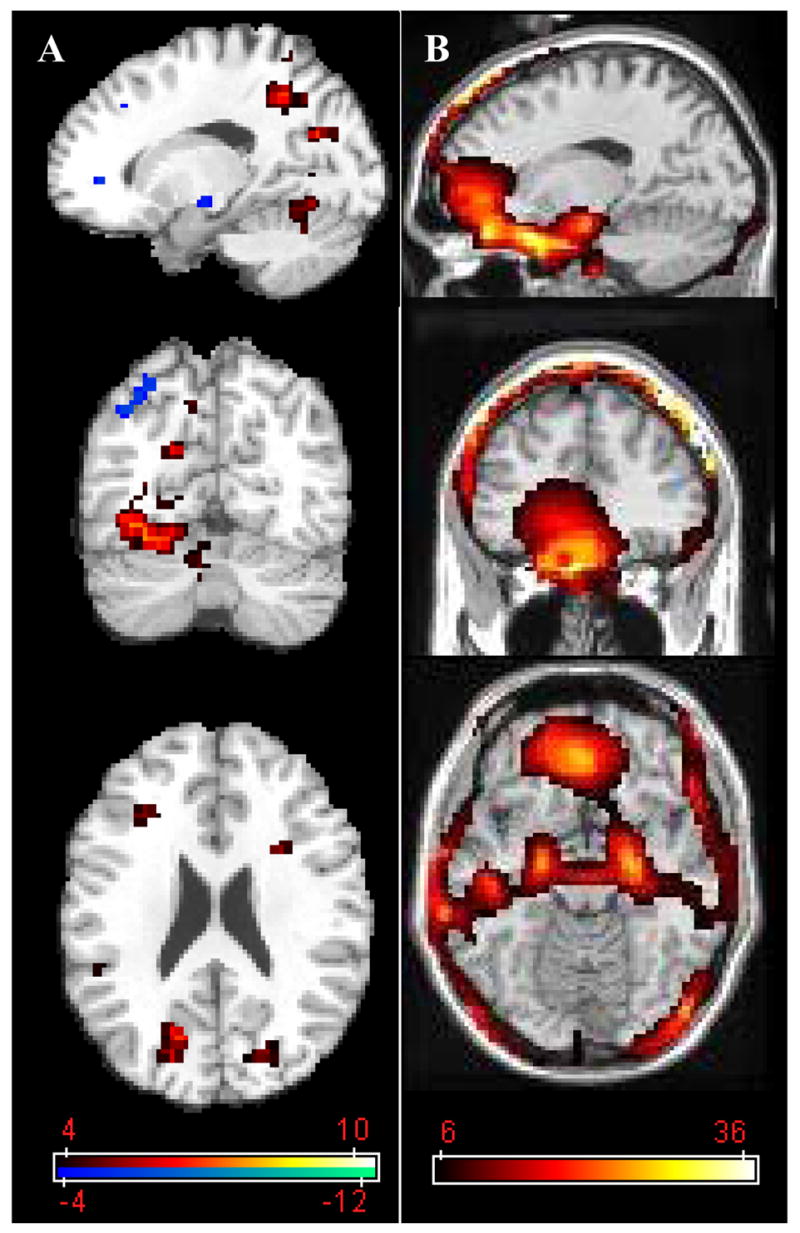
Statistical maps reflecting the phase correction-related increases in BOLD (A) and MR (B) signals. The contrasted phase-corrected vs. uncorrected datasets were low-pass filtered in k-space. Activation paradigm: 2-back verbal working memory. Sample size: 10 healthy volunteers. All N= 64 phase-encoding lines were used for phase refocusing. Color-coded statistical maps with a threshold pcorrected < 0.05 (minimum cluster size = 10 voxels) are superimposed on three orthogonal views of an anatomical T1-weighted image.
Figure 6.
The mean-signal, S̄region , calculated for four different brain regions (showed in the sagittal image right-bottom), before and after phase correction, shows the percentage signal increase due to the phase correction (N=64).
Discussion
Gradient-recalled-echo EPI is a frequently used MRI sequence for fMRI studies due to its high sensitivity to static or dynamic (i.e., BOLD) susceptibility-related magnetic field gradients (Caparelli, 2005; Glover and Law, 2001; Li et al., 1995). This sequence is particularly sensitive to susceptibility gradients along the phase encoding direction, because the phase encoding bandwidth for EPI is significantly lower than the readout bandwidth; consequently, the susceptibility gradients spuriously encode the signal during the inter echo time, dispersing the k-space (De Panfilis and Schwarzbauer, 2005; Deichmann et al., 2003; Deichmann et al., 2002), and generating image artifacts in MRI (Finsterbusch and Frahm, 1999; Lipschutz et al., 2001; Ojemann et al., 1997).
k-space spatial low-pass filtering is commonly used in fMRI to improve the image’s SNR (Friedman et al., 2006; Hamming, 1982; Holland et al., 2001; Lowe and Sorenson, 1997). However, when these filters are applied to disperse k-space data they attenuate important Fourier components of the MRI signal (Fig 4B)(Posse, 1992). The present work shows that such additional signal losses are more significant for longer echo times (Fig 2) because the susceptibility gradients disperse the k-space signal proportionally to the TE (Deichmann et al., 2002; Gorno-Tempini et al., 2002). This artifact also varies considerably with the size/shape or position of the person’s head inside the MRI scanner (Fig. 3) because k-space dispersion depends upon local changes in susceptibility between tissue compartments (Caparelli, 2005; Glover and Law, 2001; Li et al., 1995; Turner and Ordidge, 2000). Our work also shows that the additional signal loss was slightly affected by the different echo spacing and image resolution used in EPI-protocols #2 and #3 (Fig. 3), and this effect was stronger for those brain regions that are more affected by susceptibilities effects (Figs. 5B and 6) in agreement with previous studies (De Panfilis and Schwarzbauer, 2005; Deichmann et al., 2003; Finsterbusch and Frahm, 1999; Lipschutz et al., 2001; Ojemann et al., 1997).
The phase correction method refocuses the k-space signal and eliminates the additional signal loss during k-space low-pass filtering (Fig. 4B3), thereby improving imaging quality, BS, and the estimation of the BOLD signal (Figs. 4 and 5). This method uses a variable number of centerlines of the k-space to calculate the phase map. The optimum correction was obtained when the entire k-space was included in the phase map calculation (N=64); thus, a one-step correction using all k-space lines will fully remove the phase information in the complex image (φjk = θjk ; see equations 3 and 4) (Chen et al., 2003) and yield the best correction.
Finally, this work demonstrates the effect of phase correction and filtering on the BOLD signal for GRE-EPI datasets (Fig. 5). Our findings offer a potential explanation for the filter-dependent differences in the BOLD signal reported by Friedman and colleagues in their multi-center multi-field study (Friedman et al., 2006). In principle, k-space low-pass filters suppress only the high frequency data (noise) and preserve the low frequency data, thus spatial filtering should not entail significant differences in fMRI results from different centers. However, our results reveal that filtering can also affect the low frequency components of the image if the k-space signal is dispersed. Hence, the filter-dependence of the BOLD signal observed by Friedman and colleagues probably reflects the utilization of k-space low-pass filters on dispersed raw-image datasets. Therefore, phase correction before k-space low-pass filtering could minimize the reported differences in the BOLD signal from different research centers.
Conclusions
We evaluated the additional signal loss artifact that occurs when spatial low-pass filters are applied to the k-space of GRE-EPI datasets. EPI data are strongly affected by the susceptibility-related dispersion of the MR signal in k-space. Thus, filtering dispersed k-space datasets enhances signal loss artifacts in GRE-EPI. Here we show that refocusing the echo signal prior low-pass filtering minimizes this artifact. Our results demonstrate that this additional signal loss artifact depends on pulse sequence parameters as well as size and shape of the subjects’ heads, and it is substantial in those brain areas that are more affected by susceptibility effects. K-space data refocusing prior k-space spatial low-pass filters can improve image quality in fMRI studies.
Acknowledgments
This work was supported by grants from the DOE (OBER), NIH (GCRC 5-MO1-RR-10710) and NIDA (R03 DA 017070-01).
Footnotes
Notice: This manuscript has been authored by Brookhaven Science Associates, LLC under Contract No. DE-AC02-98CHI-886 with the U.S. Department of Energy. The United States Government retains, and the publisher, by accepting the article for publication, acknowledges, a world-wide license to publish or reproduce the published form of this manuscript, or allow others to do so, for the United States Government purposes.
Publisher's Disclaimer: This is a PDF file of an unedited manuscript that has been accepted for publication. As a service to our customers we are providing this early version of the manuscript. The manuscript will undergo copyediting, typesetting, and review of the resulting proof before it is published in its final citable form. Please note that during the production process errors may be discovered which could affect the content, and all legal disclaimers that apply to the journal pertain.
References
- Alexander ME, Baumgartner R, Summers AR, Windischberger C, Klarhoefer M, Moser E, et al. A wavelet-based method for improving signal-to-noise ratio and contrast in MR images. Magnetic Resonance Imaging. 2000;18:169–180. doi: 10.1016/s0730-725x(99)00128-9. [DOI] [PubMed] [Google Scholar]
- Bandettini PA, Wong EC, Hinks RS, Tikofky RS, Hyde JS. Time course EPI of human brain function during task activation. Magnetic Resonance Medicine. 1992;25:390–397. doi: 10.1002/mrm.1910250220. [DOI] [PubMed] [Google Scholar]
- Buonocore MH, Gao L. Ghost artifact reduction for echo plannar imaging using image phase correction. Magnetic Resonance in Medicine. 1997;38:89–100. doi: 10.1002/mrm.1910380114. [DOI] [PubMed] [Google Scholar]
- Caparelli EC. Can Motion Artifacts be Completely Removed from fMRI-Activation Maps? Current Medical Imaging Reviews. 2005;1:253–264. [Google Scholar]
- Caparelli EC, Tomasi D, Ernst T. Iterative Phase Correction to Minimize Signal Loss in EPI. ISMRM Workshop on Methods for Quantitative Diffusion of Human Brain; Alberta, Canada. 2005. [Google Scholar]
- Chen NK, Dickey CC, Yoo SS, Guttmann CR, Panych LP. Selection of voxel size and slice orientation for fMRI in the presence of susceptibility field gradients: application to imaging of the amygdala. Neuroimage. 2003;19:817–825. doi: 10.1016/s1053-8119(03)00091-0. [DOI] [PubMed] [Google Scholar]
- De Panfilis C, Schwarzbauer C. Positive or negative blips? The effect of phase encoding scheme on susceptibility-induced signal losses in EPI. Neuroimage. 2005;25:112–121. doi: 10.1016/j.neuroimage.2004.11.014. [DOI] [PubMed] [Google Scholar]
- Deichmann R, Gottfried J, Hutton C, Turner R. Optimized EPI for fMRI studies of the orbitofrontal cortex. Neuroimage. 2003;19:430–441. doi: 10.1016/s1053-8119(03)00073-9. [DOI] [PubMed] [Google Scholar]
- Deichmann R, Josephs O, Hutton C, Corfield D, Turner R. Compensation of susceptibility-induced BOLD sensitivity losses in echo-planar fMRI imaging. Neuroimage. 2002;15:120–135. doi: 10.1006/nimg.2001.0985. [DOI] [PubMed] [Google Scholar]
- Finsterbusch J, Frahm J. Single-shot line scan imaging using stimulated echoes. Journal Magnetic Resonance. 1999;137:144–153. doi: 10.1006/jmre.1998.1642. [DOI] [PubMed] [Google Scholar]
- Frahm J, Merboldt KD, Hanicke W. Direct FLASH MR imaging of magnetic field inhomogeneities by gradient compensation. Magnetic Resonance in Medicine. 1988;6:474. doi: 10.1002/mrm.1910060412. [DOI] [PubMed] [Google Scholar]
- Friedman L, Glover GH, Krenz D, Magnotta V. Reducing inter-scanner variability of activation in a multicenter fMRI study: role of smoothness equalization. Neuroimage. 2006;32:1656–1668. doi: 10.1016/j.neuroimage.2006.03.062. [DOI] [PubMed] [Google Scholar]
- Glover G, Law C. Spiral-in/out BOLD fMRI for increased SNR and reduced susceptibility artifacts. Magnetic Resonance in Medicine. 2001;46:515–522. doi: 10.1002/mrm.1222. [DOI] [PubMed] [Google Scholar]
- Gorno-Tempini ML, Hutton C, Josephs O, Deichmann R, Price C, Turner R. Echo time dependence of BOLD contrast and susceptibility artifacts. Neuroimage. 2002;15:136–142. doi: 10.1006/nimg.2001.0967. [DOI] [PubMed] [Google Scholar]
- Hamming RW. Digital Filters. Englewood Cliffs, NJ: Prentice-Hall, Inc; 1982. [Google Scholar]
- Holland SK, Plante E, Weber Byars A, Strawsburg RH, Schmithorst VJ, Ball WSJ. Normal fMRI brain activation patterns in children performing a verb generation task. Neuroimage. 2001;14:837–843. doi: 10.1006/nimg.2001.0875. [DOI] [PubMed] [Google Scholar]
- Hoult D, Lauterbur P. The sensitivity of the zeugmatographic experiment involving human samples. Journal of Magnetic Resonance. 1979;34:425–433. [Google Scholar]
- Jesmanowicz A, Bandettini PA, Hyde JS. Single-shot half k-space high-resolution gradient-recalled EPI for fMRI at 3 T. Magnetic Resonance in Medicine. 1998;40:754–762. doi: 10.1002/mrm.1910400517. [DOI] [PubMed] [Google Scholar]
- Kruger G, Kastrup A, Glover GH. Neuroimaging at 1.5 T and 3.0 T: comparison of oxygenation-sensitive magnetic resonance imaging. Magnetic Resonance in Medicine. 2001;45:595–604. doi: 10.1002/mrm.1081. [DOI] [PubMed] [Google Scholar]
- Kwong KK, Billeveau JW, Chesler DA, Goldberg IE, Weisskoff RM, Poncelet BP, et al. Dynamic magnetic resonance imaging of human brain activity during primary sensory stimulation. Proceedings of the National Academy of Sciences of the United States of America; 1992. pp. 5675–5679. [DOI] [PMC free article] [PubMed] [Google Scholar]
- Li S, Williams GD, Frisk TA, Arnold BW, Smith MB. A computer simulation of the static magnetic field distribution in the human head. Magnetic Resonance in Medicine. 1995;34:268–275. doi: 10.1002/mrm.1910340219. [DOI] [PubMed] [Google Scholar]
- Lipschutz B, Friston K, Ashburner J, Turner R, Price C. Assessing study-specific regional variations in fMRI signal. Neuroimage. 2001;13:392–398. doi: 10.1006/nimg.2000.0687. [DOI] [PubMed] [Google Scholar]
- Lowe MJ, Sorenson JA. Spatially filtering functional magnetic resonance imaging data. Magnetic Resonance Imaging. 1997;37:723–729. doi: 10.1002/mrm.1910370514. [DOI] [PubMed] [Google Scholar]
- Menon RS, Ogawa S, Tank DW, Ugurbil K. 4 Tesla gradient recalled echo characteristics of photic stimulation-induced signal changes in the human primary visual cortex. Magnetic Resonance in Medicine. 1993;30:380–386. doi: 10.1002/mrm.1910300317. [DOI] [PubMed] [Google Scholar]
- Ogawa S, Menon RS, Tank DW, Kim SG, Merkle H, Ellermann JM, et al. Functional brain mapping by blood oxygenation level-dependent contrast magnetic resonance imaging. A comparison of signal characteristics with a biophysical model. Biophysical Journal. 1993;64:803–812. doi: 10.1016/S0006-3495(93)81441-3. [DOI] [PMC free article] [PubMed] [Google Scholar]
- Ogawa S, Tank DW, Menon RS, Ellerman JM, Kim SG, Merkle H, et al. Intrinsic signal changes accompanying sensory stimulation: Functional brain mapping with magnetic resonance imaging. Proceedings of the National Academy of Sciences of the United States of America; 1992. pp. 5951–5955. [DOI] [PMC free article] [PubMed] [Google Scholar]
- Ojemann JG, Akbudak E, Snyder AZ, McKinstry RC, Raichle ME, Conturo TE. Anatomic localization and quantitative analysis of gradient refocused echo-planar fMRI susceptibility artifacts. Neuroimage. 1997;6:156–167. doi: 10.1006/nimg.1997.0289. [DOI] [PubMed] [Google Scholar]
- Posse S. Direct imaging of magnetic field gradients by group spin-echo selection. Magnetic Resonance in Medicine. 1992;25:12–29. doi: 10.1002/mrm.1910250103. [DOI] [PubMed] [Google Scholar]
- Solo V, Brown E, Weisskoff R. A signal processing approach to functional MRI for brain mapping. International Conference on Image Processing, IEEE Computer Society; 1997. pp. 121–123. [Google Scholar]
- Tomasi D, Chang L, Caparelli EC, Telang F, Ernst T. The human inmmunodeficiency virus reduces network capacity: acoustic noise effect. Annals of Neurology. 2006;59:419–423. doi: 10.1002/ana.20766. [DOI] [PMC free article] [PubMed] [Google Scholar]
- Triantafyllou C, Hoge RD, Krueger G, Wiggins CJ, Potthast A, Wiggins GC, et al. Comparison of physiological noise at 1.5 T, 3 T and 7 T and optimization of fMRI acquisition parameters. Neuroimage. 2005;26:243–250. doi: 10.1016/j.neuroimage.2005.01.007. [DOI] [PubMed] [Google Scholar]
- Turner R, Jezzard P, Wen H, Kwong KK, LeBihan D, Zeffiro T, et al. Functional mapping of the human visual cortex at 4 and 1.5 Tesla using deoxygenation contrast. EPI Magnetic Resonance Medicine. 1993;29:277–279. doi: 10.1002/mrm.1910290221. [DOI] [PubMed] [Google Scholar]
- Turner R, Ordidge RJ. Technical challenges of functional magnetic resonance imaging. IEEE engineering in medicine and biology magazine. 2000;19:42–54. doi: 10.1109/51.870231. [DOI] [PubMed] [Google Scholar]


