

Abstract
Transforming growth factor-β1 (TGF-β1) is upregulated by inflammatory mediators in several neurological diseases/disorders where it either participates in the pathology or provides protection. Often, the biological outcome of TGF-β1 is dependent upon changes in gene expression. Recently, we demonstrated that TGF-β1 enhances astrocytic nitric oxide production induced by lipopolysaccharide (LPS) plus interferon-γ (IFNγ) by increasing the number of astrocytes in a population that express NOS-2. The purpose of this study was two-fold: 1) to determine whether this effect occurs more generally by assessing the effect of TGF-β1 on another pro-inflammatory gene, cyclooxygenase-2 (COX-2); and 2) to assess stimulus specificity. We found that TGF-β1 augmented LPS plus IFNγ-induced COX-2 mRNA and protein expression, by nearly tripling the number of astrocytes that express COX-2. The effect was not stimulus-specific as TGF-β1 enhanced the number of astrocytes that expressed both COX-2 and NOS-2 protein when either IL-1β or TNFα was used in lieu of LPS. Collectively, these results suggest that TGF-β1 augments overall protein expression levels of select pro-inflammatory genes in astrocytes in a promiscuous manner by reducing the magnitude of noise in the cellular population.
Keywords: LPS, IFNγ, TNF-α, IL-1β, COX-2, NOS-2, heterogeneity, astrocytes, nitric oxide PGE2
Introduction
Clonal populations of cells exhibit substantial phenotypic variation and astrocytes are no exception [1–3]. It has been argued that this variation is not an innate property of astrocytes but instead reflects a plasticity tailored to suit the needs of different microenvironments [4]. Indeed, evidence suggests that astrocytic gene expression can be influenced by environmental factors such as the presence of surrounding cells (e.g., neurons) through either cell-derived soluble factors alone or contact-dependent mechanisms [5–11]. Although the particular microdomain in which an astrocyte resides in vivo likely plays a major role in influencing its gene expression pattern, certain forms of astrocyte heterogeneity appear to be innate. For instance, astrocytes within a given brain region and, moreover, in a defined environment in culture still exhibit heterogeneous gene expression profiles and functionalities [12–17]. Cortical astrocytes maintained in a controlled cell culture environment exhibit divergent resting membrane potentials [18] and differing expression profiles of certain genes including that of glutamate transporters and receptors [17]. Further, astrocytes in culture maintained in the same microenvironment exhibit differential abilities to express NOS-2 in response to LPS or LPS plus IFN-γ stimulation [14, 19]. Interestingly, exposure to TGF-β1 increased the proportion of astrocytes that expressed NOS-2 protein [14]. As astrocytic NOS-2 can be induced by several different combinations of cytokines [14, 20–23] in the absence of TGF-β1, the question remained as to whether this population-based upregulation of NOS-2 gene expression by TGF-β1 was stimulus- and/or gene-specific. Herein, we demonstrate that TGF-β1 also enhanced COX-2 gene expression by increasing the pool of astrocytes that expressed this protein and this occurred, for both COX-2 and NOS-2, without stimulus-specificity.
Materials and Methods
Materials
Cytosine β-D-arabinofuranoside and leucine methyl ester (LME) were purchased from Sigma Chemical. Human recombinant TGF-β1, mouse recombinant IFN-γ and mouse recombinant IL-1β were purchased from R&D Systems. LPS (E.coli 0127:B8) was obtained from DIFCO Laboratories. Recombinant mouse TNF-α was purchased from Alexis Biochemicals. The mouse monoclonal β-actin antibody was obtained from Sigma Chemical Co. The rabbit polyclonal NOS-2 was purchased from Upstate Cell Signaling Solutions. The rabbit polyclonal COX-2 antibody was purchased from Cayman Chemical.
Cell Culture
Purified primary astrocyte cultures were prepared from postnatal CD1 mice (1–3 days) as described in detail [13]. Briefly, cerebral cortices were dissociated and cells plated in 15mm 24-well plates or 35mm 6-well plates in media stock (MS) supplemented with 10% fetal bovine serum (FBS), 10% iron-supplemented calf serum (CS), 2mM L-glutamine, 50IU/ml penicillin, 50μg/ml streptomycin, and 10ng/ml epidermal growth factor. MS consisted of L-glutamine-free modified Eagle’s medium (Earle’s salt) supplemented with glucose and sodium bicarbonate to a final concentration of 25.7mM and 28.2mM, respectively. Once the astrocytes reached confluence, cultures were treated once with 8μM cytosine β-D-arabinofuranoside for a duration of 5–6 days; this substantially reduces microglial contamination [13]. Thereafter, cultures were maintained in growth medium consisting of MS plus 10% CS, 50IU/ml penicillin, 50μg/ml streptomycin and 2mM L-glutamine. Purified astrocyte cultures were generated by eradicating residual microglia with a 1 hr, 75mM LME treatment one day prior to experimentation as described [13].
Cell stimulation
Astrocyte cultures (14–31 DIV) were pre-treated for 24hr with TGF-β1 (3ng/ml) or its vehicle (750ng/ml BSA plus 3μM HCl) in a stimulation medium consisting of L-glutamine-free DMEM supplemented with 5% CS, 2mM L-glutamine, 50IU/ml penicillin, and 50μg/ml streptomycin. NOS-2 and COX-2 were then induced with LPS (2μg/ml) alone, LPS plus IFNγ (3ng/ml), TNF-α (1μg/ml) plus IFNγ, or IL-1β (3ng/ml) plus IFNγ.
Measurement of NO
Twelve hr following cytokine stimulation, NOS-2-derived nitric oxide (NO) production was assessed by measurement of nitrite, a stable oxidative breakdown product of NO [24], that accumulated in the cell culture medium. Supernatant (100μl) was mixed with Griess Reagent (100μl) prepared fresh by combining 1 part 0.1% (w/v) sulfanilamide in 60% (v/v) acetic acid with 1 part 0.1% (w/v) napthylenediamine dihydrochloride in distilled H2O. The absorbance at 550nm was measured spectrophotometrically using a microtiter plate reader (Thermolabs). Results are expressed as μM nitrite + SEM.
Measurement of PGE2
Thirty-two to 48 hr following cytokine stimulation, cell culture medium was collected and frozen at −80°C. The amount of Prostaglandin E2 (PGE2) accumulated in the supernatant was measured via EIA according to the manufacturer’s instructions (Caymen Chemical). Samples were diluted –in this case 1/5 for basal and 1/15 for all other conditions– to ensure that absorbance values fell within the linear range of the assay. Results are expressed as ng/ml + SEM.
Immunoblot analysis
Protein lysates were generated from cell cultures as previously described [14]. Protein concentrations were determined using the BCA Assay (Pierce). Ten-20μg protein was separated via SDS-PAGE (8% polyacrylamide gel) and then electrophoretically transferred to nitrocellulose (0.2μm; Biorad). The membrane was washed twice with H2O (20ml; 5min), blocked (1hr; ≈25°C), and blotted with a mouse monoclonal β-actin antibody (2.8μg/ml) and either a NOS-2 (0.67μg/ml; Upstate Cell Signaling Solutions) or COX-2 (0.25μg/ml; Cayman) rabbit polyclonal antibody. Proteins were detected using the WesternBreeze Immunodetection Kit (Invitrogen) per the manufacturer’s instructions. Results were recorded on X-Ray film (GE Healthcare UK, Ltd.).
Quantitative Reverse Transcriptase-Polymerase Chain Reaction (qRT-PCR)
Total RNA was extracted from cultures using TRIzol Reagent (Invitrogen) and suspended in RNase-free H2O (Cellgro, Mediatech). RNA was quantified spectrophotometrically at 260nm (GeneQuant; Pharmacia) and first-strand cDNA synthesized from 0.5μg RNA using MMLV reverse transcriptase primed with oligo(dT)(12–18) as previously described [14, 25]. cDNA (4μl) was subjected to Real-Time PCR in 25μl singleplex reaction containing either mouse COX-2 or mouse β-actin Assay-On-Demand primers and probes along with Taqman Universal PCR Master Mix (Applied Biosystems). Relative quantification of COX-2 cDNA was calculated using the comparative cycle threshold (CT) method wherein COX-2 CT levels were normalized to β-actin CT values from the same sample. The normalized CT values were then compared to a calibrator value (2 hr LPS + IFNγ treatment) to determine the relative fold increase in COX-2 mRNA levels over the calibrator. Results were collected and analyzed using Applied Biosystems software.
Quantification of the percentage of COX-2 and NOS-2 expressing astrocytes
COX-2 and NOS-2 protein was detected by indirect immunofluorescence. Cultures were fixed with a freshly prepared solution of 50% acetone/50% methanol (5min) and incubated for 7min with 0.25% Triton X-100 (PBS). Cells were washed with PBS and non-specific binding sites blocked with 10% normal goat serum (NGS) in PBS (25°C, 30min). In single labeling experiments, a rabbit polyclonal NOS-2 (2μg/ml; Cell Signaling) or COX-2 antibody (2.5μg/ml; Cayman) was added in PBS containing 5% NGS (4°C overnight) and the binding visualized using a Cy3-conjugated antibody directed against rabbit IgG [1 hr (25°C)] (7.5μg/ml; Jackson ImmunoResearch). To localize COX-2 to astrocytes or to assess co-localization with NOS-2, the aforementioned rabbit polyclonal COX-2 antibody, a rat monoclonal GFAP antibody (1μg/mL, Zymed) or a mouse monoclonal NOS-2 antibody were employed. COX-2, GFAP and NOS-2 were visualized with goat anti-rabbit Cy3 (7.5μg/ml; Jackson ImmunoResearch), goat anti-rat FITC (7.5μg/mL; Jackson ImmunoResearch), and a goat anti-mouse Alexa488-conjugated antibody (10μg/ml; Molecular Probes), respectively. DAPI (0.2μg/ml) was used to visualize nuclei. Three to five different fields of view (40x magnification) per culture well were captured using a CRX digital camera (Digital Video Camera Co) mounted on an Olympus IX50 inverted microscope outfitted with epifluorescence and processed identically using Adobe Photoshop software. For each image, the total number of DAPI positive nuclei was calculated using Scion NIH Image software while the number of NOS-2 or COX-2 positive cells was manually counted. The percent of NOS-2 or COX-2 positive cells per image was calculated by dividing the number of positive cells by the total number of cells in each field (i.e., DAPI-labeled nuclei). Data are expressed as the mean % NOS-2 or % COX-2 positive cells + SEM. Data were transformed (arcsine square root of the percentage data) prior to post-hoc statistical analysis [26]. For COX-2 and NOS-2 double labeling quantification, the counting was done as described above, except that the percentages were calculated with respect to whether the cell expressed both NOS-2 and COX-2, or NOS-2 or COX-2 exclusively.
Results
We demonstrated previously that treatment with TGF-β1 enhances astrocytic nitric oxide production induced by LPS plus interferon-γ (IFNγ) by increasing the number of astrocytes in a population that express NOS-2 [14]. To test whether TGF-β1 augments COX-2 expression in murine astrocytes, COX-2 mRNA and protein expression were examined in murine primary astrocyte cultures by qRT-PCR and Western blot analysis, respectively. While not constitutively expressed in resting or TGF-β1-treated astrocytes, COX-2 mRNA levels steadily increased following treatment with LPS and IFNγ and these levels were enhanced by TGF-β1 at every time point assessed (Fig. 1). This increase in COX-2 mRNA expression corresponded to a parallel and time-dependent increase in COX-2 protein expression (Fig. 2).
Figure 1. Effect of TGF-β1 on astrocytic LPS plus IFNγ-induced COX-2 mRNA expression.
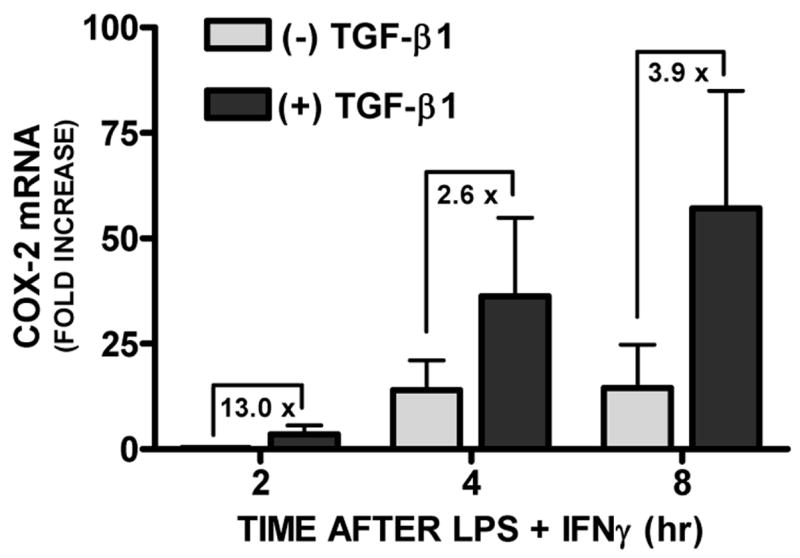
Primary astrocyte cultures were treated with [(+) TGF-β1; 3ng/ml] or without [(−) TGF-β1] TGF-β1 24hr prior to addition of medium alone or that containing LPS plus IFNγ (2μg/ml plus 3ng/ml, respectively) to induce COX-2. At the times indicated, RNA was isolated, first strand cDNA was synthesized, and COX-2 and β-actin expression assessed via quantitative RT-PCR. Data are expressed as the fold increase in COX-2 mRNA expression + SEM relative to a reference, in this case the level of COX-2 mRNA expressed in the 2hr LPS plus IFNγ alone condition (set at 1) (n = 4 from 4 separate astrocyte preparations).
Figure 2. Effect of TGF-β1 on LPS + IFNγ-induced COX-2 protein expression in astrocytes.

Primary astrocyte cultures were treated without [(−) TGF-β1] or with TGF-β1 [(+) TGF-β1; 3ng/ml] 24hr prior to addition of medium alone or that containing LPS plus IFNγ (2μg/ml plus 3ng/ml, respectively). Cell lysates were harvested at the times indicated and protein (20μg) separated on an 8% SDS polyacrylamide gel followed by electrophoretic transfer to nitrocellulose. Membranes were immunoblotted for β-actin and COX-2. A representative blot from 2 independent experiments is shown.
Immunocytochemistry for COX-2 revealed perinuclear staining in only a small fraction of LPS (3.58 ± 0.86%) or LPS plus IFNγ (3.28 ± 0.41%) –stimulated astrocytes (Fig. 3). Pretreatment with TGF-β1 significantly increased the percentage of cells that expressed COX-2 with either stimuli used (to 11.90 ± 1.91% and 8.23 ± 0.78%, respectively; Fig. 3). Co-localization with the astrocyte-specific marker glial fibrillary acidic protein (GFAP) confirmed that these COX-2-positive cells were indeed astrocytes (Fig. 4). Hence, these data demonstrate that the ability of TGF-β1 to facilitate astrocytic NOS-2 expression [14] is not gene-specific as it facilitates astrocytic COX-2 expression in a similar manner.
Figure 3. Effect of TGF-β1 on the number of cells that express COX-2 induced by LPS and LPS + IFNγ.

Astrocyte cultures were treated with vehicle [(−) TGF-β1] or TGF-β1 [(+) TGF-β1; 3ng/ml] for 24 hr prior to the addition of medium containing LPS (2μg/ml) or LPS plus IFNγ (2μg/ml plus 3ng/ml, respectively). (A) Six hr later, cultures were fixed and immunolabeled for COX-2 (red) followed by DAPI counterstaining (blue) to illustrate the number of nuclei per field. A representative photomicrograph (40x magnification) is shown for each treatment condition. (B) The percentage of cells expressing COX-2 per well was calculated and data plotted as mean % COX-2 positive cells + SEM (n = 6 cultures pooled from 3 separate astrocyte preparations). Following transformation of the percentage data, within group differences were analyzed via two-way ANOVA followed by the Bonferroni’s post-hoc test for multiple comparisons. (*) indicates a significant within group difference assessed at p<0.05.
Figure 4. Co-localization of COX-2 to GFAP immunoreactive cells.
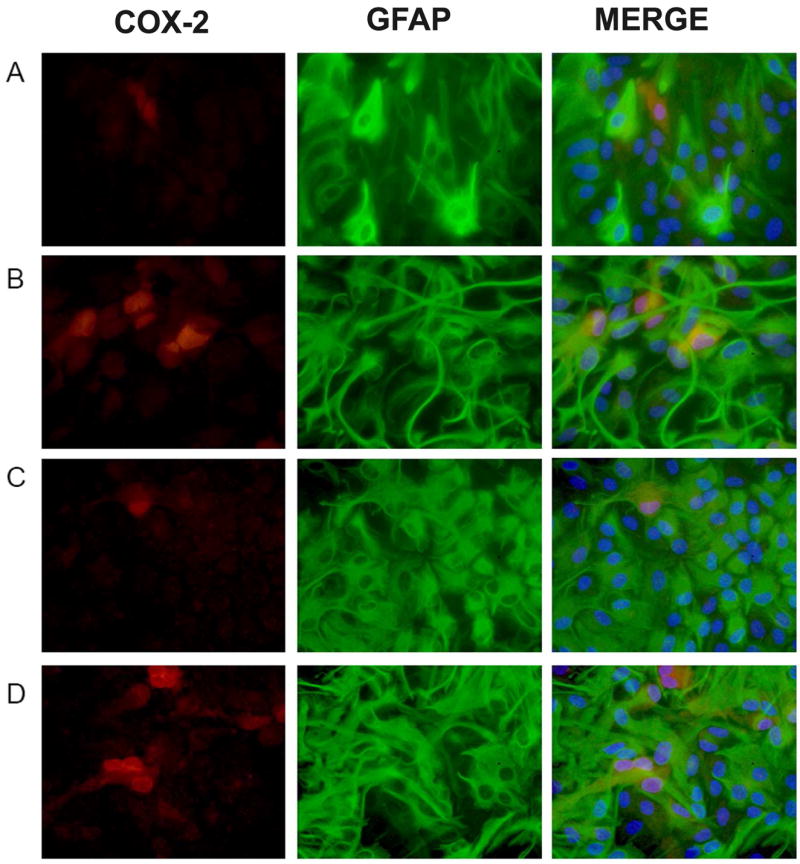
Cultures were treated with either vehicle (A,C) or TGF-β1 (3ng/ml; B,D) for 24 hr prior to the addition of medium containing LPS (2μg/ml; A,B) or LPS plus IFNγ (3ng/ml; C,D). Twelve hr later, cultures were fixed and immunolabeled for COX-2 (red) and GFAP (green) followed by DAPI counterstaining to illustrate the number of nuclei per field (blue). Representative photomicrographs (80x magnification) are shown for each treatment condition. (A) LPS, (B) LPS + TGF-β1, (C) LPS + IFNγ, (D) LPS + IFNγ + TGF-β1.
To assess whether the TGF-β1-mediated effect on either COX-2 or NOS-2 expression was sensitive to the inductive stimulus used, various cytokines were employed in lieu of LPS. IL-1β and TNFα induced astrocytic COX-2 and NOS-2 protein expression when combined with IFNγ (Figure 5A,6A) and these protein levels were substantially augmented by pre-incubation with TGF-β1 (Figure 5A,6A). The increase in protein expression by TGF-β1 was largely functionally relevant as TGF-β1 increased COX-2 activity (i.e., enhanced PGE2) following treatment with IFNγ along with LPS or IL-1β, although not with TNFα (Fig. 5B). Increased NOS-2 activity (i.e., enhanced NO production) occurred with all stimuli employed (Fig. 6B).
Figure 5. Effect of TGF-β1 on COX-2 protein expression and activity induced by different pro-inflammatory stimuli.
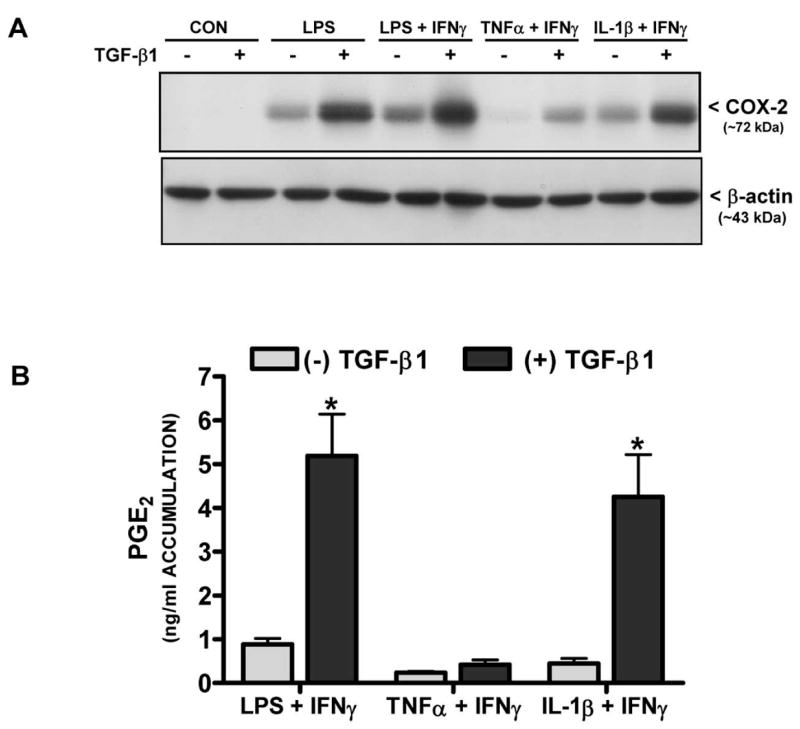
(A) Cultures were treated with either vehicle [(−) TGF-β1] or TGF-β1 [(+) TGF-β1; 3ng/ml] for 24 hr prior to the addition of medium alone (CON) or that containing LPS (2μg/ml), LPS + IFNγ (2μg/ml + 3ng/ml), TNFα + IFNγ (1μg/ml + 3ng/ml), or IL-1β + IFNγ (both at 3ng/ml). Six hr later, cell lysates were harvested and 20μg protein was separated on an 8% SDS polyacrylamide gel followed by electrophoretic transfer to nitrocellulose. Membranes were immunoblotted for COX-2 along with β-actin to control for equal loading. Results are representative of three blots. (B) Thirty-two-48 hr later, cell culture supernatants were collected from cultures treated as in (A) and prostaglandin E2 (PGE2) accumulation (mean μM + SEM; n = 6 from 3 separate astrocyte preparations) was assessed as an indirect measure of COX-2 catalytic activity. (*) indicates a significant within group difference as determined by two-way ANOVA followed by Bonferroni’s post-hoc test (p<0.001).
Figure 6. Effect of TGF-β1 on NOS-2 protein expression and activity induced by different pro-inflammatory stimuli.
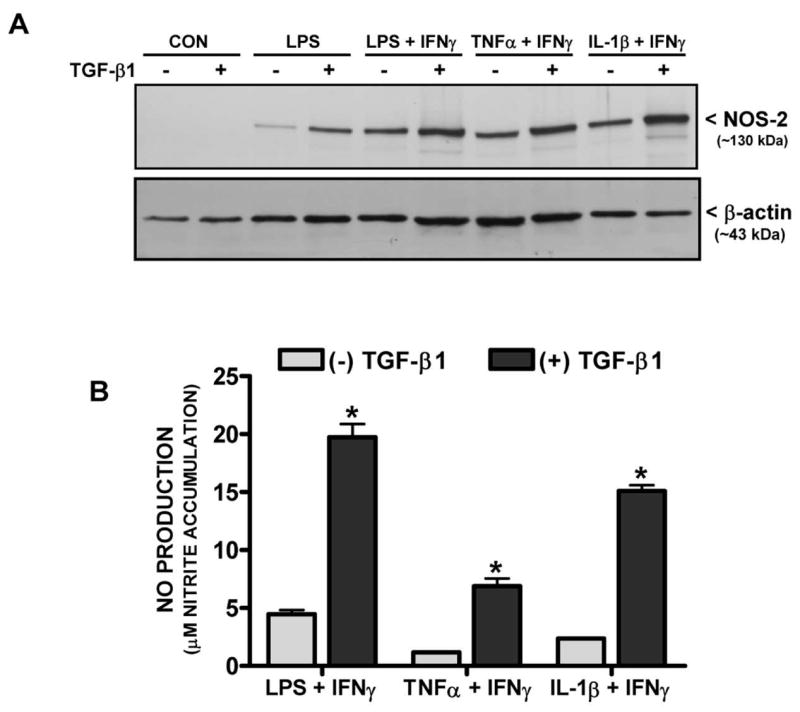
(A) Cultures were treated with either vehicle [(−) TGF-β1] or TGF-β1 [(+) TGF-β1; 3ng/ml] for 24 hr prior to the addition of medium alone (CON) or that containing LPS (2μg/ml), LPS + IFNγ (2μg/ml + 3ng/ml), TNFα + IFNγ (1μg/ml + 3ng/ml), or IL-1β + IFNγ (both at 3ng/ml). Six hr later, cell lysates were harvested and 20μg protein was separated on an 8% SDS polyacrylamide gel followed by electrophoretic transfer to nitrocellulose. Membranes were immunoblotted for NOS-2 along with β-actin to control for equal loading. Results are representative of two blots. (B) Twelve hr later, cell culture supernatants were collected from cultures treated as in (A) and nitrite accumulation (mean μM + SEM; n = 9 from 3 separate dissections) was assessed as an indirect measure of NOS-2 catalytic activity. (*) indicates a significant within group difference as determined by two-way ANOVA followed by Bonferroni’s post-hoc test (p<0.001).
To determine whether the mechanism by which TGF-β1 enhanced COX-2/NOS-2 protein expression induced by these other stimuli was due to an enhancement in the pool of astrocytes that expressed these proteins, COX-2 and NOS-2 expression were examined by immunofluorescent microscopy. As was demonstrated for NOS-2 previously and shown here for comparison [14], only a subpopulation of astrocytes were immunopositive for COX-2 following stimulation with LPS plus IFNγ. This number was significantly augmented by treatment with TGF-β1 (Fig. 7). Similar results for both NOS-2 and COX-2 were found when TNFα or IL-1β was used in lieu of LPS (Fig. 7). Finally, examination of whether NOS-2 and COX-2 protein expression localized to the same cells revealed that the monolayers contained three separate populations of responding cells: 1) those that express NOS-2 only; 2) those that express COX-2 only; and 3) those that express both COX-2 and NOS-2 (Fig. 8 A). While all cohorts of cells were increased by TGF-β1, there appeared to be a differential increase whereby the pool of astrocytes expressing COX-2 and NOS-2 exclusively increased by ~2-fold and ~5-fold, respectively, while that expressing both proteins increased by ~7-fold (Fig. 8 B).
Figure 7. Immunocytochemical analysis of NOS-2 and COX-2 protein expression.
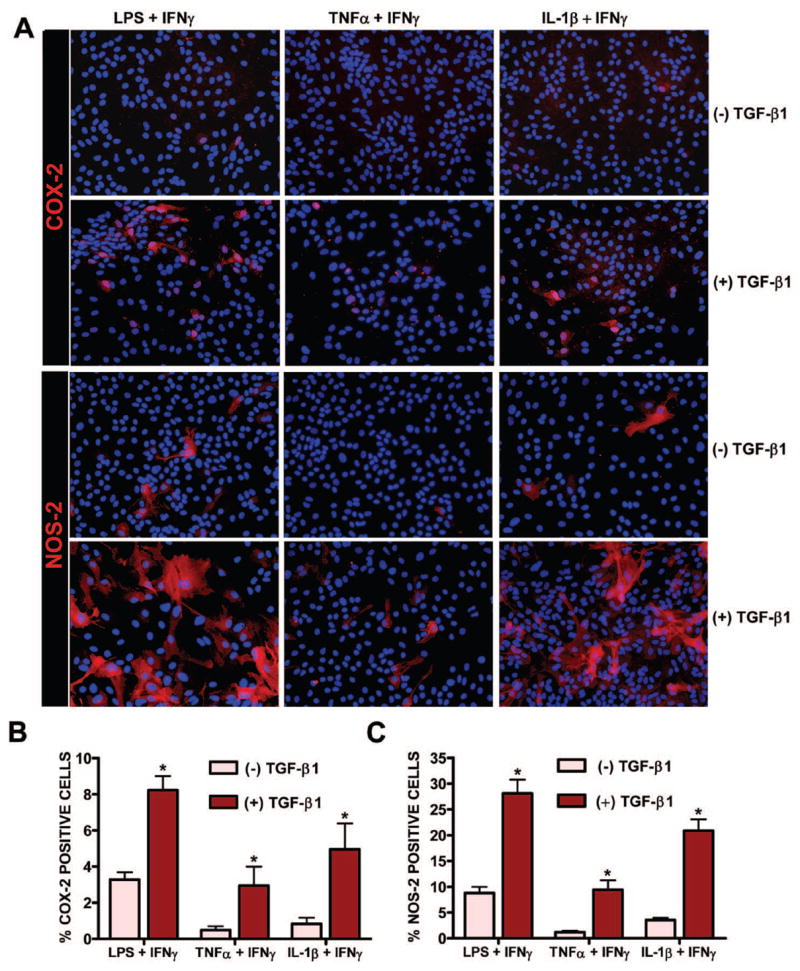
Cultures were treated with or without TGF-β1 (3ng/ml) for 24 hr prior to the addition of medium containing LPS + IFNγ (2μg/ml + 3ng/ml), TNFα + IFNγ (1μg/ml + 3ng/ml), or IL-1β + IFNγ (both at 3ng/ml). Twelve and six hr later, cultures were fixed and immunolabeled for COX-2 (red) and NOS-2 (red), as indicated, followed by DAPI nuclear counterstaining (blue). A representative photomicrograph (40x magnification) is shown for each treatment condition. The percentage of cells expressing COX-2 and NOS-2 per culture well was calculated and data plotted as mean % COX-2 (B) or % NOS-2 (C) positive cells + SEM (n = 6 cultures from 3 separate astrocyte preparations; n = 12 cultures from 4 separate astrocyte preparations, respectively). Following transformation of the percentage data, significance was assessed via two-way ANOVA followed by the Bonferroni’s post-hoc test. (*) indicates a significant within group difference assessed at p<0.05.
Figure 8. Distribution of NOS-2 and COX-2 expressing cells.
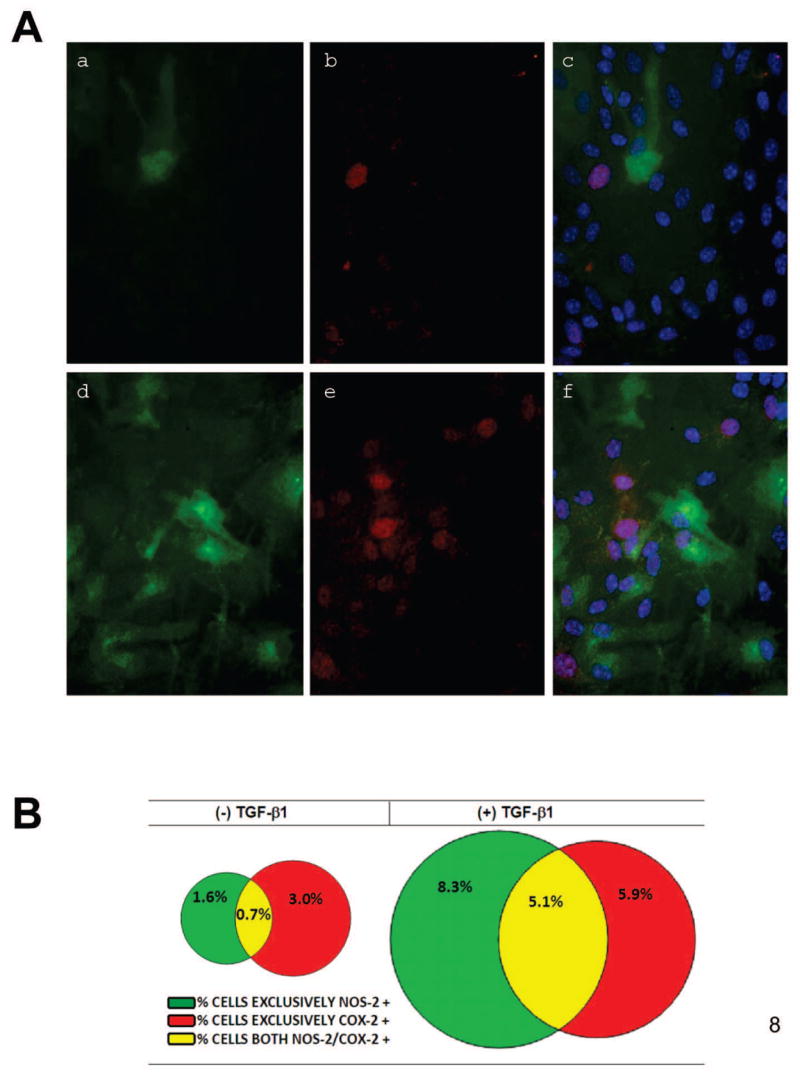
Cultures were treated with vehicle [(−) TGF-β1; a,b,c] or TGF-β1 [(+) TGF-β1; 3ng/ml; d,e,f] for 24 hr prior to the addition of medium containing LPS plus IFNγ (2μg/ml + 3ng/ml). (A) Twelve-14 hr later, cultures were fixed and immunolabeled for NOS-2 (green) and COX-2 (red) followed by DAPI counterstaining to illustrate the number of nuclei per field (blue). A representative photomicrograph (80x magnification) from the same field of view is shown for each treatment condition. a,d, NOS-2; b,e, COX-2; c,f, NOS-2, COX-2, DAPI. (B) The percentage of cells expressing either COX-2 alone, NOS-2 alone or both COX-2 and NOS-2 were calculated (n = 6 cultures from three separate astrocyte preparations). Percentages within treatment groups are represented in Venn diagrams drawn to scale. COX-2 alone is shown in red; NOS-2 alone is shown in green; double labeled-cells are yellow as indicated in the figure key.
Discussion
It has long been recognized that astrocytes represent a phenotypically diverse population of cells [12–17]. Cell-to-cell variation in gene expression can have broad implications for cellular function. As such, it is of great interest to understand the processes and molecules involved in regulating this diversity. Here, we find that TGF-β1 acts to upregulate expression of select genes, namely NOS-2 and COX-2, via a population-based mechanism of gene regulation – that is by increasing the pool of astrocytes that contribute to overall gene expression levels. Furthermore, our results demonstrate that this phenomenon occurs irrespective of the stimuli used to induce COX-2/NOS-2, suggestive of a universal role of TGF-β1 in eliciting this mode of gene regulation under neuroinflammatory conditions.
TGF-β1 has been shown to increase or decrease NOS-2 [27–31] and COX-2 [32–39] expression in a cell type- and experimental paradigm-dependent manner. The TGF-β1-mediated increase in COX-2 protein expression demonstrated herein in mouse cortical astrocytes complements similar results obtained in a rat cortical astrocyte culture system [39], thereby indicating TGF-β1 to be a positive regulator of COX-2 expression in astrocytes. Additionally, our study demonstrates that the TGF-β1-mediated enhancement in COX-2 protein expression correlates with increased COX-2 mRNA levels and that the underlying increase was due to an enhancement in the population of astrocytes that express COX-2. This phenomenon is strikingly similar to that which we reported for the TGF-β1-mediated upregulation of NOS-2 expression in astrocytes [14].
The TGF-β1-mediated regulation of NOS-2 and COX-2 has been shown to be stimulus-specific in several cell types throughout the body including microglia [32, 33, 40, 41]. For example, TGF-β1 inhibits microglial COX-2 expression induced by IL-1β but not that induced by TNFα or IL-6 [32]. However, present results demonstrate that in astrocytes the changes in NOS-2/COX-2 expression mediated by TGF-β1 do not appear to be stimulus-specific. This lack of stimulus specificity implies that TGF-β1 may act to augment astrocytic NOS-2 and COX-2 protein expression under various neuroinflammatory conditions irrespective of the type of pro-inflammatory mediators present. This lack of stimulus specificity also begs the question as to whether TGF-β1 increases the population of astrocytes that express these proteins via modulation of a common signaling pathway. However, both COX-2 and NOS-2 protein were upregulated in a heterogeneous manner (i.e., in separate populations of cells, as well as, in a population that overlaps) and are known to have distinct cis-elements on their respective promoter regions [42, 43]. Thus, it would not be surprising that different transcription factors would be required for COX-2 versus NOS-2 induction.
TGF-β1 canonically signals by binding to TGFβRII which heterodimerizes with and activates the signaling receptor activin-like kinase-5 (ALK5) [44]. This facilitates the phosphorylation of the R-SMADS, Smad2 and Smad3, which can then form a heterotrimer with Smad4 allowing the trimolecular complex to translocate into the nucleus and affect gene transcription. Unfortunately, neither the NOS-2 nor COX-2 promoter has a canonical Smad-binding element (SBE). However, TGF-β1 has been shown to augment gene transcription via binding to other consensus elements [45–48]. Whether this type of mechanism underlies the response in our system requires further investigation. It is of interest, however, that the potentiating effect of TGF-β1 on both COX-2 and NOS-2 expression occurs with LPS, IL-1β, and TNFα, independent from IFNγ (unpublished data). This suggests that signal transducers and activators of transcription (i.e. STATs) may be an unlikely target. While NOS-2 and COX-2 promoters contain a known consensus element for NFκB [48–51], preliminary analyses employing a standard immunofluorescent microscopic technique demonstrate that TGF-β1 does not increase the percentage of astrocytes that display nuclear accumulation of p65 in response to LPS or IL-1β plus IFNγ stimulation (unpublished observations). In addition to transcription, numerous proteins are known to be regulated by TGF-β through stabilization of their mRNA (for review see [52]). In fact, TGF-β1 has been demonstrated to stabilize COX-2 mRNA induced by IL-1β- or TNF-α in lung fibroblasts, while having no effect on transcription itself [53]. However, the precise pathway(s) by which it does so is poorly understood. Although an indirect role for the Smads has been postulated [54, 55] other molecules that might be important in the context of TGF-β1 signaling and subsequent mRNA stabilization include JNK and p38MAP kinase as well as tristetraprolin and ELAV proteins [56–60]. Finally, changes in translational efficiency should not be overlooked [61].
While the exact reason for this heterogeneity in astrocytic inflammatory gene expression is at present unknown, the results herein underscore the importance of examining changes in gene expression at a cellular level, and not just as a population average, as the biological implication of that change may result in different functional outcomes. For example, an increase in the number of astrocytes expressing NOS-2 or COX-2 in a given tissue area, as opposed to increased levels within a single cell, could lead to a more global effect, whereas the latter might only affect the immediate microenvironment surrounding that particular cell. Indeed, whether NO is beneficial or detrimental is critically dependent on the concentration and duration of exposure as well as the cellular oxygen environment. [62–67]. Additionally, in the subset of astrocytes in which COX-2 and NOS-2 are co-expressed, a possible interplay may be functionally relevant as the enzymes have been shown to physically associate with one another in both in vitro and in vivo assays [68]. Further NOS-2-derived NO can attenuate or augment COX-2 activity depending on the cell-type examined and the predominant NO species present [68–71]. In murine astrocytes specifically, COX-2 activity can be enhanced via increased protein expression levels, or decreased via inhibiting COX-2 catalytic activity, in an NO-species dependent manner [72]. In parallel, the induction of COX-2 itself can reduce surrounding NO levels through the ability of NO to act as a co-substrate for its peroxidase activity [73]. Further COX-2-derived products can also regulate (up or down) NOS-2 expression levels and activity depending on the cell-type and experimental paradigm studied [74–76]. Hence, the heterogeneity of NOS-2 and COX-2 astrocyte expression in brain, as well as their coordinate regulation, could contribute to the establishment and maintenance of a network of communication among neurons and glia under both physiological and pathophysiological conditions in ways we have yet to understand fully.
In conclusion, present data are the first to demonstrate that TGF-β1 enhances murine astrocytic NOS-2 and COX-2 expression by augmenting the pool of astrocytes capable of expressing these genes irrespective of the inductive stimulus used. Given this lack of stimulus-and target- specificity, it is intriguing to speculate a widespread role for TGF-β1 in eliciting population-based changes in astrocytic gene expression under neuroinflammatory conditions in vivo. More globally, these results underscore the importance of examining changes in gene expression at a cellular level in addition to analysis using biochemical measures, as it is becoming increasingly clear that individual cells behave differently from the population average.
Acknowledgments
The authors thank Ariel Gragnolati for her excellent technical assistance. This work was supported by Grant NS36812 from NINDS, National Institutes of Health (S.J.H., J.A.H.).
Footnotes
Publisher's Disclaimer: This is a PDF file of an unedited manuscript that has been accepted for publication. As a service to our customers we are providing this early version of the manuscript. The manuscript will undergo copyediting, typesetting, and review of the resulting proof before it is published in its final citable form. Please note that during the production process errors may be discovered which could affect the content, and all legal disclaimers that apply to the journal pertain.
References
- 1.Blake WJ, Cantor KAMCR, Collins JJ. Noise in eukaryotic gene expression. Nature. 2003;422(6932):633–7. doi: 10.1038/nature01546. [DOI] [PubMed] [Google Scholar]
- 2.Levin MD. Noise in gene expression as the source of non-genetic individuality in the chemotactic response of Escherichia coli. FEBS Lett. 2003;550(1–3):135–8. doi: 10.1016/s0014-5793(03)00857-3. [DOI] [PubMed] [Google Scholar]
- 3.Kaern M, Elston TC, Blake WJ, Collins JJ. Stochasticity in gene expression: from theories to phenotypes. Nat Rev Genet. 2005;6(6):451–64. doi: 10.1038/nrg1615. [DOI] [PubMed] [Google Scholar]
- 4.Walz W. Controversy surrounding the existence of discrete functional classes of astrocytes in adult gray matter. Glia. 2000;31(2):95–103. doi: 10.1002/1098-1136(200008)31:2<95::aid-glia10>3.0.co;2-6. [DOI] [PubMed] [Google Scholar]
- 5.Siglienti I, Chan A, Kleinschnitz C, Jander S, Toyka KV, Gold R, Stoll G. Downregulation of transforming growth factor-beta2 facilitates inflammation in the central nervous system by reciprocal astrocyte/microglia interactions. J Neuropathol Exp Neurol. 2007;66(1):47–56. doi: 10.1097/nen.0b013e31802d47b4. [DOI] [PubMed] [Google Scholar]
- 6.Nakanishi M, Niidome T, Matsuda S, Akaike A, Kihara T, Sugimoto H. Microglia-derived interleukin-6 and leukaemia inhibitory factor promote astrocytic differentiation of neural stem/progenitor cells. European Journal of Neuroscience. 2007;25(3):649–658. doi: 10.1111/j.1460-9568.2007.05309.x. [DOI] [PubMed] [Google Scholar]
- 7.Tontsch U, Rott O. Cortical neurons selectively inhibit MHC class II induction in astrocytes but not in microglial cells. Int Immunol. 1993;5(3):249–54. doi: 10.1093/intimm/5.3.249. [DOI] [PubMed] [Google Scholar]
- 8.Perego C, Vanoni C, Bossi M, Massari S, Basudev H, Longhi R, Pietrini G. The GLT-1 and GLAST glutamate transporters are expressed on morphologically distinct astrocytes and regulated by neuronal activity in primary hippocampal cocultures. J Neurochem. 2000;75(3):1076–84. doi: 10.1046/j.1471-4159.2000.0751076.x. [DOI] [PubMed] [Google Scholar]
- 9.Swanson RA, Liu J, Miller JW, Rothstein JD, Farrell K, Stein BA, Longuemare MC. Neuronal regulation of glutamate transporter subtype expression in astrocytes. J Neurosci. 1997;17(3):932–40. doi: 10.1523/JNEUROSCI.17-03-00932.1997. [DOI] [PMC free article] [PubMed] [Google Scholar]
- 10.Gegelashvili G, Danbolt NC, Schousboe A. Neuronal soluble factors differentially regulate the expression of the GLT1 and GLAST glutamate transporters in cultured astroglia. J Neurochem. 1997;69(6):2612–5. doi: 10.1046/j.1471-4159.1997.69062612.x. [DOI] [PubMed] [Google Scholar]
- 11.Schlag BD, Vondrasek JR, Munir M, Kalandadze A, Zelenaia OA, Rothstein JD, Robinson MB. Regulation of the glial Na+-dependent glutamate transporters by cyclic AMP analogs and neurons. Mol Pharmacol. 1998;53(3):355–69. doi: 10.1124/mol.53.3.355. [DOI] [PubMed] [Google Scholar]
- 12.Imura T, Nakano I, Kornblum HI, Sofroniew MV. Phenotypic and functional heterogeneity of GFAP-expressing cells in vitro: differential expression of LeX/CD15 by GFAP-expressing multipotent neural stem cells and non-neurogenic astrocytes. Glia. 2006;53(3):277–93. doi: 10.1002/glia.20281. [DOI] [PubMed] [Google Scholar]
- 13.Hamby ME, Uliasz TF, Hewett SJ, Hewett JA. Characterization of an improved procedure for the removal of microglia from confluent monolayers of primary astrocytes. J Neurosci Methods. 2006;150(1):128–137. doi: 10.1016/j.jneumeth.2005.06.016. [DOI] [PubMed] [Google Scholar]
- 14.Hamby ME, Hewett JA, Hewett SJ. TGF-beta1 potentiates astrocytic nitric oxide production by expanding the population of astrocytes that express NOS-2. Glia. 2006;54(6):566–77. doi: 10.1002/glia.20411. [DOI] [PubMed] [Google Scholar]
- 15.Morga E, Faber C, Heuschling P. Regional heterogeneity of the astroglial immunoreactive phenotype: effect of lipopolysaccharide. J Neurosci Res. 1999;57(6):941–52. [PubMed] [Google Scholar]
- 16.Davies DL, I, Niesman R, Boop FA, Phelan KD. Heterogeneity of astroglia cultured from adult human temporal lobe. Int J Dev Neurosci. 2000;18(2–3):151–60. doi: 10.1016/s0736-5748(99)00083-0. [DOI] [PubMed] [Google Scholar]
- 17.Matthias K, Kirchhoff F, Seifert G, Huttmann K, Matyash M, Kettenmann H, Steinhauser C. Segregated expression of AMPA-type glutamate receptors and glutamate transporters defines distinct astrocyte populations in the mouse hippocampus. J Neurosci. 2003;23(5):1750–8. doi: 10.1523/JNEUROSCI.23-05-01750.2003. [DOI] [PMC free article] [PubMed] [Google Scholar]
- 18.McKhann GM, II, D’Ambrosio R, Janigro D. Heterogeneity of Astrocyte Resting Membrane Potentials and Intercellular Coupling Revealed by Whole-Cell and Gramicidin-Perforated Patch Recordings from Cultured Neocortical and Hippocampal Slice Astrocytes. J Neurosci. 1997;17(18):6850–6863. doi: 10.1523/JNEUROSCI.17-18-06850.1997. [DOI] [PMC free article] [PubMed] [Google Scholar]
- 19.Galea E, Feinstein DL, Reis DJ. Induction of calcium-independent nitric oxide synthase activity in primary rat glial cultures. Proc Natl Acad Sci U S A. 1992;89(22):10945–9. doi: 10.1073/pnas.89.22.10945. [DOI] [PMC free article] [PubMed] [Google Scholar]
- 20.Hewett SJ, Corbett JA, McDaniel ML, Choi DW. Interferon-gamma and interleukin-1 beta induce nitric oxide formation from primary mouse astrocytes. Neurosci Lett. 1993;164(1–2):229–32. doi: 10.1016/0304-3940(93)90898-u. [DOI] [PubMed] [Google Scholar]
- 21.Galea E, Reis DJ, Feinstein DL. Cloning and expression of inducible nitric oxide synthase from rat astrocytes. J Neurosci Res. 1994;37(3):406–14. doi: 10.1002/jnr.490370313. [DOI] [PubMed] [Google Scholar]
- 22.Carpentier PA, Begolka WS, Olson JK, Elhofy A, Karpus WJ, Miller SD. Differential activation of astrocytes by innate and adaptive immune stimuli. Glia. 2005;49(3):360–74. doi: 10.1002/glia.20117. [DOI] [PubMed] [Google Scholar]
- 23.Simmons ML, Murphy S. Induction of nitric oxide synthase in glial cells. J Neurochem. 1992;59(3):897–905. doi: 10.1111/j.1471-4159.1992.tb08328.x. [DOI] [PubMed] [Google Scholar]
- 24.Green LC, Wagner DA, Glogowski J, Skipper PL, Wishnok JS, Tannenbaum SR. Analysis of nitrate, nitrite, and [15N]nitrate in biological fluids. Anal Biochem. 1982;126(1):131–8. doi: 10.1016/0003-2697(82)90118-x. [DOI] [PubMed] [Google Scholar]
- 25.Hewett JA, Hewett SJ, Winkler S, Pfeiffer SE. Inducible nitric oxide synthase expression in cultures enriched for mature oligodendrocytes is due to microglia. J Neurosci Res. 1999;56(2):189–98. doi: 10.1002/(sici)1097-4547(19990415)56:2<189::aid-jnr8>3.0.co;2-b. [DOI] [PubMed] [Google Scholar]
- 26.Steel R, Torrie J. Principles and Procedures of Statistics: A Biometrical Approach. New York: McGraw-Hill Book Co; 1980. p. 633. [Google Scholar]
- 27.Vodovotz Y, Bogdan C, Paik J, Xie QW, Nathan C. Mechanisms of suppression of macrophage nitric oxide release by transforming growth factor beta. J Exp Med. 1993;178(2):605–13. doi: 10.1084/jem.178.2.605. [DOI] [PMC free article] [PubMed] [Google Scholar]
- 28.Finder J, Stark WW, Jr, Nakayama DK, Geller D, Wasserloos K, Pitt BR, Davies P. TGF-beta regulates production of NO in pulmonary artery smooth muscle cells by inhibiting expression of NOS. Am J Physiol. 1995;268(5 Pt 1):L862–7. doi: 10.1152/ajplung.1995.268.5.L862. [DOI] [PubMed] [Google Scholar]
- 29.Gilbert RS, Herschman HR. Transforming growth factor beta differentially modulates the inducible nitric oxide synthase gene in distinct cell types. Biochem Biophys Res Commun. 1993;195(1):380–4. doi: 10.1006/bbrc.1993.2054. [DOI] [PubMed] [Google Scholar]
- 30.Williams G, Becker L, Bryant D, Willis S, Giroir BP. Effects of transforming growth factor-beta 1 on nitric oxide synthesis by C2C12 skeletal myocytes. Am J Physiol. 1996;270(1 Pt 2):R145–52. doi: 10.1152/ajpregu.1996.270.1.R145. [DOI] [PubMed] [Google Scholar]
- 31.Lieb K, Engels S, Fiebich BL. Inhibition of LPS-induced iNOS and NO synthesis in primary rat microglial cells. Neurochem Int. 2003;42(2):131–7. doi: 10.1016/s0197-0186(02)00076-1. [DOI] [PubMed] [Google Scholar]
- 32.Basu A, Krady JK, Enterline JR, Levison SW. Transforming growth factor beta1 prevents IL-1beta-induced microglial activation, whereas TNFalpha- and IL-6-stimulated activation are not antagonized. Glia. 2002;40(1):109–20. doi: 10.1002/glia.10118. [DOI] [PubMed] [Google Scholar]
- 33.Minghetti L, Polazzi E, Nicolini A, Levi G. Opposite regulation of prostaglandin E2 synthesis by transforming growth factor-beta1 and interleukin 10 in activated microglial cultures. J Neuroimmunol. 1998;82(1):31–9. doi: 10.1016/S0165-5728(97)00185-9. [DOI] [PubMed] [Google Scholar]
- 34.Pilbeam C, Rao Y, Voznesensky O, Kawaguchi H, Alander C, Raisz L, Herschman H. Transforming growth factor-beta1 regulation of prostaglandin G/H synthase-2 expression in osteoblastic MC3T3-E1 cells. Endocrinology. 1997;138(11):4672–82. doi: 10.1210/endo.138.11.5495. [DOI] [PubMed] [Google Scholar]
- 35.Pilbeam CC, Kawaguchi H, Hakeda Y, Voznesensky O, Alander CB, Raisz LG. Differential regulation of inducible and constitutive prostaglandin endoperoxide synthase in osteoblastic MC3T3-E1 cells. J Biol Chem. 1993;268(34):25643–9. [PubMed] [Google Scholar]
- 36.Gilbert RS, Reddy ST, Targan S, Herschman HR. TGF-beta 1 augments expression of the TIS10/prostaglandin synthase-2 gene in intestinal epithelial cells. Cell Mol Biol Res. 1994;40(7–8):653–60. [PubMed] [Google Scholar]
- 37.Reddy ST, Gilbert RS, Xie W, Luner S, Herschman HR. TGF-beta 1 inhibits both endotoxin-induced prostaglandin synthesis and expression of the TIS10/prostaglandin synthase 2 gene in murine macrophages. J Leukoc Biol. 1994;55(2):192–200. doi: 10.1002/jlb.55.2.192. [DOI] [PubMed] [Google Scholar]
- 38.Gilbert RS, Reddy ST, Kujubu DA, Xie W, Luner S, Herschman HR. Transforming growth factor beta 1 augments mitogen-induced prostaglandin synthesis and expression of the TIS10/prostaglandin synthase 2 gene both in Swiss 3T3 cells and in murine embryo fibroblasts. J Cell Physiol. 1994;159(1):67–75. doi: 10.1002/jcp.1041590110. [DOI] [PubMed] [Google Scholar]
- 39.Luo J, Lang JA, Miller MW. Transforming Growth Factor β Regulates the Expression of Cyclooxygenase in Cultured Cortical Astrocytes and Neurons. Journal of Neurochemistry. 1998;71(2):526–534. doi: 10.1046/j.1471-4159.1998.71020526.x. [DOI] [PubMed] [Google Scholar]
- 40.Ding A, Nathan CF, Graycar J, Derynck R, Stuehr DJ, Srimal S. Macrophage deactivating factor and transforming growth factors-beta 1 -beta 2 and -beta 3 inhibit induction of macrophage nitrogen oxide synthesis by IFN-gamma. J Immunol. 1990;145(3):940–4. [PubMed] [Google Scholar]
- 41.Zulueta JJ, Sawhney R, Kayyali U, Fogel M, Donaldson C, Huang H, Lanzillo JJ, Hassoun PM. Modulation of inducible nitric oxide synthase by hypoxia in pulmonary artery endothelial cells. Am J Respir Cell Mol Biol. 2002;26(1):22–30. doi: 10.1165/ajrcmb.26.1.4510. [DOI] [PubMed] [Google Scholar]
- 42.Xie QW, Nathan C. Promoter of the mouse gene encoding calcium-independent nitric oxide synthase confers inducibility by interferon-gamma and bacterial lipopolysaccharide. Trans Assoc Am Physicians. 1993;106:1–12. [PubMed] [Google Scholar]
- 43.Kosaka T, Miyata A, Ihara H, Hara S, Sugimoto T, Takeda O, Takahashi E, Tanabe T. Characterization of the human gene (PTGS2) encoding prostaglandin-endoperoxide synthase 2. Eur J Biochem. 1994;221(3):889–97. doi: 10.1111/j.1432-1033.1994.tb18804.x. [DOI] [PubMed] [Google Scholar]
- 44.Karlsson G, Liu Y, Larsson J, Goumans MJ, Lee JS, Thorgeirsson SS, Ringner M, Karlsson S. Gene expression profiling demonstrates that TGF-beta1 signals exclusively through receptor complexes involving Alk5 and identifies targets of TGF-beta signaling. Physiol Genomics. 2005;21(3):396–403. doi: 10.1152/physiolgenomics.00303.2004. [DOI] [PubMed] [Google Scholar]
- 45.Tesseur I, Wyss-Coray T. A role for TGF-beta signaling in neurodegeneration: evidence from genetically engineered models. Curr Alzheimer Res. 2006;3(5):505–13. doi: 10.2174/156720506779025297. [DOI] [PubMed] [Google Scholar]
- 46.Law AK, Gupta D, Levy S, Wallace DC, McKeon RJ, Buck CR. TGF-beta1 induction of the adenine nucleotide translocator 1 in astrocytes occurs through Smads and Sp1 transcription factors. BMC Neurosci. 2004;5:1. doi: 10.1186/1471-2202-5-1. [DOI] [PMC free article] [PubMed] [Google Scholar]
- 47.Zhang Y, Feng XH, Derynck R. Smad3 and Smad4 cooperate with c-Jun/c-Fos to mediate TGF-beta-induced transcription. Nature. 1998;394(6696):909–13. doi: 10.1038/29814. [DOI] [PubMed] [Google Scholar]
- 48.Yang X, Hou F, Taylor L, Polgar P. Characterization of human cyclooxygenase 2 gene promoter localization of a TGF-beta response element. Biochim Biophys Acta. 1997;1350(3):287–92. doi: 10.1016/s0167-4781(96)00225-4. [DOI] [PubMed] [Google Scholar]
- 49.Chartrain NA, Geller DA, Koty PP, Sitrin NF, Nussler AK, Hoffman EP, Billiar TR, Hutchinson NI, Mudgett JS. Molecular cloning, structure, and chromosomal localization of the human inducible nitric oxide synthase gene. J Biol Chem. 1994;269(9):6765–72. [PubMed] [Google Scholar]
- 50.Xie QW, Cho HJ, Calaycay J, Mumford RA, Swiderek KM, Lee TD, Ding A, Troso T, Nathan C. Cloning and characterization of inducible nitric oxide synthase from mouse macrophages. Science. 1992;256(5054):225–8. doi: 10.1126/science.1373522. [DOI] [PubMed] [Google Scholar]
- 51.Newton R, Kuitert LM, Bergmann M, Adcock IM, Barnes PJ. Evidence for involvement of NF-kappaB in the transcriptional control of COX-2 gene expression by IL-1beta. Biochem Biophys Res Commun. 1997;237(1):28–32. doi: 10.1006/bbrc.1997.7064. [DOI] [PubMed] [Google Scholar]
- 52.Dibrov A, Kashour T, Amara FM. The role of transforming growth factor beta signaling in messenger RNA stability. Growth Factors. 2006;24(1):1–11. doi: 10.1080/08977190500365995. [DOI] [PubMed] [Google Scholar]
- 53.Diaz A, Chepenik KP, Korn JH, Reginato AM, Jimenez SA. Differential regulation of cyclooxygenases 1 and 2 by interleukin-1 beta, tumor necrosis factor-alpha, and transforming growth factor-beta 1 in human lung fibroblasts. Exp Cell Res. 1998;241(1):222–9. doi: 10.1006/excr.1998.4050. [DOI] [PubMed] [Google Scholar]
- 54.Arici A, MacDonald PC, Casey ML. Modulation of the levels of interleukin-8 messenger ribonucleic acid and interleukin-8 protein synthesis in human endometrial stromal cells by transforming growth factor-beta 1. J Clin Endocrinol Metab. 1996;81(8):3004–9. doi: 10.1210/jcem.81.8.8768866. [DOI] [PubMed] [Google Scholar]
- 55.Kucich U, Rosenbloom JC, Abrams WR, Rosenbloom J. Transforming growth factor-beta stabilizes elastin mRNA by a pathway requiring active Smads, protein kinase C-delta, and p38. Am J Respir Cell Mol Biol. 2002;26(2):183–8. doi: 10.1165/ajrcmb.26.2.4666. [DOI] [PubMed] [Google Scholar]
- 56.Park JI, Lee MG, Cho K, Park BJ, Chae KS, Byun DS, Ryu BK, Park YK, Chi SG. Transforming growth factor-beta1 activates interleukin-6 expression in prostate cancer cells through the synergistic collaboration of the Smad2, p38-NF-kappaB, JNK, and Ras signaling pathways. Oncogene. 2003;22(28):4314–32. doi: 10.1038/sj.onc.1206478. [DOI] [PubMed] [Google Scholar]
- 57.Boutaud O, Dixon DA, Oates JA, Sawaoka H. Tristetraprolin binds to the COX-2 mRNA 3′ untranslated region in cancer cells. Adv Exp Med Biol. 2003;525:157–60. doi: 10.1007/978-1-4419-9194-2_32. [DOI] [PubMed] [Google Scholar]
- 58.Zubiaga AM, Belasco JG, Greenberg ME. The nonamer UUAUUUAUU is the key AU-rich sequence motif that mediates mRNA degradation. Mol Cell Biol. 1995;15(4):2219–2230. doi: 10.1128/mcb.15.4.2219. [DOI] [PMC free article] [PubMed] [Google Scholar]
- 59.Dixon DA, Tolley ND, King PH, Nabors LB, McIntyre TM, Zimmerman GA, Prescott SM. Altered expression of the mRNA stability factor HuR promotes cyclooxygenase-2 expression in colon cancer cells. J Clin Invest. 2001;108(11):1657–1665. doi: 10.1172/JCI12973. [DOI] [PMC free article] [PubMed] [Google Scholar]
- 60.Guhaniyogi J, Brewer G. Regulation of mRNA stability in mammalian cells. Gene. 2001;265(1–2):11. doi: 10.1016/s0378-1119(01)00350-x. [DOI] [PubMed] [Google Scholar]
- 61.Ozbudak EM, Thattai M, Kurtser I, Grossman AD, van Oudenaarden A. Regulation of noise in the expression of a single gene. Nat Genet. 2002;31(1):69–73. doi: 10.1038/ng869. [DOI] [PubMed] [Google Scholar]
- 62.Lipton SA, Stamler JS. Actions of redox-related congeners of nitric oxide at the NMDA receptor. Neuropharmacology. 1994;33(11):1229–33. doi: 10.1016/0028-3908(94)90021-3. [DOI] [PubMed] [Google Scholar]
- 63.Vidwans AS, Kim S, Coffin DO, Wink DA, Hewett SJ. Analysis of the neuroprotective effects of various nitric oxide donor compounds in murine mixed cortical cell culture. J Neurochem. 1999;72(5):1843–52. doi: 10.1046/j.1471-4159.1999.0721843.x. [DOI] [PubMed] [Google Scholar]
- 64.Gbadegesin M, Vicini S, Hewett SJ, Wink DA, Espey M, Pluta RM, Colton CA. Hypoxia modulates nitric oxide-induced regulation of NMDA receptor currents and neuronal cell death. Am J Physiol. 1999;277(4 Pt 1):C673–83. doi: 10.1152/ajpcell.1999.277.4.C673. [DOI] [PubMed] [Google Scholar]
- 65.Wink DA, Miranda KM, Espey MG, Pluta RM, Hewett SJ, Colton C, Vitek M, Feelisch M, Grisham MB. Mechanisms of the antioxidant effects of nitric oxide. Antioxid Redox Signal. 2001;3(2):203–13. doi: 10.1089/152308601300185179. [DOI] [PubMed] [Google Scholar]
- 66.Vidwans AS, Hewett SJ. Enhanced release of synaptic glutamate underlies the potentiation of oxygen-glucose deprivation-induced neuronal injury after induction of NOS-2. Exp Neurol. 2004;190(1):91–101. doi: 10.1016/j.expneurol.2004.06.018. [DOI] [PubMed] [Google Scholar]
- 67.Hewett SJ, Espey MG, Uliasz TF, Wink DA. Neurotoxicity of nitroxyl: insights into HNO and NO biochemical imbalance. Free Radic Biol Med. 2005;39(11):1478–88. doi: 10.1016/j.freeradbiomed.2005.07.007. [DOI] [PubMed] [Google Scholar]
- 68.Kim SF, Huri DA, Snyder SH. Inducible nitric oxide synthase binds, S-nitrosylates, and activates cyclooxygenase-2. Science. 2005;310(5756):1966–70. doi: 10.1126/science.1119407. [DOI] [PubMed] [Google Scholar]
- 69.Guastadisegni C, Minghetti L, Nicolini A, Polazzi E, Ade P, Balduzzi M, Levi G. Prostaglandin E2 synthesis is differentially affected by reactive nitrogen intermediates in cultured rat microglia and RAW 264.7 cells. FEBS Lett. 1997;413(2):314–8. doi: 10.1016/s0014-5793(97)00925-3. [DOI] [PubMed] [Google Scholar]
- 70.Patel R, Attur MG, Dave M, Abramson SB, Amin AR. Regulation of cytosolic COX-2 and prostaglandin E2 production by nitric oxide in activated murine macrophages. J Immunol. 1999;162(7):4191–7. [PubMed] [Google Scholar]
- 71.Datta PK, Dhupar S, Lianos EA. Regulatory effects of inducible nitric oxide synthase on cyclooxygenase-2 and heme oxygenase-1 expression in experimental glomerulonephritis. Nephrol Dial Transplant. 2006;21(1):51–57. doi: 10.1093/ndt/gfi135. [DOI] [PubMed] [Google Scholar]
- 72.Vidwans AS, Uliasz TF, Hewett JA, Hewett SJ. Differential modulation of prostaglandin H synthase-2 by nitric oxide-related species in intact cells. Biochemistry. 2001;40(38):11533–42. doi: 10.1021/bi0108960. [DOI] [PubMed] [Google Scholar]
- 73.Clark SR, Anning PB, Coffey MJ, Roberts AG, Marnett LJ, O’Donnell VB. Depletion of iNOS-derived nitric oxide by prostaglandin H synthase-2 in inflammation-activated J774.2 macrophages through lipohydroperoxidase turnover. Biochem J. 2005;385(Pt 3):815–21. doi: 10.1042/BJ20041353. [DOI] [PMC free article] [PubMed] [Google Scholar]
- 74.Hsiao HY, Mak OT, Yang CS, Liu YP, Fang KM, Tzeng SF. TNF-alpha/IFN-gamma-induced iNOS expression increased by prostaglandin E2 in rat primary astrocytes via EP2-evoked cAMP/PKA and intracellular calcium signaling. Glia. 2007;55(2):214–23. doi: 10.1002/glia.20453. [DOI] [PubMed] [Google Scholar]
- 75.Ribeiro M, Cella M, Farina M, Franchi A. Effects of aminoguanidine and cyclooxygenase inhibitors on nitric oxide and prostaglandin production, and nitric oxide synthase and cyclooxygenase expression induced by lipopolysaccharide in the estrogenized rat uterus. Neuroimmunomodulation. 2004;11(3):191–8. doi: 10.1159/000076768. [DOI] [PubMed] [Google Scholar]
- 76.Petrova TV, Akama KT, Van Eldik LJ. Cyclopentenone prostaglandins suppress activation of microglia: Down-regulation of inducible nitric-oxide synthase by 15-deoxy-Delta 12,14-prostaglandin J2. PNAS. 1999;96(8):4668–4673. doi: 10.1073/pnas.96.8.4668. [DOI] [PMC free article] [PubMed] [Google Scholar]