Abstract
To detect and quantify multiple distinct populations of cells circulating simultaneously in the blood of living animals, we developed a novel optical system for two-channel, two-photon flow cytometry in vivo. We used this system to investigate the circulation dynamics in live animals of breast cancer cells with low (MCF-7) and high (MDA-MB-435) metastatic potential, showing for the first time that two different populations of circulating cells can be quantified simultaneously in the vasculature of a single live mouse. We also non-invasively monitored a population of labeled, circulating red blood cells for more than two weeks, demonstrating that this technique can also quantify the dynamics of abundant cells in the vascular system for prolonged periods of time. These data are the first in vivo application of multichannel flow cytometry utilizing two-photon excitation, which will greatly enhance our capability to study circulating cells in cancer and other disease processes.
INTRODUCTION
There is intense interest in analyzing circulating cells in the blood stream, including tumor cells and endothelial cells, to study cancer biology and response to therapy. The number of circulating tumor cells is an independent predictor of survival in patients with metastatic breast cancer [1]. The genotype of circulating tumor cells appears to be representative of cells in tumor tissue, suggesting that monitoring cancer cells in the blood may reveal genetic changes that occur over the course of disease [2]. Breast cancer cells also can be detected in the circulation of patients without clinical evidence of metastatic disease, although the biologic significance of these cells remains to be established [3]. Furthermore, changes in numbers of circulating endothelial cells have been used to monitor responses to therapy [4]. These data emphasize the significance of circulating cells for cancer biology and treatment and emphasize the need to define molecular features that regulate dynamics of circulating cells in living animals and patients.
One key obstacle to studies of circulating cells in mouse models of cancer and other diseases is the challenge of optically interrogating cells in the vascular system of living mice. Two approaches to so-called in vivo flow cytometry have been demonstrated in the vasculature of living mice [5, 6]; while these initial studies showed promise, they have been limited to detecting single color biomarkers. However, numbers of circulating cells enumerated with single-color detection may vary in response to changes in an animal’s physiology, such as vasoconstriction or fluctuations in heart rate, in addition to intrinsic changes in circulating cells. With single color detection of biomarkers, errors caused by different physiological conditions cannot be compensated. Thus, accurate assessments of circulating cells in vivo are difficult to obtain.
To simultaneously enumerate different populations of circulating cells under varying physiological conditions over time in an animal, we developed a novel two-photon flow cytometry system for two-channel detection of fluorescent cells in vivo. Although detection of circulating cells in vivo has been achieved in a confocal geometry using single-photon excitation [7], that technique has been limited to detection of a single fluorescent species. In contrast, our two-photon system has the important advantage of simultaneously detecting multiple cell populations because a single femtosecond near infrared (NIR) laser can be used to excite multiple fluorescent dyes via two-photon transitions. The large separation between NIR excitation and emission wavelengths attenuates scattered excitation light while collecting the entire fluorescence spectrum with high efficiency, thereby decreasing detection background [8]. Further, multiphoton excitation brings to in vivo flow cytometry all the advantages of multiphoton microscopy, such as reduced photodestruction outside the interrogated region [9]. We used this innovative system to quantify fluorescently labeled red blood cells in vivo for periods of more than two weeks and to monitor two populations of breast cancer cells in the same mouse. This research establishes two-photon flow cytometry for real-time studies of multiple circulating cell populations in vivo, which will advance our ability to probe the biology of circulating cells during disease progression and response to therapy.
MATERIALS AND METHODS
Two-photon flow cytometer
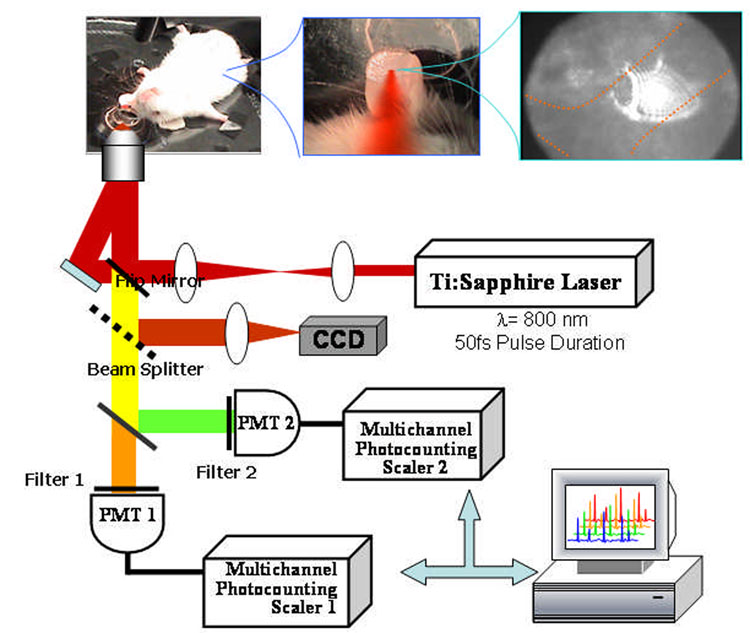
The two-photon flow cytometry apparatus (Fig. 1) used a Ti:Sapphire laser (Coherent Mira), which generates 50-fs pulses at 800 nm with a repetition rate of 76-MHz. The femtosecond NIR laser beam was focused with a long-working distance objective (Olympus 40x) into a blood vessel of a mouse ear. A dichroic mirror directed the laser into the microscope objective while transmitting the fluorescence collected through the same objective. A secondary dichroic mirror and bandpass filters were used to separate the fluorescence from different labeling dyes into two channels, which were detected with two distinct photomultiplier tubes (PMT Hamamatsu HC7421-40) and recorded with two multichannel photon counting scalers (MCS Stanford Research SR430) which are capable of time resolution as low as 41 microseconds. The signals (number of photons counted per each 1.3 ms bin of sampling interval) were sent to a computer for data analysis.
Figure 1.
Two-channel, two-photon flow cytometer for in vivo measurements.
For in vivo measurements, a custom-made heated stage was used to restrain anesthetized mice. An 8-mm diameter hole was drilled at the center of the stage, on top of which a glass slide was placed. The vasculature and blood flow of the mouse ear were visualized on a CCD camera via transmitted light from a fiber optic illuminator (EW-41500-50, Cole-Parmer).
A Matlab program was used to extract fluorescent peaks above the background noise level from the multi-channel photon counting scaler (MCS) trace signals. The particle detection threshold in a channel was set above the maximum signal level from control traces. The program scanned the trace signals for fluorescent peaks above the threshold. Once a peak was located, the peak characteristics, such as height (maximum fluorescent signal within the peak), width (number of consecutive bins above the background threshold) and location (the index of the maximum bin) were stored. For two-channel measurements, the data from each channel were analyzed separately. A double-peak event was treated as a single event if the fluorescent signal between the two peaks did not fall below the background threshold value.
The in vivo flow cytometry procedure
Five to six weeks old, specific-pathogen-free female immunocompromised nude (NU/NUCD-1 or NU/J Foxn1nu) or immunocompetent (CD-1) mice were purchased from Charles River Laboratories (Portage, Michigan) and housed in a specific pathogen-free animal facility at the University of Michigan Medical Center in accordance with the regulations of the University’s Committee on the Use and Care of Animals as well as with federal guidelines, including the principles of Laboratory Animal Care.
Prior to in vivo flow cytometry experiments, mice were injected with 0.5 ml of sterile saline heated to 37°C to maintain hydration. Mice were anesthetized with inhalation of isoflurane (4%) and then maintained on 1–2% isoflurane throughout experiments. For optical detection, mice were placed on a heated stage with the left ear on the glass slide window. Drops of glycerol were applied to the mice eyes to prevent drying. The femtosecond NIR laser beam was focused into the mouse ear with the objective from below. Microscope immersion oil was placed between the mouse ear and the glass slide to maintain the position of the ear during the cytometry measurement. When the short pass filter in the fluorescence collection optical path was switched off, the back-scattered light from the femtosecond NIR laser beam could be visualized on the CCD camera to align the excitation beam with the blood vessel. An ≈ 50 µm diameter arteriole flow was selected for cytometry measurements. The location of this arteriole was marked to allow subsequent measurements to be obtained from the same blood vessel.
Before injection of the solution of fluorescent-dye-labeled particles or cells, the background signals in both short wavelength channel (S-channel) and long wavelength channels (L-channel) were recorded as a control. Solutions containing the fluorescence-labeled particles were injected through the tail vein. In vivo flow cytometry typically began within 5 minutes of injection. The laser power used was below 20 mW at the focus, and no photodamage to the ear of the mice was observed after the experiments. During analysis, the thresholds were set such that no peaks existed in the control traces.
In vivo flow cytometry of fluorescent microspheres and DeepRed-labeled splenocytes
Two micron, yellow-green fluorescent (Ex505/Em515) microspheres (Molecular Probes, Inc. Eugene, OR) were washed, resuspended in 200 µl PBS (total number of beads 2.3 × 10⁹), and injected via tail vein to CD-1 mice. Spleens were collected from euthanized animals and were disrupted in PBS to obtain a single cell suspension, after which the cells were washed in PBS and the red blood cells were lysed using ammonium chloride. To stain the splenocytes, the cells were treated with Mitotracker™ DeepRed 633 (Molecular Probes, Inc. Eugene, OR), incubated for 1 hour at 37°C, trypsinized, rinsed and resuspended in PBS, pH 8. A total of 3.6 × 10⁶ DeepRed-labeled splenocytes were injected into a female NU/NU CD-1 mouse (chosen to prevent immune system recognition of the injected splenocytes). The two-channel fluorescence signals were recorded immediately after each injection for ten or twenty consecutive minutes and repeated at the same vessel location roughly 2 hours and also 1 day after the initial injection.
In vivo flow cytometry of DiD labeled red blood cells
Blood (25–50 µL) was collected from mice by retro-orbital puncture, and 12 µL were centrifuged to remove serum and the buffy coat as described above. Cells were washed once with PBS and then stained with 10 µL 1,1′-Dioctadecyl-3,3,3′,3′-tetramethyllindodicarbocyanine perchlorate (DiD, a lipophilic dye that labels membrane bilayers) (Vybrant DiD, Labeling Solution, Invitrogen) in 100 µL PBS for 30 minutes at 37°C. Cells were washed once in PBS to remove unincorporated DiD and then resuspended in 100 µL sterile 0.9% NaCl. Samples (containing approximately 1 × 10⁷ stained RBCs) were injected intravenously into a female NU/J Foxnlnu mouse via a tail vein for in vivo flow cytometry experiments. The long channel fluorescence signal was recorded at roughly the same vessel location several times over the next several weeks (0 minutes, 20 minutes, 5 hours, 24 hours, 48 hours, 4 days, and 17 days after injection). The frequency was calculated as the number of peaks in the L-channel within 214 seconds.
For measurements beginning on day 4, the location in the vessel was optimized manually in real time to maximize the amplitude and frequency of the detected events. This was possible since the large number of events enabled a frequency count every few seconds between manual adjustments of the objective. It is noteworthy that this improvement is only possible when the number of detected events is at least several per second, and thus cannot be used in one-color analysis of metastatic cancer cells or other rare populations of cells in the circulation.
Conventional flow cytometry of red blood cells
Blood samples (50–100 µL) were collected from mice via retro-orbital puncture using heparinized capillary tubes. Blood was transferred to heparinized microfuge tubes and centrifuged for 1 min at 10,000 RPM. Serum and the buffy coat were removed, and the cell pellet was resuspended in 750 µL FACS buffer (PBS with 0.1% sodium azide and 1% heat-inactivated fetal calf serum). Flow cytometry was performed on a FACS Calibur System (BD Biosciences), and data were analyzed with CellQuest software.
In vivo flow cytometry of two cell lines labeled with two color quantum dots
To simultaneously monitor circulating MCF-7 and MDA-MB-435 in the same mouse in vivo, cells were labeled with 15 nM or 7.5 nM of Qtracker quantum dots (Invitrogen) that emit at 585 nm (Qdot585) or 655 nm (Qdot655), respectively. Quantum dots were mixed with an equal volume of transfection reagent provided with the Qtracker kit according to the manufacturer’s protocol. Breast cancer cells were seeded at 4 × 10⁶ cells/60 mm dish (MDA-MB-435) or 3 × 10⁶ cells per dish (MCF-7) 6 hours prior to labeling with quantum dots mixed with 200 µL of cell culture medium. Cells were rocked every 15 minutes for 1 hour to distribute the quantum dots, and cell culture medium then was added to a final volume of 4 ml to continue labeling overnight. Cells were treated with 2 mM EDTA to release them from the culture dish, washed with PBS, and resuspended in sterile 0.9% saline for injection. Because initial studies with these cells suggested that fewer MDA-MB-435 cells could be detected immediately after injection, we injected twice as many of these cells: 1 × 10⁶ 435 cells were coinjected with 0.5 × 10⁶ MCF-7 cells in 125 µL PBS. The two-channel fluorescence signals were recorded immediately after each injection and repeated at the same vessel location roughly 2 hours and 1 day after the initial injection. Another set of mice were injected with tumor cells labeled with the reverse pattern of quantum dots (MCF-7 labeled with Qdot585 and MDA-MB-435 labeled with Qdot655) to confirm that the particular fluorophore assignment does not influence the detectability of these cell lines in vivo.
RESULTS
Monitoring circulating fluorescent particles in vivo
As initial validation of the two-photon technique for in vivo flow cytometry, we labeled splenocytes ex vivo with the fluorescent dye DeepRed and injected these cells intravenously into mice. Within 30 seconds after the start of detection, we detected fluorescent peaks from DeepRed-labeled cells in the long wavelength detection channel (Fig. 2). Circulating splenocytes were monitored continuously over 20 minutes, at which point events dropped to less than 10% of their initial frequency (Fig. 3). Very low numbers of circulating splenocytes could be detected approximately 24 hours after injection (data not shown). These data were confirmed by standard ex vivo flow cytometry that showed rapid depletion of splenocytes from the circulation of mice.
Figure 2.
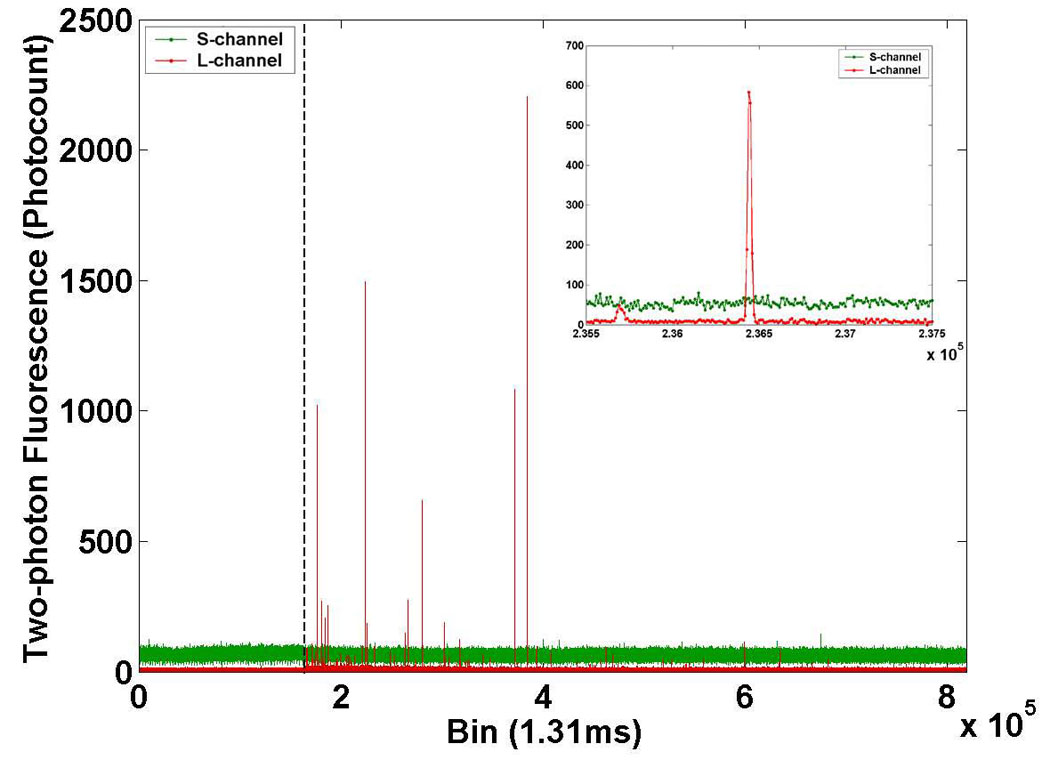
Two-channel raw data from the two-photon flow cytometer. Short wavelength channel (“S-channel,” green line) and long wavelength channel (“L-channel,” red line) traces in a mouse injected with DeepRed-labeled splenocytes at time zero (dashed line). The control trace is shown to the left of the dashed line. The data is essentially a histogram showing the number of photons counted by the multichannel scaler in each 1.31 ms bin on the x-axis. Detail of individual fluorescent peaks are shown in the inset.
Figure 3.
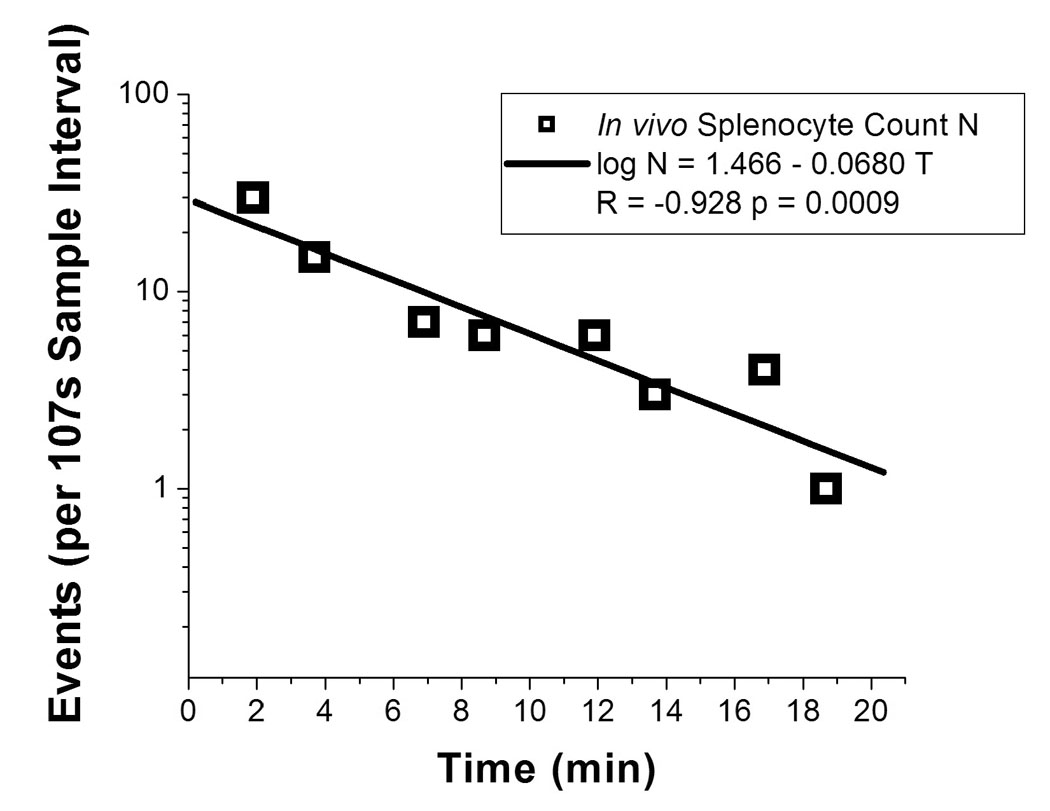
Depletion dynamics of injected cells. Number of detected events (log scale) are plotted over 20 minutes after the injection of 3.6 × 10⁶ DeepRed-labeled splenocytes at time 0.
We used fluorescent microspheres to verify that the system could detect signals in the short wavelength channel in vivo. Following intravenous injection of microspheres into CD-1 mice, large fluorescence peaks were detected only in the short wavelength channel. As expected, these synthetic microspheres cleared rapidly from the circulation and were not detectable approximately 24 hours after injection (data not shown). Overall, these initial studies establish the feasibility of using the two-photon flow cytometer to detect fluorescence in two different detection channels.
Monitoring of circulating red blood cells in vivo for extended periods of time
To establish that the two-photon flow cytometer could monitor an abundant population of cells for prolonged periods of time, we interrogated red blood cells (RBC) in the circulation of living mice over 17 days. RBC were labeled with the membrane dye 1,1′-Dioctadecyl-3,3,3′,3′-tetramethyllindodicarbocyanine perchlorate (DiD) and injected intravenously into nude mice. Numbers of RBC in repeated measurements were highly variable, despite focusing the laser at the same artery in the ear (Fig. 4). It was observed that the operator could significantly increase the number of detected events (and therefore sampled volume) by manually adjusting the laser focus during the course of data acquisition, presumably to the maximum flow position in the artery. In vivo data for circulating RBC were validated with conventional flow cytometry ex vivo on blood drawn on day 18. According to conventional flow, 4.40 % of 1.5 million blood cells counted were labeled with DiD. No labeled cells were detected by either conventional or two-photon flow cytometry 1.5 months after injection, which could be the result of clearance of cells from the circulation or instability of the dye for this period of time in blood.
Figure 4.
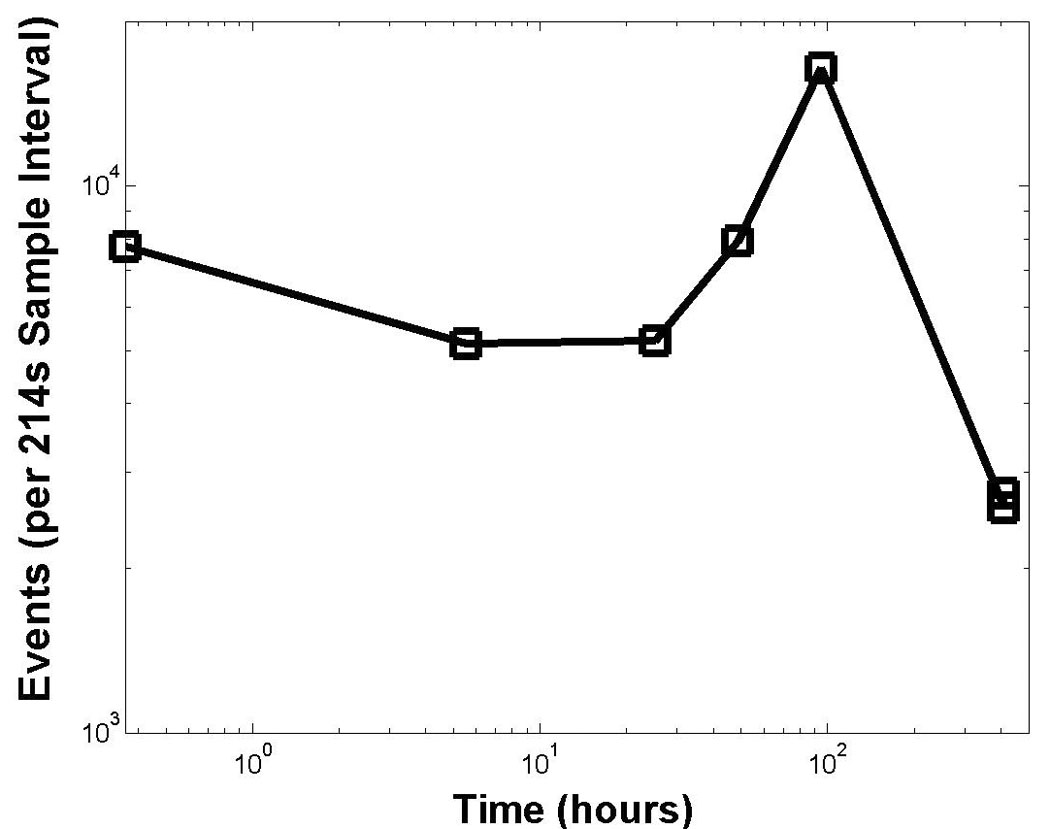
Monitoring for extended times in vivo. Number of detected circulating DiD-labeled RBCs are plotted after injection of approximately 1 × 10⁷ labeled RBCs at time 0. Focal point in the mouse ear was manually optimized for maximal counts in real time for measurements beginning at 100 hours. Both axes are log scale.
Simultaneous monitoring of two populations in the circulation of a mouse using two-color two-photon cytometry
To establish the capability of two-photon flow cytometry to enumerate two distinct, rare populations of circulating cells, we measured dynamics of two different breast cancer cell lines in the circulation of living mice. Human MDA-MB-435 cells are known to spontaneously form metastases in mice [10], while MCF-7 cells have very low metastatic potential [11]. Thus, we hypothesized that these cells would show differences in their circulation kinetics based on differences in ability to metastasize.
We enumerated circulating MDA-MB-435 and MCF-7 cells with in vivo two-photon flow cytometry at approximately 10, 100, and 1000 minutes after injection. As shown in Figure 5, the dynamics of each cell line in the circulation were markedly different. Ten minutes after injection, we detected approximately five hundred MCF-7 cells during a 430-second period of data acquisition. Numbers of MCF-7 cells at this time were more than 10-fold greater than MDA-MB-435 cells, despite the small difference in total numbers of cells injected. These data are similar to those reported by Georgakoudi et al., who showed using single channel in vivo flow cytometry that exit of prostate cancer cells from the circulation correlated with relative differences in metastatic potential [12]. Interestingly, MCF-7 cells cleared almost completely from the circulation by 1000 minutes after injection, while MDA-MB-435 cells remained detectable throughout the entire 1000 minutes of the experiment. Thus, the two cell lines had very different circulation kinetics. Both cell lines retained their detectability level in vivo when the quantum dot assignments were switched, indicating that the measured kinetics of each cell line were not biased by the emission wavelength of quantum dots. These data are consistent with prior work showing that behavior of quantum dot-labeled tumor cells and unlabeled cells in vivo are indistinguishable following tail vein injection [13].
Figure 5.
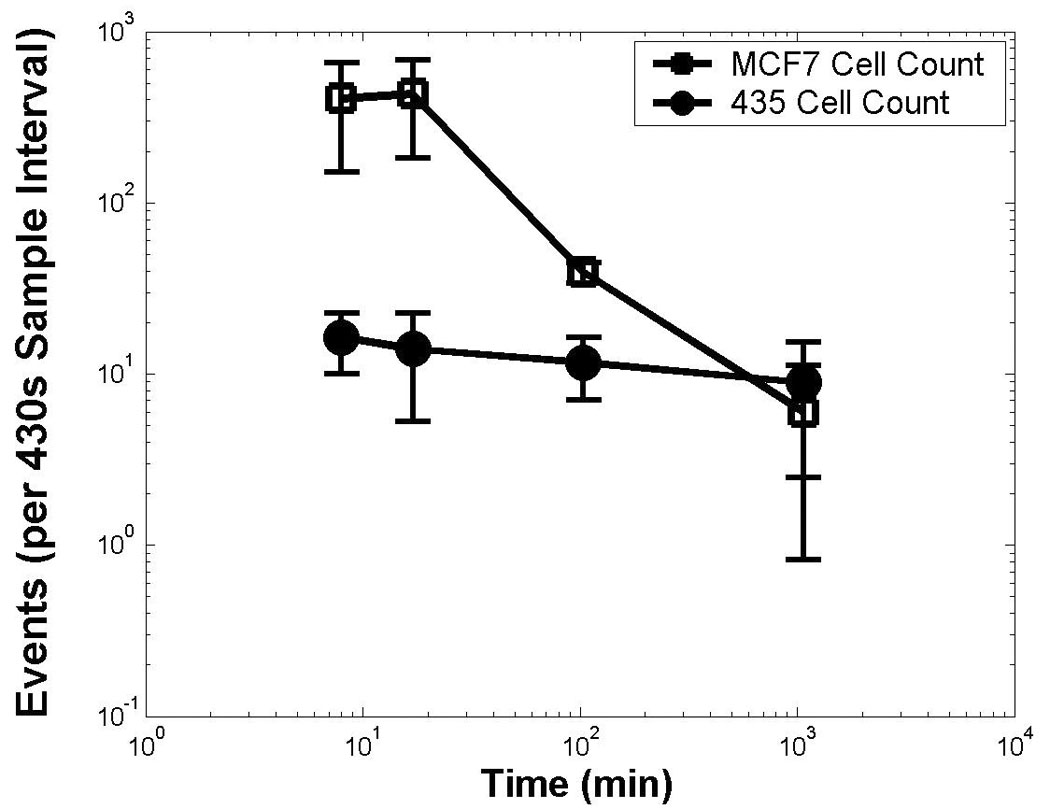
Simultaneous monitoring of two populations of circulating cancer cells. Detected events are shown after the injection of 5 × 10⁵ Qdot585 stained (low metastatic potential) MCF-7 cells simultaneously with 1 × 10⁶ Qdot665 stained (high metastatic potential) 435 cells into the same mouse at time 0. The frequency was calculated as the number of events counted in the short wavelength S-channel (open markers) or long wavelength L-channel (closed markers) within 430 seconds. The experiment was repeated in three different mice, and the average results are shown, with error bars indicating the variation over the three animals. Both axes are log scale.
Studies in vitro showed that the stability of labeling is comparable between 435 and MCF-7 cells, and both remain labeled adequately for detection for over 5–6 days. Microscopic analysis of excised organs further confirmed that cells retained quantum dot labels in vivo. Figure 6 shows representative fluorescence microscopy images of each cell line with quantum dots 48 hours after labeling. Conventional flow cytometry showed essentially 100% labeling efficiency with quantum dots in both cell lines and confirmed microscopic images for comparable persistence of labeling (data not shown). These data establish that differences between circulating MCF-7 and MDA-MB-435 cells are not due to differences in labeling between the two cell lines.
Figure 6.
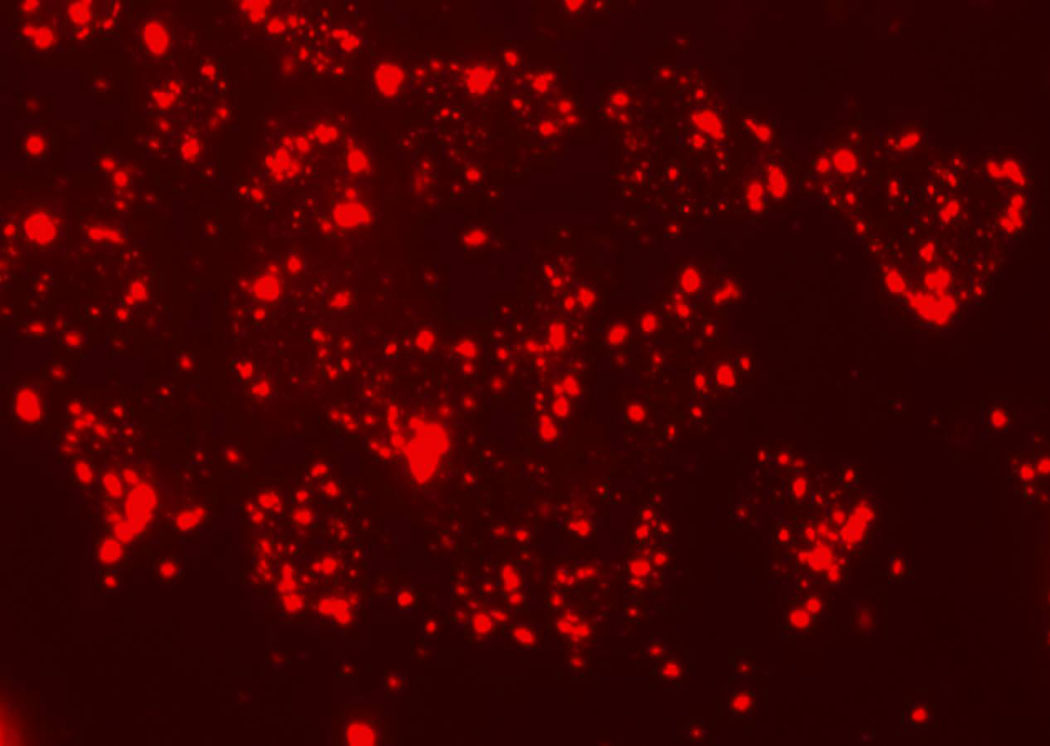
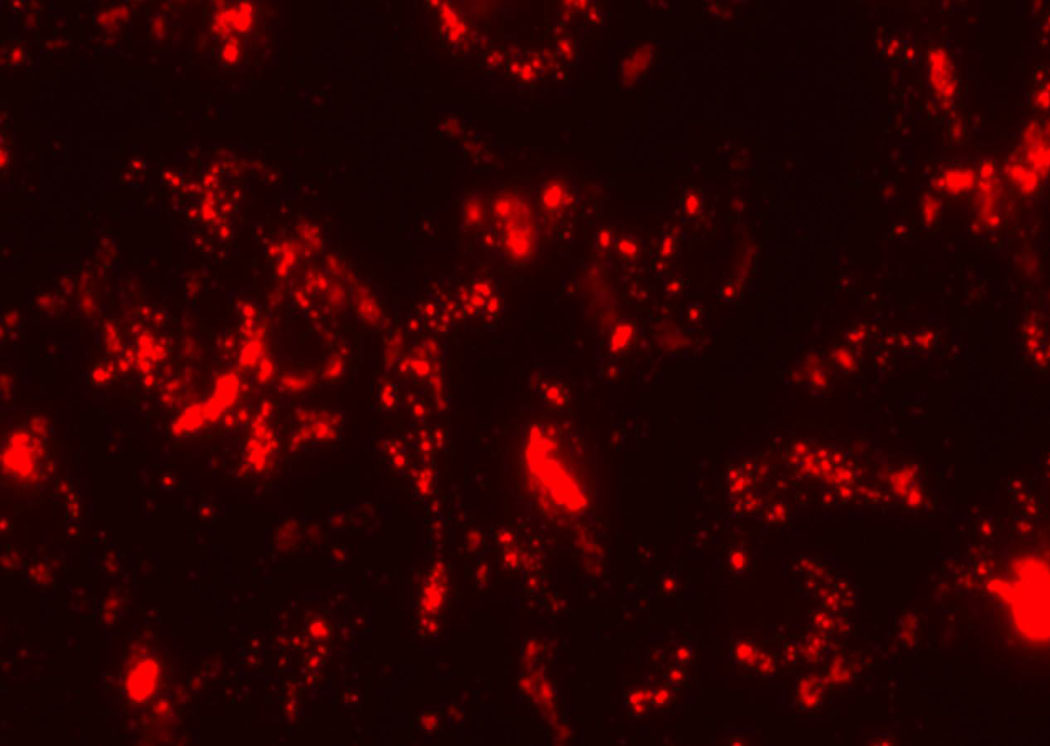
Representative fluorescence images 48 hours after labeling of (a) MCF-7 cells with 585 QDots and (b) MDA-MB-435 with 655 QDots.
To determine the relationship between circulating tumor cells and cells in tissues, we quantified numbers of quantum dot-labeled MDA-MB-435 and MCF-7 cells in excised lungs and liver 48 hours after injection. We found approximately 3-fold greater MDA-MB-435 cells in these organs than MCF-7. These data, in combination with the results of two-photon in vivo flow cytometry, suggest that greater numbers of 435 cells arrest in the lungs and liver initially and persist in these organs relative to MCF-7 cells. It is likely that fewer MCF-7 cells are detected by 48 hours because these cells are reported to undergo apoptosis in secondary organs, particularly in the absence of estrogen supplementation that these cells require for proliferation in mice. These data are consistent with previous studies showing that MCF-7 cells do not form metastases after tail vein injection [14].
DISCUSSION
Recent studies have focused attention on detecting and quantifying absolute numbers and dynamics of circulating cells in cancer and inflammation to determine disease prognosis, identify potential therapeutic targets, and monitor the response to therapy (reviewed in [15, 16]). To better understand normal and pathologic regulation of circulating cells, it is necessary to develop techniques that allow sensitive, long-term real-time monitoring of multiple populations of cells in vivo. The present study describes an innovative two-color two-photon flow cytometer that accomplishes these experimental objectives. Using this system, we were able to perform simultaneous two-color detection of multiple circulating cell lines in vivo, which has not been accomplished with previous techniques for in vivo flow cytometry.
Many unique studies are possible with the novel two-photon approach to in vivo flow cytometry. Investigations with RBCs show that an abundant population of cells can be monitored for periods of greater than two weeks, thereby establishing that the system can detect single events at high counting rates over extended periods of times. This may be enabled by the limitation of multiphoton absorption to the interrogated region, reducing potential collateral damage to tissues outside of the vessel lumen. Monitoring circulating cells over the course of weeks has not been demonstrated previously with other in vivo flow cytometers. Interrogating populations of hematopoietic cells, such as red blood cells (RBCs) or leukocytes, could provide new insights into normal physiology or disease processes, as well as serving as an internal standard for hemodynamics and perfusion. For example, if the dynamics of a cell population, such as RBCs, are well known, this provides a statistically reliable internal control of the interrogated blood volume per unit time, if more than one detection channel is available (as in our unique multiphoton system).
Variations in measurements during the RBC experiment emphasize the importance of multiple channel detection. While single channel in vivo flow cytometry is sufficient for a qualitative analysis of circulating cell dynamics, it is generally limited by variations in event counts in repeated experiments. Between separate times of detection, blood flow velocity at the measurement site may vary. This occurs on a short time-scale due to pulsatile flow, but also on a longer time scale due to drift in the positioning of the laser focus. This can be caused when the anesthetized mouse changes position slightly, which results in the laser focusing on a site closer to the wall of the vessel, where blood flow velocity is lower. Further, physiological conditions can be highly variable between experiments, whether examining the same or a different mouse. These factors are compounded by statistical fluctuations when small sample sets are acquired for studies of rare circulating cells. Without a means to determine the volume and total events sampled over a given time interval, these issues will complicate the analyses of populations of cells in mice using single color flow cytometry.
With multicolor, two-photon in vivo flow cytometry, different populations of cells can be compared simultaneously in a single animal with a single laser source, overcoming many variables intrinsic to in vivo experiments. In particular, we used this technique to quantify two populations of breast cancer cells in the same mouse and demonstrated intrinsic differences in the dynamics of these cells in the circulation. Because we can monitor multiple cell populations in the same animal, two-photon flow cytometry greatly reduces experimental variability related to animal-to-animal differences in perfusion. We expect that further studies will allow us to interrogate functions of specific molecules implicated in metastatic breast cancer, such as the chemokine CXCL12 and its receptor CXCR4 [17]. These types of studies may improve our understanding of circulating cancer cells and the progression to metastatic disease. These would also facilitate the in vivo testing of new compounds targeted against specific molecules or pathways.
One challenge to in vivo cytometry is the small number of labeled cells passing through the blood vessel in the detection region. Using the simultaneous injection of labeled RBCs as a reference control for focal point optimization will enable far more reliable experiments on rare event circulation dynamics. One solution to increase the statistical power of the measurements would be to access larger blood vessels with higher flow rates, thereby increasing the number of detected cells; this should be enabled by the ability of the femtosecond NIR laser source to penetrate much deeper through biological tissue than a continuous wave laser in visible region for one-photon excitation [18], and to potentially reduced photo damage to surrounding tissue for extended monitoring.
We anticipate that two-photon flow cytometry will greatly enhance our ability to interrogate circulating cells in pre-clinical models of cancer and other diseases. For example, we envision that this technology can be used to investigate 1) changes in gene expression in circulating cells through imaging probes injected into mice or genetically-engineered cell lines with fluorescent reporters; and 2) analyze effects of specific adhesion molecules in trafficking of cancer or immune cells using genetically-engineered mice. These studies will be aided by technical advances such as the real-time imaging of blood vessels to monitor and control the position of the laser beam throughout the experiment and the development of approaches to label specific cells in vivo, rather than ex vivo.
ACKNOWLEDGMENTS
This project has been funded in whole or in part with Federal funds from the NASA Ames Research Center, National Aeronautics and Space Administration, under Contract No. NAS2-02069. Funding also is provided by the Susan Komen Foundation, Sidney Kimmel Foundation, JTM Research, and NIH P50 CA93990. ET was supported by an NSF Graduate Research Fellowship.
Footnotes
Publisher's Disclaimer: This is a PDF file of an unedited manuscript that has been accepted for publication. As a service to our customers we are providing this early version of the manuscript. The manuscript will undergo copyediting, typesetting, and review of the resulting proof before it is published in its final citable form. Please note that during the production process errors may be discovered which could affect the content, and all legal disclaimers that apply to the journal pertain.
REFERENCES
- 1.Cristofanilli M, Budd GT, Ellis MJ, Stopeck A, Matera J, Miller MC, Reuben JM, Doyle GV, Allard WJ, Terstappen LW, Hayes DF. N Engl J Med. 2004;351:781–791. doi: 10.1056/NEJMoa040766. [DOI] [PubMed] [Google Scholar]
- 2.Meng S, Tripathy D, Shete S, Ashfaq R, Saboorian H, Haley B, Frenkel E, Euhus D, Leitch M, Osborne C, Clifford E, Perkins S, Beitsch P, Khan A, Morrison L, Herlyn D, Terstappen L, Lane N, Wang J, Uhr J. PNAS. 2006;103:17361–17365. doi: 10.1073/pnas.0608113103. [DOI] [PMC free article] [PubMed] [Google Scholar]
- 3.Meng S, Tripathy D, Frenkel EP, Shete S, Naftalis EZ, Huth JF, Beitsch PD, Leitch M, Hoover S, Euhus D, Haley B, Morrison L, Fleming TP, Herlyn D, Terstappen LW, Fehm T, Tucker TF, Lane N, Wang J, Uhr JW. Clin Cancer Res. 2004;10:8152–8162. doi: 10.1158/1078-0432.CCR-04-1110. [DOI] [PubMed] [Google Scholar]
- 4.Mancuso P, Colleoni M, Calleri A, Orlando L, Maisonneuve P, Pruneri G, Agliano A, Goldhirsch A, Shaked Y, Kerbel RS, Bertolini F. Blood. 2006;108:452–459. doi: 10.1182/blood-2005-11-4570. [DOI] [PMC free article] [PubMed] [Google Scholar]
- 5.Novak J, Georgakoudi I, Wei X, Prossin A, Lin CP. Optics Letters. 2004;29:77–79. doi: 10.1364/ol.29.000077. [DOI] [PMC free article] [PubMed] [Google Scholar]
- 6.Zharov V, Galanzha E, Tuchin V. Journal of Biomedical Optics. 2005;10 doi: 10.1117/1.2060567. [DOI] [PubMed] [Google Scholar]
- 7.Lee H, Alt C, Pitsillides CM, Puoris'haag M, Lin CP. Optics Express. 2006;14:7789–7800. doi: 10.1364/oe.14.007789. [DOI] [PMC free article] [PubMed] [Google Scholar]
- 8.Konig K. J Microsc. 2000;200:83–104. doi: 10.1046/j.1365-2818.2000.00738.x. [DOI] [PubMed] [Google Scholar]
- 9.Denk W, Svoboda K. Neuron. 1997;18:351–357. doi: 10.1016/s0896-6273(00)81237-4. [DOI] [PubMed] [Google Scholar]
- 10.Price JE, Polyzos A, Zhang RD, Daniels LM. Cancer Res. 1990;50:717–721. [PubMed] [Google Scholar]
- 11.McLeskey SW, Kurebayashi J, Honig SF, Zwiebel J, Lippman ME, Dickson RB, Kern FG. Cancer Res. 1993;53:2168–2177. [PubMed] [Google Scholar]
- 12.Georgakoudi I, Solban N, Novak J, Rice W, Wei X, Hasan T, Lin C. Cancer Res. 2004;64:5044–5047. doi: 10.1158/0008-5472.CAN-04-1058. [DOI] [PubMed] [Google Scholar]
- 13.Voura EB, Jaiswal JK, Mattoussi H, Simon SM. Nature Medicine. 2004;10:993–998. doi: 10.1038/nm1096. [DOI] [PubMed] [Google Scholar]
- 14.Alix-Panabieres C, Brouillet JP, Fabbro M, Yssel H, Rousset T, Maudelonde T, Choquet-Kastylevsky G, Vendrell JP. J Immunol Methods. 2005;299:177–188. doi: 10.1016/j.jim.2005.02.007. [DOI] [PubMed] [Google Scholar]
- 15.Luster A, Alon R, von Andrian U. Nature Immunology. 2005;6:1182–1190. doi: 10.1038/ni1275. [DOI] [PubMed] [Google Scholar]
- 16.Goon PK, Boos CJ, Stonelake PS, Lip GY. Future Oncol. 2005;1:813–820. doi: 10.2217/14796694.1.6.813. [DOI] [PubMed] [Google Scholar]
- 17.Luker K, Luker G. Cancer Lett. 2006;238:30–41. doi: 10.1016/j.canlet.2005.06.021. [DOI] [PubMed] [Google Scholar]
- 18.Gu M, Gan X, Kisteman A, Xu MG. Applied Physics Letters. 2000;77:1551. [Google Scholar]


