

Abstract
A major scientific challenge at the present time for cancer research is the determination of the underlying biological basis for cancer development. It is further complicated by the heterogeneity of cancer's origin. Understanding the molecular basis of cancer requires studying the dynamic and spatial interactions among proteins in cells, signaling events among cancer cells, and interactions between the cancer cells and the tumor microenvironment. Recently, it has been proposed that large‐scale protein expression analysis of cancer cell proteomes promises to be valuable for investigating mechanisms of cancer transformation. Advances in mass spectrometry technologies and bioinformatics tools provide a tremendous opportunity to qualitatively and quantitatively interrogate dynamic protein–protein interactions and differential regulation of cellular signaling pathways associated with tumor development. In this review, progress in shotgun proteomics technologies for examining the molecular basis of cancer development is presented and discussed.
Keywords: Quantitative proteomics, Shotgun proteomics, Mass spectrometry, Cancer cells, Protein profiling
1. Introduction
Despite recent advances in the diagnosis and treatment of cancer, tumor cell progression and metastasis continue to be a major cause of morbidity and mortality in cancer patients. Understanding the molecular and cellular mechanisms that contribute to tumor formation, progression and metastasis has been a major challenge in cancer research. For many years, progress in cancer research has been dominated by the concepts and methods of molecular genetics, but advances in technologies for protein analysis over the last ten years have accelerated studies of cancer biology at the protein level. It is clear from molecular genetics that mutations alter the “command and control” programs of the cell to accelerate growth and inhibiting cell death. Genomic instability further contributes to functional plasticity that allows cancer cells to adapt to environments, increase cell motility, and metastasize. To understand the molecular changes that create these phenotypic changes proteomic methods are now being used to study alterations in protein expression, modifications, and enzyme activity (Olsen et al., 2006; Liu et al., 1999) that accompany malignant changes. By identifying key proteins and the regulatory changes that accompany them further insight will be gained into the evolutionary process of malignant cells evolving new functions and phenotypes.
A cancer cell like other cells is complex and has a range of protein abundances. Cancer cells have altered both transcriptional programming and post‐translational protein modifications to gain advantage in both growth and motility (Albertson et al., 2003; Birchmeier et al., 2003). To determine changes for both protein expression and post‐translational modifications on a global or pathway level requires sophisticated technology. Proteomic technologies have been rapidly advancing to meet the challenges posed in biology by increasing the scale of protein identification and protein quantification (both relative and absolute), and enrichment and identification of post‐translational modifications. In particular, precise quantitative measurements are key to understanding relationships between normal cellular biology and the aberrant biology observed in cancer cells. Discovery of modification changes is being broadened beyond the study of modification changes associated with phosphorylation to better understand the roles of ubiquitin, sumoylation, acetylation and methylation in loss of growth control.
2. Challenge of biological complexity
The ability to identify proteins and changes in their abundance that correlate with disease progression is fundamental for exploitation of proteomics for studying cancer biology. However, a major limitation to molecular profiling of cancer cells continues to be the challenge of biological complexity. During the last decade, the field of proteomics has evolved rapidly to overcome technical limitations to improve the dynamic range and reproducibility of large‐scale proteomic analyses. In particular, advances in mass spectrometry instrumentation and bioinformatics for “bottom‐up” or “shotgun” proteomic approaches have been at the core of new developments to meet the challenge of biological complexity. These and other methods are striving to provide a more comprehensive view of the multi‐factorial processes occurring during cancer progression.
2.1. Protein complexity in biological samples
Several sources have been explored to generate valid comparisons for studying cancer proteome: cancer cell lines, human tissues, and body fluids such plasma (Table 1).
Table 1.
A comparison of biological samples available for studying cancer proteome
| Cancer cell line | Human tissue | Body fluids/plasma | |
|---|---|---|---|
| Advantages | Low cost | High physiological/pathological relevance | Low cost |
| Renewable source | High physiological/pathological relevance | ||
| Easy for gene manipulation | Easy to obtain from patients/ renewable source | ||
| Good for mechanistic investigation | |||
| Disadvantages | Require validation for physiological/pathological relevance | Higher cost | Higher protein complexity |
| Clonal selection | Limited availability | High dynamic range in protein concentrations | |
| Non‐renewable source | |||
| Large variations among samples |
2.1.1. Cancer cell lines
A variety of cancer cell lines have been established to mimic different stages of cancer progression. They are widely used in many aspects of cancer research and particularly as in vitro models. There are several advantages to using the cell culture system to study cancer progression. They are easy to handle and represent an unlimited self‐replicating source which yields a large amount of biological material for proteomic studies. Second, cell lines exhibit a relatively high degree of homogeneity and can be manipulated genetically for mechanistic studies. However, there are disadvantages. Cell lines are prone to genotypic and phenotypic drifts during the process of cell culture. Subpopulations may arise and cause phenotypic changes over time by the selection of specific, more rapidly growing clones within the population (Osborne et al., 1987).
2.1.2. Human tissues
Proteomic technologies have been used in clinical investigation using human tissues. Comparisons between normal and cancer tissues can be performed using the entire section of the tissue (Chaurand et al., 2006, 1999, 2006, 2005) or laser capture microdissection of tissues (Baker et al., 2005; Zang et al., 2004; Xu et al., 2002). The ability to simultaneously and comprehensively examine changes in large numbers of proteins in the context of disease or other changes in physiological conditions allows better understanding for disease progression and novel therapeutic discoveries. However, the amount and availability of human tissues can be limiting factors for clinical proteomic studies. Also, inherent variations among individual patients require a great deal of biological and technical replications for reproducibility. Therefore, studies using human tissues must be carefully designed to differentiate true clinical differences in protein expression from variation in sample collection, variation in experimental condition, and normal biological variability (Clarke et al., 2003).
2.1.3. Body fluids/plasma
Using proteomic approaches to define protein profiles/pattern of easily accessible body fluids such as urine, saliva and, plasma has been explored as new avenues to distinguish cancer from non‐cancer patients (Roelofsen et al., 2007; Hu et al., 2007; de Noo et al., 2006; Anderson et al., 2004; Anderson and Anderson, 2002). Plasma, in particular, represents an attractive source for disease biomarker discovery and early disease prediction. However, characterizing the proteome of biological fluids presents significant challenges due to extreme complexity and large dynamic range in protein concentrations. For example, peptides derived from the most abundant proteins with similar mass/charge ratios and retention times as the lower abundant peptides can cause significant ion suppression and mask ion signals from low abundant species. Therefore, considerable improvement in immunoaffinity depletion and various fractionation strategies in combination with the new LC/MS platforms have been employed to increase the coverage and sensitivity for characterizing the plasma proteome (Pieper et al., 2003; Qian et al., 2006; Liu et al., 2006; Lee et al., 2006).
2.2. Dealing with protein complexity
Two fundamental strategies have begun to evolve for the analysis of complex protein mixtures. The first strategy, referred to as differential proteomics, is best illustrated by two‐dimensional gel electrophoresis (2‐DGE). Proteins from two different states (at least two) are separated by 2‐DGE and differences determined. Only those proteins that are unique to one state or have increased or decreased in abundance are then pursued for identification. Identification often involves removing the protein or “spot” from the gel, proteolytic digestion and mass spectrometry analysis (Hamdan and Righetti, 2003; Gorg et al., 2004). Clearly this approach benefits from high‐resolution separations, a large dynamic range, and reproducibility. Improvements in the technology have resulted from the use of different “color” fluorescent dyes to allow a single gel comparison of different states (Unlu et al., 1997; Righetti et al., 2004; Marouga et al., 2005). Two‐dimensional difference gel electrophoresis (DIGE) is similar in concept to a microarray analysis and creates substantial improvements in reproducibility because both states are subjected to the same separation conditions. A non‐gel approach to this type of comparison has been developed by Yoo et al. (2007). Rather than use a gel to separate proteins, two stages of liquid chromatography that mimic the 2‐DGE separation by involving chromatofocusing and reversed‐phase separation are used (Wall et al., 2000). Fractions are collected in 96‐well microtiter plates that are more convenient for downstream analytical methods. Again, two states are compared and only those fractions representing differences (by UV absorption) are further analyzed by mass spectrometry (Buchanan et al., 2005). In both systems the process works best when high‐resolution separation is achieved which improves dynamic range and then differences can be better compared.
In contrast to differential proteomics the second strategy, shotgun proteomics, digests proteins to peptides and then compares identities or patterns of peptides. Peptides are then used as a surrogate to measure the presence or abundance of proteins. Technologically, peptides are easier to identify using mass spectrometry based techniques than intact proteins although the concept of “top down” protein analysis using mass spectrometry is improving rapidly (Kelleher and Hicks, 2005; Du et al., 2006). A comparison between the gel‐based (1‐DGE and 2DGE) and LC–MS/MS‐based (shotgun proteomics) is illustrated in Figure 1.
Figure 1.
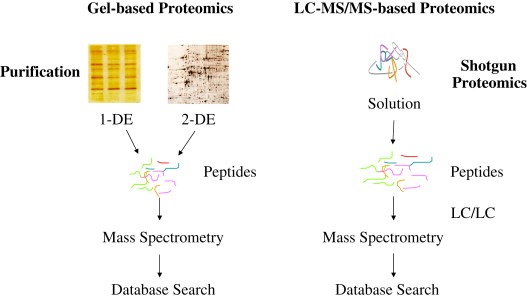
Comparison between gel‐based proteomics and LC–MS/MS‐based proteomics.
2.2.1. Shotgun proteomics
Shotgun proteomics consists of four distinct steps. The first step, and perhaps one of the most critical, is preparation of the sample. The next step is separation of peptides and then analysis by mass spectrometry and the final step is informatics to analyze the mass spectrometry data and assess the results.
2.2.1.1. Sample preparation
Inefficient digestion of the protein mixture can result in poor and irreproducible data collection, and thus efficient and complete denaturation is essential to insure comprehensive digestion. Furthermore, proteins that are typically difficult to solubilize in aqueous buffers such as membrane proteins can also be a challenge to digest. Proteins are often solubilized and denatured using chaotropes such as urea or detergents. Trypsin or a two‐step digestion process with endoproteinase LysC followed by trypsin is frequently used (Levander et al., 2004; Link et al., 1999; Washburn et al., 2001). An advantage to the shotgun proteomic method is the ability to better identify and analyze membrane proteins (Abe et al., 2004). Two basic strategies have been employed for membrane proteins. The first maintains the membrane proteins in the lipid bilayer and digests the exposed regions using either a specific protease such as trypsin or a non‐specific protease like Proteinase K. When Proteinase K is used, a high pH is employed to linearize the lipid bilayer (Howell and Palade, 1982) to improve exposure of the membrane protein to the protease. Organic solvents have also been used to solubilize membrane proteins in the absence of the lipid bilayer (Blonder et al., 2002). The use of traditional detergents such as SDS has been a long standing problem because of compatibility with liquid chromatography and mass spectrometry, but new mass spectrometry compatible detergents have alleviated many of the problems (Klammer and MacCoss, 2006). Each type of sample (e.g. cells, tissues) may require some optimization of the digestion process to insure the digestion is complete.
2.2.1.2. Separating peptides for analysis
Shotgun proteomic strategies convert a complex protein mixture to an even more complicated peptide mixture. In general the complexity conversion factor is about 40×, that is, on average a protein will digest to yield ∼40 peptides. It is important, however, to maintain sensitivity at the ionization source of the mass spectrometer and this often requires minimizing the elution volume as electrospray ionization is a concentration dependent process. A simple rule of thumb is to keep flow rates low and peptide peak widths narrow. To resolve complex peptide mixtures, high‐resolution HPLC separations are necessary to maximize peptide separation for acquisition of tandem mass spectra. Advances in HPLC technology such as ultra high pressure pumps allow the use of small diameter supports to affect higher resolution separation at higher speed and these advances improve our ability to resolve the increased complexity of digested protein mixtures (Motoyama et al., 2006). Improvements in resolution can also be obtained by using multi‐dimensional separations (LC/LC) (Link et al., 1999; Larmann et al., 1993; Opiteck and Jorgenson, 1997; Wei et al., 2005; McDonald et al., 2002; Wolters et al., 2001). These can be performed either on‐line or off‐line of the mass spectrometer and frequently involve the use of strong cation ion exchange in combination with reversed‐phase chromatography (Lee et al., 2002). Multi‐phase peptide separation utilizes different properties of peptides such as charge and hydrophobicity to increase resolution (Liu et al., 2002). Alternate ion exchange strategies are emerging that use mixed bed ion exchange phases, such as a mixture of strong cation exchange and weak anion exchange (Motoyama et al., 2007). Thousands of peptides can be resolved by LC/LC/MS/MS that result in hundreds or thousands of protein identifications. Additional improvements are still needed but often there is a trade‐off between the time required to achieve greater resolution and the need for throughput. If more time is required for an experiment, then fewer experiments can be performed.
2.2.1.3. Mass spectrometry technology for peptide analysis
The mass spectrometer is a key component to convert peptides into knowledge about the peptide sequences present. A variety of mass spectrometry technologies are in use to analyze peptides, but tandem mass spectrometers are often used for peptide sequence identification. Two trends have been appearing in tandem mass spectrometers. The first trend has been the development of rapid scanning instruments such as the linear ion trap mass spectrometer. This capability has been useful for the analysis of complex peptide mixtures and the increased scan speeds have been important to take advantage of the higher resolving separations capable with ultra high pressure HPLC separations. Linear ion traps have greater ion capacities than the older three‐dimensional ion traps and thus sensitivity and data quality is better (Schwartz et al., 2002). These instruments have been very effective for proteomic studies.
The second area is the rise of the hybrid instrument to create improved capabilities for proteomics. A linear ion trap has been combined with quadrupole mass filters (Q1 and Q2) to provide a versatile instrument capable of tandem mass spectrometry in the ion trap (tandem MS in time) and MS/MS using the Q1 to select ions, a collision cell (Q2) to dissociate ions and the linear trap for analysis of m/z values (tandem MS in space) (Hager and Yves Le Blanc, 2003). In this configuration the instrument can also perform single ion monitoring for hypothesis driven experiments, where you know what proteins might be present in a mixture and the instrument is set up to pass only that m/z value, fragment the ion and monitor the signal for one of the fragment ions. This strategy is capable of very precise measurements and is used when global measurements are not needed. Hybrids incorporating high resolution, high mass accuracy analyzers such as the Fourier transform ion cyclotron resonance (FTMS) and Orbitrap (also a form of FTMS) have also become incredibly useful for proteomics. A major limitation for FTMS has been the ability to perform routine and general tandem mass spectrometry and the ability to acquire high quality m/z data on a chromatography time scale. FTMS instruments are ion‐trapping devices that are sensitive to the size of the ion population injected into the ion trap. Too few ions and signal to noise is poor, too many ions and space charging (ions of like charge perturbing the natural motion of ions in the external field, e.g. magnetic or electric) is a factor. By creating a hybrid instrument with a device to initially store ions before injection in the FT ion trap, the capability to perform MS/MS or to count ions is enabled. Two devices, the LTQ‐FTMS and LTQ‐Orbitrap, use a linear ion trap to store, manipulate and count ions before injection into the FTMS (Syka et al., 2004; Yates et al., 2006). Tandem mass spectrometry can be performed in the linear ion trap and fragment ions measured in this analyzer or the fragment ions can be transferred into the FTMS for analysis. Thus, fragment ions can be measured with low or high resolution. Because of throughput issues most users operate the instrument with high‐resolution precursor ion measurement and low‐resolution acquisition of tandem mass spectra. An advantage to this technology is the ability to measure ions with 60–100,000s of resolution and mass accuracy of 1–3ppm on a chromatographic time scale (Syka et al., 2004; Yates et al., 2006). Mass spectrometry technology continues to evolve creating more capability and opportunity in proteomics. An in‐depth review of different MS intrumentation and applications can be found in Domon and Aebersold (2006).
2.2.1.4. Mass spectrometry based informatics
Once mass spectrometry data is collected, the data must be analyzed in some manner to extract information. In shotgun proteomics, tandem mass spectra are searched through sequence databases and matched to amino acid sequences. Several algorithms exist to perform this operation and all use some type of mathematical closeness of fit measure to determine how well the amino acid sequence fits the tandem mass spectrum (Sadygov et al., 2004). The seminal approach to match tandem mass spectra to sequences is the SEQUEST algorithm that uses a two step scoring function with a cross‐correlation analysis providing the final measure of closeness of fit (Eng et al., 1994). Once a database search has been performed, the data needs to be filtered, assembled and statistically analyzed. A rising standard for statistical analysis of data is the use of a “decoy” database, which consists of a reversed, randomized, or shuffled copy of the database used in the search (Peng et al., 2003, 2003). By monitoring the number of tandem mass spectra that match to the decoy sequences the false positive rate can be determined. Scoring threshold values can then be set based on a desired false positive rate which is usually 5% or less. Some care has to be taken to make sure the decoy database does not contain a sequence found in the database and this can often be accomplished by appending the decoy database to the end of the sequence database so the first match observed during the search is from the original database. Computer programs have emerged to automate post search analysis of data including the calculation of statistics for the dataset (Tabb et al., 2002; Keller et al., 2002). For example, the program DTASelect is used to filter and assemble the results from an LC/LC/MS/MS analysis (Tabb et al., 2002). This type of data is more complicated than that of LC/MS/MS data as it includes analyses from multiple fractions and occasionally peptides appear in multiple fractions. These programs often regroup peptides according to the protein of origin, sort by isoforms when possible, and determine the amount of protein sequence coverage obtained by peptides (Tabb et al., 2002; Nesvizhskii et al., 2003). When quantitative information is needed more specific experimental parameters must be followed in addition to the use of specific software to analyze the data. An in‐depth review of different spectra searching algorithms can be found in Nesvizhskii and Aebersold (2004).
2.3. Quantitative shotgun proteomics
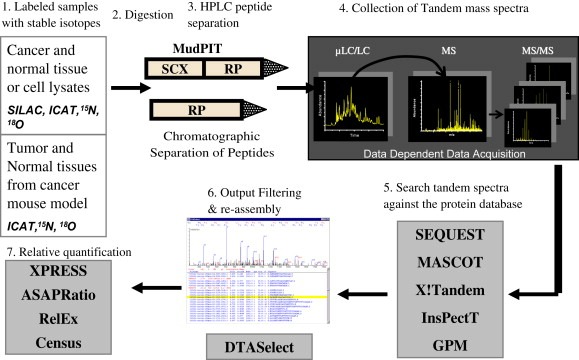
Both qualitative and quantitative measurements of protein content in biological samples are important for comprehensive proteomic analysis. A crucial component of LC(LC)–MS/MS approaches is the assessment of the abundance of detected peptides for complex biological systems in relation to a control state. Mass spectrometry is an excellent quantification device, but the ionization process that creates peptide ions can introduce variability in the number of ions created. Additionally the m/z values of peptides being compared between two states will be the same if they represent the same proteins. To differentiate between peptides from different states and correct for ionization differences and other potential sources of variability, stable isotope labeling of peptides is often used. In one state the naturally occurring isotopomer is used (e.g. 12C, 1H, 16O, 14N) and in the other state a stable and non‐radioactive heavy isotope is used. A variety of methods have been used including tagging proteins and peptides with covalent labels (Gygi et al., 1999; Zhou et al., 2004; Qiu et al., 2002; Smolka et al., 2001; Goshe and Smith, 2003), digesting proteins in the presence of 18O water (Bantscheff et al., 2004), and metabolic labeling of proteins using the translational machinery of the cell to incorporate labels (Ishihama et al., 2005, 2005, 2003, 2002, 2004, 2002). In all cases the peptides of one state have a different molecular weight from peptides of the other state but have nearly identical chemical properties so they behave chromatographically the same and ionize with the same efficiency. During mass analysis the m/z difference between two peptides will be resolved and based on the peak areas of the two different ions, the amount of each peptide can be ascertained. When the experiment is designed to both collect tandem mass spectra and determine the amount of stable isotope labeled peptide present, a high variance can be observed (∼15–25%) (Zybailov et al., 2005; Venable et al., 2004). A comparison of different stable isotope labeling methods of proteomic quantification is summarized in Table 2. A number of computer algorithms have been developed to use the results of database searching algorithms to calculate the peak areas for each peptide. Quantitative measurements of peptides are obtained using quantification software, such as XPRESS (Moulder et al., 2005), ASAPRatio (Li et al., 2003), RelEx (Venable et al., 2004; MacCoss et al., 2003), QUIL (Wang et al., 2006), ProRata (Pan et al., 2006), Multi‐Q (Lin et al., 2006), or more recently CenSus (manuscript submitted), which uses the relative MS signal intensities of the different isotopic forms to calculate the relative abundance of each identified peptide (Figure 2).
Table 2.
A comparison of stable isotope labeling methods for proteomic quantification
| ICAT | SILAC | 15N labeling | iTRAQ | |
|---|---|---|---|---|
| Stable isotope | d8/d0, 12C/13C | 12C/13C | 14N/15N | Four isobaric reagents |
| Target amino acid(s) | Cysteine | Lysine, arginine | All amino acids | N‐terminal primary amine |
| Applicable samples | Non‐living samples | Tissue culture cells | Tissue culture cells and living animals | Non‐living samples |
| Clinical samples | Yes | No | No | Yes |
| Animal models | No | No | Yes | No |
| References | Bottari et al., 2004; Lu et al., 2004; Meehan and Sadar, 2004; Hara et al., 2007; Chen et al., 2006; Pawlik et al., 2006; Stewart et al., 2006 | Ong et al., 2003; Yocum et al., 2006; Gronborg et al., 2006; Everley et al., 2004; Amanchy et al., 2005 | Washburn et al., 2002; Wu et al., 2004; Venable et al., 2004; Conrads et al., 2001 | Aggarwal et al., 2006; Zieske, 2006; Keshamouni et al., 2006; DeSouza et al., 2005; Comuzzi and Sadar, 2006 |
Figure 2.
Protein quantification using the stable isotope labeling strategy.
2.3.1. Differential labeling with stable isotopes
Quantitative proteomic approaches utilizing the differential labeling technique such as isotope‐coded affinity tagging (ICAT) have been developed for rapid and sensitive measurements of protein abundance in biological samples. ICAT reagents can be used to perform quantitative analysis of paired protein samples followed by separation and identification of proteins within these complex mixtures by LC–MS/MS (Bottari et al., 2004; Lu et al., 2004). The ICAT reagents generally consist of three components: a reactive group (i.e. thiol), a linker group (existing in a light or heavy isotopic form), and an affinity handle (i.e. biotin, for purification of tagged peptides). A presumptive advantage of ICAT over other isotope‐labeling systems is that it should also reduce the complexity of peptide mixtures from biological samples. Therefore, it has been utilized to perform comparative and quantitative analysis of differential protein expression in complex biological samples such as cancer cells and tissues of human cancer patients (Meehan and Sadar, 2004; Hara et al., 2007; Chen et al., 2006; Pawlik et al., 2006; Stewart et al., 2006). Besides the ICAT reagents, a new isobaric multiplexing tagging reagent, iTRAQ, has been introduced recently to perform quantitative global protein expression analysis (Aggarwal et al., 2006; Zieske, 2006). Instead of labeling a single amino acid, iTRAQ technology makes use of amine‐specific, stable isotope reagents that can label all peptides with up to four different biological samples simultaneously. Examples of the utility of the iTRAQ technology coupled with LC/LC–MS/MS include studying cancer cell invasion (Keshamouni et al., 2006), differential protein expression in cancer tissues (DeSouza et al., 2005), and novel therapeutic targets for advanced cancer (Comuzzi and Sadar, 2006). A disadvantage to the iTRAQ approach is the labeling process occurs after proteolytic digestion and does not control as well for variance introduced during early stages of the sample preparation process.
Techniques such as ICAT and iTRAQ can be applied only to non‐living samples. Alternatively, a variety of in vivo stable isotope amino acid labeling strategies for LC–MS/MS‐based quantitative proteomics have also been reported. Most of these approaches allow the labeling at the protein level before digestion, and the samples are combined after the isotope‐coding step. For instance, cancer cells in culture can be metabolically labeled by the SILAC (stable isotope labeling by amino acids in cell culture) method to incorporate specific amino acids into proteins (Ong et al., 2003; Yocum et al., 2006; Gronborg et al., 2006; Everley et al., 2004). Cells are grown in the media with normal amino acids (light) or in the media with non‐radioactive, isotopically labeled form of specified amino acids (heavy). Using this metabolic labeling method, proteins from cancer cells at different stages or engineered genetically can be labeled during growth and high enrichment of an isotopic labeled amino acid can usually be achieved in 4–5 doublings of the cell population. The additional constraint of one or two incorporated amino acids can aid in database searching and allow observations of PTMs by comparing the differences between light and heavy versions of the peptide (Amanchy et al., 2005). Relative quantification of changes in protein expression by SILAC is obtained at the peptide level comparing the MS intensities of light (non‐labeled) and heavy peptides (isotope labeled). Since no chemical labeling or affinity enrichment steps are required, the SILAC method can be widely used to study cancer cells in culture.
Proteins can also be metabolically labeled by growing cells in either 14N minimal or 15N‐enriched media and combined with affinity enrichment analogous to the ICAT approach (Oda et al., 1999, 2001). Conrads et al. (2001) carried out quantitative analysis of bacterial and mammalian proteins using 15N‐metabolic labeling in combination with a cysteine‐reactive biotin affinity tag and demonstrated that no significant isotope‐dependent chromatographic shift was observed between 14N and 15N‐labeled peptides allowing more precise quantification of peptide abundances. Therefore, the 15N metabolic labeling strategy presents an alternative to SILAC for global protein labeling and quantitative proteomic studies. The possibility of global protein quantification using the 15N metabolic labeling strategy coupled with MudPIT has been demonstrated in an analysis of the yeast proteome. Large‐scale protein quantification and identification in S. cerevisiae were obtained simultaneously using the combination of 15N metabolic labeling and MudPIT (Washburn et al., 2002). A data‐independent data acquisition strategy further improves protein quantification using 15N metabolic labeling and shotgun proteomics. This 15N based protein quantification method was applied to measure protein expression levels in two developmental stages of Caenorhabditis elegans (Venable et al., 2004) and was shown to improve the accuracy of quantification.
2.3.2. Label‐free protein quantification
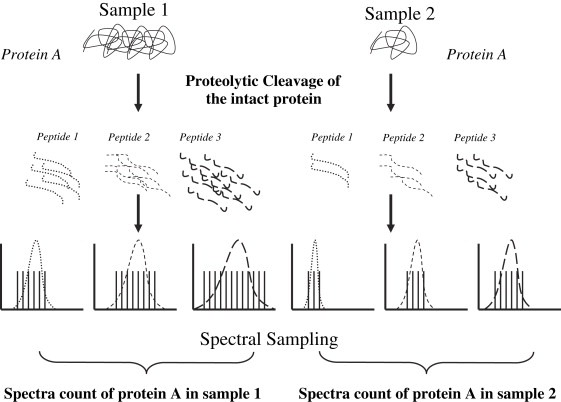
Although differential labeling using stable isotopes allows accurate quantification of protein expression, there are significant drawbacks in using stable isotope labeling methods in general. First, the labeling efficiency of amino acids or proteins varies depending on the rate of protein turnover in cells. Second, MS‐based quantification requires detection of chromatographic peaks for both light and heavy peptides. Substantial changes in protein expression often result in a poor peak correlation between the light and heavy peptides and reduce the number of quantifiable peptide measurements. Third, implementation of the stable isotopic labeling strategy is further hampered by the cost of stable isotope‐labeled amino acids as well as limited availability of isotope/metabolic labeling media. An interest in alternate protein quantification methods has prompted researchers to look for suitable features from tandem mass spectra that would be surrogate measures of protein abundance. In fact, several features of tandem mass spectra collected by shotgun proteomics, including peptide hits, protein sequence coverage, spectral count, and normalized ion intensity have been observed to be indicative of protein abundance in a given sample (Washburn et al., 2001; Florens et al., 2002; Gao et al., 2003; Pang et al., 2002; Wang et al., 2003). Using LC(LC)–MS/MS based approaches such as MudPIT, the number of tandem mass spectra assigned per protein (spectra count) has been used to provide relative protein quantification in biological samples (Figure 3). Linearity and sensitivity of using spectra count measurements were evaluated by studying the correlation between spectral counts and increased protein concentrations (Liu et al., 2004; Resing et al., 2004). Positive correlation between spectra counts and protein concentration was observed in a linear dynamic range over two orders of magnitude using the number of spectra (spectral sampling) acquired for each protein. Also, spectra counts distributed across different steps or runs of MudPIT can be combined (Zybailov et al., 2005). Last, the spectra counting method can be modified to allow normalization by protein length as a normalized spectral abundance factor (NSAF) (Florens et al., 2006). Another comparable label‐free parameter termed the protein abundance index (PAI), which is defined as the number of observed peptides divided by the number of observable peptides per protein, was also reported to show a linear relationship with the logarithm of protein concentration in LC–MS/MS experiments (Ishihama et al., 2005, 2005).
Figure 3.
Spectra count quantification in LC–MS/MS‐based proteomics.
2.3.3. Label‐free analysis
The use of stable isotope labeling in conjunction with tandem mass spectrometry is a precise and accurate method to measure proteins changes (Gygi et al., 1999; Washburn et al., 2002; MacCoss et al., 2003; Lemmel et al., 2004). The method typically relies on the acquisition of tandem mass spectra to identify a peptide prior to measuring the quantities of ions from the two different states and because the proteome coverage is dependent on acquisition speed, it is seldom comprehensive. To circumvent this limitation and improve coverage of a proteome, a differential analysis strategy has evolved. In this strategy the intact proteins are digested and then peptide ion currents measured using LC/MS (Wang et al., 2003; Fang et al., 2006). It is set to provide a broad coverage of peptides and allow relative quantitative comparison across multiple samples. However, many peptides co‐elute when thousands of peptides are measured in one LC/MS analysis. To distinguish experimental variability from real biological differences across various LC–MS analyses, efforts are made to make the LC/MS analysis as a reproducible as possible. Larger diameter (1mm or 2.1mm) commercial columns are sometimes used at higher flow rates to achieve better inter experiment reproducibility. It is easier to insure uniform conditions at higher flows and commercial columns have better quality assurance than home‐made columns. Analyses can be compared by using ion chromatograms and chromatographic alignment is frequently performed before comparing ion signals (MacCoss et al., 2003; Sadygov et al., 2006). Once the chromatograms have been compared and differences identified, the peptides representing these differences are analyzed by tandem mass spectrometry. On some types of instruments, e.g. LTQ‐FTMS, LTQ‐Orbitrap, the recording of the ion chromatogram and acquisition of tandem mass spectra can occur simultaneously. In the event a tandem mass spectrum was not acquired for a peptide representing a difference, this information can be acquired in a subsequent experimental step. This process of using LC/MS increases the acquisition throughput for m/z values and thus potentially produces a higher level of coverage across the proteome. Dynamic range is still an issue, and ultimately the process may need to go to a multi‐dimensional analysis for more complex systems, but there are still technical hurdles to overcome before multi‐dimensional analysis can be used. The complexity of peptide mixtures in biological samples is one of the major limitations for LC/MS differential analysis. Co‐elution of peptides can mask biological differences or decrease the dynamic range of the experiment. Other issues such as experimental noise, and uncorrelated measurements between experimental and biological variations present challenging analytical concerns for large‐scale multidimensional proteomic dataset (Listgarten and Emili, 2005)
2.3.4. Hypothesis driven MS
An emerging form of analysis uses single ion monitoring as way to measure peptides and ultimately proteins. This approach has its roots for peptide analysis in methods developed by Desiderio and Kai (1983) to measure and quantitate neuropeptides. Barr et al. (1996) described it use to quantitate proteins by digesting the protein and measuring the peptide levels. Gerber et al. (2003) brought this method to use for proteomics by creating a strategy to measure the absolute amounts of proteins. This strategy is also called “hypothesis driven mass spectrometry” because you have to know in advance what you want to measure and then preset the mass spectrometer to acquire those ions (Kalkum et al., 2003). Two strategies are emerging in the use of hypothesis driven methods. The first preselects ions and acquires a tandem mass spectrum for each ion. Fragmentation patterns in the spectrum confirm the identify of the peptide. The second strategy uses the exquisite sensitivity and specificity of the triple quadrupole mass spectrometer to perform single reaction ion monitoring (SRM). Ion m/z values are preselected as above but only one or two fragment ions are monitored to record ion current signal. The combination of detecting both parent and fragment ions yields maximum sensitivity for detecting target peptides and has been shown to be useful for targeting low‐abundance proteins (Wienkoop and Weckwerth, 2006). Anderson and Hunter (2006) applied the SRM approach to measure specific peptides in tryptic digests of human plasma. Tryptic peptides representing 53 high and medium abundance proteins in human plasma were quantitatively measured by SRM LC–MS/MS assays. Synthetic stable isotope‐labeled peptides corresponding to the targeted peptides were spiked in the plasma proteolytically cleaved by trypsin. Results from this study exemplify the utility of target specific mass spectrometry‐based assays and possibility of high throughput quantification as well as validation of shotgun proteomic datasets.
3. Exploring mechanisms of malignant transformation by quantitative shotgun proteomics
Unregulated growth is the hallmark of cancer cell development. Deregulation of oncogenic and tumor suppressive genes enables cancer cells to increase rates of cell proliferation and evade programmed cell death (Weinstein and Joe, 2006; Tamura, 2006). Often advanced tumors display mutations in multiple oncogenes and tumor suppressor genes and harbor epigenetic abnormalities resulting in increased expression of hundreds of genes. Despite the fact that differential regulation of oncogenes and tumor suppressor genes is recognized as essential to cancer development and metastasis, mechanisms of their tumor enhancing or suppressing functions are largely unknown. It has been observed that oncogenes and tumor suppressor genes often involve multiple cellular processes that are critical to tumor development (Tamura, 2006; Cantley et al., 1991). Furthermore, structural information often offers limited mechanistic insights into the functions of oncogenes and tumor suppressor genes. For example, a tumor suppressor gene, maspin, is classified as a family member of serine proteinase inhibitors (Serpins) based on its protein structure but does not function as a classical serpin (Pemberton et al., 1995). Although the anti‐tumor mechanism of maspin is uncertain, maspin has been found to interfere with several cancer‐associated processes such as cell invasion, apoptosis, and tumor angiongenesis (Hendrix, 2000; Sheng et al., 1996; Zhang et al., 2000). Using MudPIT and the spectra counting method, a mechanistic investigation of maspin's anti‐metastatic function was performed. Over a thousand proteins were identified and quantified using the spectra count comparison from a large‐scale protein profiling study between cancer cells with or without the ectopic expression of maspin (Chen et al., 2005). Changes in protein levels found by spectra count assessment were verified by Western blot analysis and found to be consistent. A novel connection between maspin and suppression of the proteasome activity in cancer cells was revealed from this study, and our results further support deregulation of the proteasome in cancer metastasis. Using two‐dimensional electrophoresis coupled with mass spectrometry, Hondermarck (2003) performed similar mechanistic investigations by identifying targets of an oncofetal gene, H19. Hondermarck (2003) determined proteomic profiles of breast mammary cells transfected with the H19 gene, which encodes an untranslated mRNA and identified one of the major proteins regulating intracellular redox metabolism, thioredoxin, as a first‐identified target of the H19 gene product. These studies demonstrate the possibility of combining large‐scale protein identification with label‐free protein quantification for rapid and comprehensive molecular analysis of cancer development. Furthermore, results from these studies illustrate the value of proteomic analysis and generate new leads for understanding the mechanisms involved in the development of malignant phenotypes.
4. Dynamics of post‐translational modifications
The diverse realm of posttranslational modification (PTM) of proteins encompasses various signaling events occurring at different stages of tumor development. Post‐translational protein modifications can result in differential transcriptional regulation, induction of protein–protein interactions, and alteration in protein stability (Seo and Lee, 2004; Gill, 2003; Dunne and O'Neill, 2005; Bode and Dong, 2004; Kaiser and Huang, 2005; Vogt et al., 2005). The dynamic composition and complexity generated by post‐translational modification make identification a tremendous challenge in proteomics. Patterns of modified proteins such as differential phosphorylation of a protein can be visualized in 2DE; however, selective and specific probes (i.e. radiolabeling of proteins by 32P incorporation) are necessary to detect intact modified proteins (Bykova et al., 2003). After the detection of specific modified proteins, phosphopeptides and phosphoamino acid assignments are achieved by LC/MS or LC–MS/MS analysis. PTM characterization can also be performed by mass spectrometry‐based approaches. In fact, MS‐based methods have made significant progress in recent years toward qualitative and quantitative measurement of post‐translational modifications. Modified proteins can be characterized by either top down or bottom up (shotgun) techniques (Olsen et al., 2006; Kjeldsen et al., 2003). Both techniques involve the use of liquid chromatography and tandem mass spectrometry. Although different techniques excel in various aspects of PTM mapping, the heterogeneous nature of modifications requires enrichment of modified proteins/peptides for complete characterization of PTM.
4.1. Top down approach
Often the context of modifications within a protein is important to understand regulatory events. This information can be lost in a bottom up approach when multiple modified forms of a protein are analyzed together. To circumvent this problem, top down approaches that measure and fragment intact or large fragments of proteins are being used to retain or discover the context of modifications. Top down proteomics requires the ability to measure intact protein masses and thus much higher resolution mass spectrometers are needed (Sze et al., 2002; Pesavento et al., 2006). Two major advances in techniques have enhanced the capability of the top down approach to detect intact modified proteins. First, Fourier transform ion cyclotron resonance (FT‐ICR) MS provides very high‐resolution measurement of intact ions. Linear ion trap coupled to FT‐ICR improves the ion accumulation efficiency for ion fragmentation with accurate mass and high resolution (Chalmers et al., 2003). Second, the novel technique of electron capture dissociation (ECD) FT‐ICR MS cleaves only the peptide backbone leaving the modified amino acid side‐chains intact and enables sequencing of phosphopeptides, glycopeptides and other types of modified peptides as well as of intact, modified proteins up to 45kDa (Kjeldsen et al., 2003; Sze et al., 2002). Pesavento et al. (2006, 2006, 2006) and Siuti et al. (2006) have pioneered these novel techniques and demonstrated the utility of top down proteomics to characterize post‐translational modifications in human histones.
4.2. Bottom up approach
Bottom up approaches require proteolytic digestion of intact proteins into a collection of peptides that are more readily characterized than the intact protein. Then, the peptide mixtures are separated by single or multidimensional chromatography with offline fraction collection or online electrospray mass spectrometry (LC/MS). High protein sequence coverage using the bottom up approach involves generating peptide length optimal for MS analysis (500–3000Da) and prediction of mass shifts due to known modifications. To increase the sequence coverage of the modified proteins, enzymes with a different proteolytic specificity are used to cleave the protein and generate a ladder of peptides potentially covering the sequence of the entire protein (Yates 3rd, 1993). In theory, the peptide sequence, mass, and localization of modifications can determined by the MS/MS fragmentation pattern of the targeted precursor ion since the modified peptide generates a similar fragmentation pattern to the unmodified peptide with the difference of mass increase resulting from the modified amino acid. However, in practice, if the modification is labile, then it will be lost before the peptide itself fragments. In this case, the peptide can still be sequenced and identified, but only the mass difference not the location of the modification is determined. The recent development of electron transfer dissociation improves the localization of modifications such as phosphorylation as labile modifications are not as prone to elimination (Mikesh et al., 2006).
4.2.1. Phosphorylation
Protein phosphorylation is also one of the most important PTMs found to play a critical role in tumor growth and has been studied intensively. Many growth factors initiate cellular signaling through tyrosine kinase receptors, which in turn induce protein–protein interaction and phosphorylation cascades involving a variety of signaling proteins such as MAP kinases. These cascades of protein phosphorylation ultimately induce changes in gene expression with resulting modifications in protein synthesis and leading to either cell survival, proliferation, differentiation, or migration in normal cells as well as cancer cells. For example, the function of epidermal growth factor receptor (EGFR) is dys‐regulated in the vast majority of human epithelial tumors (Yarden, 2001; Normanno et al., 2006). To understand the signaling events in cancer cell development, techniques allowing sensitive and quantitative detection of phosphopeptides have been developed and applied to cancer studies. Immunoaffinity based strategy targeting tyrosine phosphorylation has been developed to characterize the phosphotyrosine component of the phosphoproteome and identify tyrosine phosphorylation sites (Rush et al., 2005). Peptides containing phosphotyrosine are specifically enriched by the phosphotyrosine‐specific antibody from the protease‐digested cancer cell extracts and analyzed by MS/MS. Another strategy using phosphotyrosine immunoprecipitation in tandem with immobilized metal affinity chromatography (Yoshida et al., 1995) and mass spectrometry has been applied to follow changes in tyrosine phosphorylation occurring over time during the activation of human T cells or the inhibition of cancer cells in response to treatment with ST1571 (Gleevec) (Brill et al., 2004; Salomon et al., 2003). Other large‐scale profiling strategies combining phosphopeptide enrichment, high accuracy identification, and SILAC have also been applied to qualitatively and quantitatively study phosphoproteome in cancer cells. Olsen et al. (2006) utilized the approach of SILAC for phosphopeptide quantification and two chromatographic strategies, strong‐cation exchange (SCX) and titanium dioxide (TiO2), to enrich phosphopeptides for MS/MS analysis. A phospho‐site analysis algorithm to predict the probabilities of phosphosites has also been developed to analyze high throughput phosphoproteome profiling data (Olsen et al., 2006; Beausoleil et al., 2006). To further enhance the capability of phosphopeptide identification, a new fragmentation technique, electron transfer (ETD), has been developed to use in tandem mass spectrometry for preservation of labile PTMs such as phosphorylation in peptides (Mikesh et al., 2006; Chi et al., 2007). With the newly developed techniques and improved algorithms for assigning phosphorylation sites, the field of PTM characterization shows tremendous potential in shedding new light on important signaling events occurring in the pathogenesis of cancer.
4.2.2. Ubquitination and sumoylation
Protein ubiquitination is another important post‐translational modification that plays a critical role in tumor growth. The ubiquitin‐proteasome system is involved in regulation of cell growth and apoptosis. In normal cells, the proteasome controls degradation of intracellular proteins (Mukhopadhyay and Riezman, 2007). Proteins destined for proteolysis are targeted to the proteasome through the attachment of a poly‐ubiquitin chain and degraded to small peptides and the ubiquitin is released and recycled (Goldberg, 1995). By coordinating the protein degradation in the cell, the ubiquitin‐proteasome system regulates many important cellular processes such as the cell cycle, apoptosis, and transcription factors (Hershko, 1997; King et al., 1996; Orlowski, 1999; Karin and Ben‐Neriah, 2000). In preclinical cancer models, proteasome inhibitors induce apopoptosis, have in vivo anti‐tumor efficacy, and sensitize malignant cells to other anti‐tumor therapy (Voorhees et al., 2003). Although the biological significance of protein ubiquitination is well studied, proteins regulated by ubiquination are far less known. Problems of identifying ubiquitin‐modified proteins are the low steady‐state conjugate level due to rapid turnover of ubiquitinated proteins and large poly‐ubiquitin chains (∼8kDa) on modified proteins. To overcome these two problems and identify ubiquitinated proteins at a global level, Peng et al. (2003, 2003) over expressed 6xHis‐tagged ubiquitin in yeast and enriched ubiquitin conjugates for characterization. Then, they cleaved the isolated ubiquitinated proteins with trypsin to generate peptides that contain two glycines derived from the C terminus of ubiquitin and attached covalently to the targeted lysine residue. The trypsin‐digested peptides were fractionated first by strong cation exchange (SCX) chromatography and analyzed by LC–MS/MS. Tandem spectra collected were searched against a yeast protein database and signature mass shift of 114.1Da (two glycines attached) and a missed proteolytic cleavage at the lysine residue because trypsin cannot cleave the modified lysine residues. Another ubiquintin‐related polypeptide modification, sumoylation (SUMO), has also been studied using the global profiling strategy. SUMO conjugation is carried out in a multi‐step enzymatic pathway similar to ubiquitin conjugation resulting in a covalent isopeptide bond linking to the amino group of specific lysines in the target protein (Johnson and Blobel, 1997; Johnson et al., 1997). Some of the known SUMO targets are involved in important biological processes including transcription, cell cycle progression, DNA damage response, and signal transduction. Using the shotgun proteomics approach, Wohlschlegel et al. (2004) carried out large‐scale identification of SUMO targets in S. cerevisiae and revealed novel SUMO substrates involved in chromatin modifications.
5. Challenge of tumor–host interactions and tumor microenvironments
It has become apparent that signaling events occur in cancer cells, among cancer cells, and between the extracellular matrix and cancer cells. Cancer cells become migratory as a result of genetic alterations and in response to the surrounding microenvironment (Boudreau and Bissell, 1998). Dynamic interactions between the cancer cell and its microenvironment can contribute to the metastatic potential of the cancer cell and influence the access of the therapeutic agents to cancer cells (Brown and Giaccia, 1998). Therefore, characterization of dynamic interactions and communication of cancer cells in the tumor microenvironment will provide a more comprehensive view of complex networks within and among cancer cells.
Characterization of normal and tumor tissues by proteomic approaches has been performed but the outcome from these studies has not been fruitful. In vivo human tissue studies are hindered by limitations of the sample size and availability of matched normal and tumor patient samples for proper controls. Therefore, researchers have been developing mouse models to reproduce and monitor human cancer progression. These mouse cancer models can be used to model complex cellular networks of cancer cells and to evaluate targeted therapeutics. To obtain qualitative and quantitative changes of proteins on a global level in vivo, we developed the method to metabolically introduce 15N stable isotopes into proteins of living mammalian organisms (Wu et al., 2004). Ideally, 15N labeled tissues specific mouse proteins can be used as an internal protein standard for quantification. Changes in protein level can be estimated by measuring the ratio of unlabeled and 15N labeled tissues. Any systemic errors between the labeled standard and unlabeled sample can be canceled out by calculating the ratio over the 15N labeled internal protein standard (Figure 4). To explore the concept of monitoring qualitative and quantitative changes in protein abundance induced by cancer‐host interactions in vivo, we carried out in vivo 15N metabolic labeling of human cancer cells in mice. Grafting human cancer cells in mice has been used extensively to study the growth of tumor and pathological processes such as angiogenesis (Kluger et al., 2005; Eibl and Reber, 2005; Khalili et al., 2005; McAlhany et al., 2003; Tuxhorn et al., 2002). Successful application of 15N metabolic labeling in the human xenograft cancer model will enable us to probe the dynamic cellular networks within the cancer cells and interactions of cancer cells with the tumor microenvironment to obtain quantitative protein changes from all stages of tumor development. Based on our preliminary study, we found that the 15N metabolic labeling method can be readily incorporated into the human xenograft cancer model, and proteins in human cancer cells can be rapidly labeled by 15N stable isotope when implanted in 15N metabolically labeled mice (unpublished data). Future applications of the 15N metabolic labeling coupled with quantitative proteomic approaches such as MudPIT will reveal more pathologically relevant molecular patterns from animal cancer models.
Figure 4.
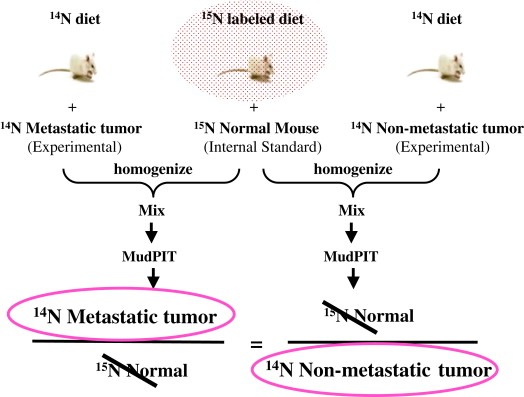
In vivo quantitative proteomic strategy for cancer research.
6. Conclusions
There are two main expectations from proteomic analysis of cancer proteomes. The first is to discover new molecular targets associated with different stages of tumor development. The second is to decipher the molecular mechanisms and signaling events that lead to cancer development. Currently, direct analysis of complex protein mixtures using powerful liquid chromatographic separation methods such as MudPIT, advanced mass spectrometers capable of high mass accuracy, and sophisticated bioinformatics algorithms shows great potential for comprehensive and quantitative cancer proteome analysis and holds great promise for future cancer discovery. However, we are still in a pioneering phase that is exploring the limits of current proteomic technologies to understand the complex deregulation of cellular signaling during cancer progression.
No one proteomic technology can address all questions, but integrating methods should allow progress to be made. For example the large‐scale proteomic methods can identify new biochemical features or perturbations that can be validated, substantiated or extended using more directed mass spectrometry approaches.
Hypothesis driven mass spectrometry, a directed method, may provide a powerful method to decipher initial changes observed in signaling or protein expression events associated with cellular processes. Thus, initial changes can be observed with shotgun or differential methods can then be followed over time using more directed mass spectrometry methods. In summary, future development of cancer proteomics is likely to depend on innovative technologies focused on improving the LC–MS/MS based protein identification and quantification methods for comprehensive molecular profiling.
Acknowledgment
The authors are supported by the following grants: NIAID sub‐contract grant UCSD/MCB0237059, 5R01MH067880‐02, and NIH P41 RR11823‐10.
Chen Emily I., Yates John R. III, (2007), Cancer proteomics by quantitative shotgun proteomics, Molecular Oncology, 1, doi:10.1016/j.molonc.2007.05.001.
References
- Abe, Y. , Chaen, T. , Jin, X.R. , Hamasaki, T. , Hamasaki, N. , 2004. Mass spectrometric analyses of transmembrane proteins in human erythrocyte membrane. J. Biochem. (Tokyo). 136, 97–106. [DOI] [PubMed] [Google Scholar]
- Aggarwal, K. , Choe, L.H. , Lee, K.H. , 2006. Shotgun proteomics using the iTRAQ isobaric tags. Brief Funct. Genomic Proteomic. 5, 112–120. [DOI] [PubMed] [Google Scholar]
- Albertson, D.G. , Collins, C. , McCormick, F. , Gray, J.W. , 2003. Chromosome aberrations in solid tumors. Nat. Genet.. 34, 369–376. [DOI] [PubMed] [Google Scholar]
- Amanchy, R. , Kalume, D.E. , Iwahori, A. , Zhong, J. , Pandey, A. , 2005. Phosphoproteome analysis of HeLa cells using stable isotope labeling with amino acids in cell culture (SILAC). J. Proteome Res.. 4, 1661–1671. [DOI] [PubMed] [Google Scholar]
- Anderson, L. , Hunter, C.L. , 2006. Quantitative mass spectrometric multiple reaction monitoring assays for major plasma proteins. Mol. Cell. Proteomics. 5, 573–588. [DOI] [PubMed] [Google Scholar]
- Anderson, N.L. , Anderson, N.G. , 2002. The human plasma proteome: history, character, and diagnostic prospects. Mol. Cell. Proteomics. 1, 845–867. [DOI] [PubMed] [Google Scholar]
- Anderson, N.L. , 2004. The human plasma proteome: a nonredundant list developed by combination of four separate sources. Mol. Cell. Proteomics. 3, 311–326. [DOI] [PubMed] [Google Scholar]
- Baker, H. , 2005. Proteome-wide analysis of head and neck squamous cell carcinomas using laser-capture microdissection and tandem mass spectrometry. Oral Oncol.. 41, 183–199. [DOI] [PubMed] [Google Scholar]
- Bantscheff, M. , Dumpelfeld, B. , Kuster, B. , 2004. Femtomol sensitivity post-digest (18)O labeling for relative quantification of differential protein complex composition. Rapid Commun. Mass Spectrom.. 18, 869–876. [DOI] [PubMed] [Google Scholar]
- Barr, J.R. , 1996. Isotope dilution–mass spectrometric quantification of specific proteins: model application with apolipoprotein A-I. Clin. Chem.. 42, 1676–1682. [PubMed] [Google Scholar]
- Beausoleil, S.A. , Villen, J. , Gerber, S.A. , Rush, J. , Gygi, S.P. , 2006. A probability-based approach for high-throughput protein phosphorylation analysis and site localization. Nat. Biotechnol.. 24, 1285–1292. [DOI] [PubMed] [Google Scholar]
- Birchmeier, C. , Birchmeier, W. , Gherardi, E. , Vande Woude, G.F. , 2003. Met, metastasis, motility and more. Nat. Rev. Mol. Cell. Biol.. 4, 915–925. [DOI] [PubMed] [Google Scholar]
- Blonder, J. , Goshe, M.B. , Moore, R.J. , Pasa-Tolic, L. , Masselon, C.D. , Lipton, M.S. , Smith, R.D. , 2002. Enrichment of integral membrane proteins for proteomic analysis using liquid chromatography-tandem mass spectrometry. J. Proteome Res.. 1, 351–360. [DOI] [PubMed] [Google Scholar]
- Bode, A.M. , Dong, Z. , 2004. Post-translational modification of p53 in tumorigenesis. Nat. Rev. Cancer. 4, 793–805. [DOI] [PubMed] [Google Scholar]
- Bottari, P. , Aebersold, R. , Turecek, F. , Gelb, M.H. , 2004. Design and synthesis of visible isotope-coded affinity tags for the absolute quantification of specific proteins in complex mixtures. Bioconjug. Chem.. 15, 380–388. [DOI] [PubMed] [Google Scholar]
- Boudreau, N. , Bissell, M.J. , 1998. Extracellular matrix signaling: integration of form and function in normal and malignant cells. Curr. Opin. Cell. Biol.. 10, 640–646. [DOI] [PMC free article] [PubMed] [Google Scholar]
- Brill, L.M. , Salomon, A.R. , Ficarro, S.B. , Mukherji, M. , Stettler-Gill, M. , Peters, E.C. , 2004. Robust phosphoproteomic profiling of tyrosine phosphorylation sites from human T cells using immobilized metal affinity chromatography and tandem mass spectrometry. Anal. Chem.. 76, 2763–2772. [DOI] [PubMed] [Google Scholar]
- Brown, J.M. , Giaccia, A.J. , 1998. The unique physiology of solid tumors: opportunities (and problems) for cancer therapy. Cancer Res.. 58, 1408–1416. [PubMed] [Google Scholar]
- Buchanan, N.S. , Hamler, R.L. , Leopold, P.E. , Miller, F.R. , Lubman, D.M. , 2005. Mass mapping of cancer cell lysates using two-dimensional liquid separations, electrospray-time of flight-mass spectrometry, and automated data processing. Electrophoresis. 26, 248–256. [DOI] [PubMed] [Google Scholar]
- Bykova, N.V. , Stensballe, A. , Egsgaard, H. , Jensen, O.N. , Moller, I.M. , 2003. Phosphorylation of formate dehydrogenase in potato tuber mitochondria. J. Biol. Chem.. 278, 26021–26030. [DOI] [PubMed] [Google Scholar]
- Cantley, L.C. , Auger, K.R. , Carpenter, C. , Duckworth, B. , Graziani, A. , Kapeller, R. , Soltoff, S. , 1991. Oncogenes and signal transduction. Cell. 64, 281–302. (published erratum appears in Cell 1991 May 31;65(5):following 914) [DOI] [PubMed] [Google Scholar]
- Chalmers, M.J. , Quinn, J.P. , Blakney, G.T. , Emmett, M.R. , Mischak, H. , Gaskell, S.J. , Marshall, A.G. , 2003. Liquid chromatography-Fourier transform ion cyclotron resonance mass spectrometric characterization of protein kinase C phosphorylation. J. Proteome Res.. 2, 373–382. [DOI] [PubMed] [Google Scholar]
- Chaurand, P. , Norris, J.L. , Cornett, D.S. , Mobley, J.A. , Caprioli, R.M. , 2006. New developments in profiling and imaging of proteins from tissue sections by MALDI mass spectrometry. J. Proteome Res.. 5, 2889–2900. [DOI] [PubMed] [Google Scholar]
- Chaurand, P. , Stoeckli, M. , Caprioli, R.M. , 1999. Direct profiling of proteins in biological tissue sections by MALDI mass spectrometry. Anal. Chem.. 71, 5263–5270. [DOI] [PubMed] [Google Scholar]
- Chen, E.I. , Florens, L. , Axelrod, F.T. , Monosov, E. , Barbas, C.F. , Yates, J.R. , Felding-Habermann, B. , Smith, J.W. , 2005. Maspin alters the carcinoma proteome. FASEB J. 19, 1123–1124. [DOI] [PubMed] [Google Scholar]
- Chen, R. , 2006. Quantitative proteomic profiling of pancreatic cancer juice. Proteomics. 6, 3871–3879. [DOI] [PubMed] [Google Scholar]
- Chi, A. , 2007. Analysis of phosphorylation sites on proteins from Saccharomyces cerevisiae by electron transfer dissociation (ETD) mass spectrometry. Proc. Natl. Acad. Sci. USA. 104, 2193–2198. [DOI] [PMC free article] [PubMed] [Google Scholar]
- Clarke, W. , Zhang, Z. , Chan, D.W. , 2003. The application of clinical proteomics to cancer and other diseases. Clin. Chem. Lab. Med.. 41, 1562–1570. [DOI] [PubMed] [Google Scholar]
- Comuzzi, B. , Sadar, M.D. , 2006. Proteomic analyses to identify novel therapeutic targets for the treatment of advanced prostate cancer. Cell Sci.. 3, 61–81. [DOI] [PMC free article] [PubMed] [Google Scholar]
- Conrads, T.P. , 2001. Quantitative analysis of bacterial and mammalian proteomes using a combination of cysteine affinity tags and 15N-metabolic labeling. Anal. Chem.. 73, 2132–2139. [DOI] [PubMed] [Google Scholar]
- de Noo, M.E. , Tollenaar, R.A. , Deelder, A.M. , Bouwman, L.H. , 2006. Current status and prospects of clinical proteomics studies on detection of colorectal cancer: hopes and fears. World J. Gastroenterol.. 12, 6594–6601. [DOI] [PMC free article] [PubMed] [Google Scholar]
- Desiderio, D.M. , Kai, M. , 1983. Preparation of stable isotope-incorporated peptide internal standards for field desorption mass spectrometry quantification of peptides in biologic tissue. Biomed. Mass Spectrom.. 10, 471–479. [DOI] [PubMed] [Google Scholar]
- DeSouza, L. , Diehl, G. , Rodrigues, M.J. , Guo, J. , Romaschin, A.D. , Colgan, T.J. , Siu, K.W. , 2005. Search for cancer markers from endometrial tissues using differentially labeled tags iTRAQ and cICAT with multidimensional liquid chromatography and tandem mass spectrometry. J. Proteome Res.. 4, 377–386. [DOI] [PubMed] [Google Scholar]
- Domon, B. , Aebersold, R. , 2006. Mass spectrometry and protein analysis. Science. 312, 212–217. [DOI] [PubMed] [Google Scholar]
- Du, Y. , Parks, B.A. , Sohn, S. , Kwast, K.E. , Kelleher, N.L. , 2006. Top-down approaches for measuring expression ratios of intact yeast proteins using Fourier transform mass spectrometry. Anal. Chem.. 78, 686–694. [DOI] [PubMed] [Google Scholar]
- Dunne, A. , O'Neill, L. , 2005. New insights into the post-translational modification of Toll-like receptor signaling molecules. J. Endotoxin Res.. 11, 325–332. [DOI] [PubMed] [Google Scholar]
- Eibl, G. , Reber, H.A. , 2005. A xenograft nude mouse model for perineural invasion and recurrence in pancreatic cancer. Pancreas. 31, 258–262. [DOI] [PubMed] [Google Scholar]
- Eng, J.K. , McCormack, A.L. , Yates, J.R. , 1994. An approach to correlate tandem mass spectral data of peptides with amino acid sequences in a protein database. J. Am. Soc. Mass Spectrom.. 5, 976–989. [DOI] [PubMed] [Google Scholar]
- Everley, P.A. , Krijgsveld, J. , Zetter, B.R. , Gygi, S.P. , 2004. Quantitative cancer proteomics: stable isotope labeling with amino acids in cell culture (SILAC) as a tool for prostate cancer research. Mol. Cell. Proteomics. 3, 729–735. [DOI] [PubMed] [Google Scholar]
- Fang, R. , 2006. Differential label-free quantitative proteomic analysis of Shewanella oneidensis cultured under aerobic and suboxic conditions by accurate mass and time tag approach. Mol. Cell. Proteomics. 5, 714–725. [DOI] [PubMed] [Google Scholar]
- Florens, L. , 2002. A proteomic view of the Plasmodium falciparum life cycle. Nature. 419, 520–526. [DOI] [PubMed] [Google Scholar]
- Florens, L. , Carozza, M.J. , Swanson, S.K. , Fournier, M. , Coleman, M.K. , Workman, J.L. , Washburn, M.P. , 2006. Analyzing chromatin remodeling complexes using shotgun proteomics and normalized spectral abundance factors. Methods. 40, 303–311. [DOI] [PMC free article] [PubMed] [Google Scholar]
- Gao, J. , Opiteck, G.J. , Friedrichs, M.S. , Dongre, A.R. , Hefta, S.A. , 2003. Changes in the protein expression of yeast as a function of carbon source. J. Proteome Res.. 2, 643–649. [DOI] [PubMed] [Google Scholar]
- Garcia, B.A. , 2006. Comprehensive phosphoprotein analysis of linker histone H1 from Tetrahymena thermophila . Mol. Cell. Proteomics. 5, 1593–1609. [DOI] [PubMed] [Google Scholar]
- Gerber, S.A. , Rush, J. , Stemman, O. , Kirschner, M.W. , Gygi, S.P. , 2003. Absolute quantification of proteins and phosphoproteins from cell lysates by tandem MS. Proc. Natl. Acad. Sci. USA. 100, 6940–6945. [DOI] [PMC free article] [PubMed] [Google Scholar]
- Gill, G. , 2003. Post-translational modification by the small ubiquitin-related modifier SUMO has big effects on transcription factor activity. Curr. Opin. Genet. Dev.. 13, 108–113. [DOI] [PubMed] [Google Scholar]
- Goldberg, A.L. , 1995. Functions of the proteasome: the lysis at the end of the tunnel. Science. 268, 522–523. [DOI] [PubMed] [Google Scholar]
- Gorg, A. , Weiss, W. , Dunn, M.J. , 2004. Current two-dimensional electrophoresis technology for proteomics. Proteomics. 4, 3665–3685. [DOI] [PubMed] [Google Scholar]
- Goshe, M.B. , Smith, R.D. , 2003. Stable isotope-coded proteomic mass spectrometry. Curr. Opin. Biotechnol.. 14, 101–109. [DOI] [PubMed] [Google Scholar]
- Gronborg, M. , 2006. Biomarker discovery from pancreatic cancer secretome using a differential proteomic approach. Mol. Cell. Proteomics. 5, 157–171. [DOI] [PubMed] [Google Scholar]
- Gygi, S.P. , Rist, B. , Gerber, S.A. , Turecek, F. , Gelb, M.H. , Aebersold, R. , 1999. Quantitative analysis of complex protein mixtures using isotope-coded affinity tags. Nat. Biotechnol.. 17, 994–999. [DOI] [PubMed] [Google Scholar]
- Hager, J.W. , Yves Le Blanc, J.C. , 2003. Product ion scanning using a Q-q-Q linear ion trap (Q TRAP) mass spectrometer. Rapid Commun. Mass Spectrom.. 17, 1056–1064. [DOI] [PubMed] [Google Scholar]
- Hamdan, M. , Righetti, P.G. , 2003. Assessment of protein expression by means of 2-D gel electrophoresis with and without mass spectrometry. Mass Spectrom. Rev.. 22, 272–284. [DOI] [PubMed] [Google Scholar]
- Hara, T. , Honda, K. , Shitashige, M. , Ono, M. , Matsuyama, H. , Naito, K. , Hirohashi, S. , Yamada, T. , 2007. Mass spectrometry analysis of the native protein complex containing actinin-4 in prostate cancer cells. Mol. Cell. Proteomics. 6, 479–491. [DOI] [PubMed] [Google Scholar]
- Hendrix, M.J. , 2000. De-mystifying the mechanism(s) of maspin (news). Nat. Med.. 6, 374–376. [DOI] [PubMed] [Google Scholar]
- Hershko, A. , 1997. Roles of ubiquitin-mediated proteolysis in cell cycle control. Curr. Opin. Cell. Biol.. 9, 788–799. [DOI] [PubMed] [Google Scholar]
- Hondermarck, H. , 2003. Breast cancer: when proteomics challenges biological complexity. Mol. Cell. Proteomics. 2, 281–291. [DOI] [PubMed] [Google Scholar]
- Howell, K.E. , Palade, G.E. , 1982. Hepatic Golgi fractions resolved into membrane and content subfractions. J. Cell. Biol.. 92, 822–832. [DOI] [PMC free article] [PubMed] [Google Scholar]
- Hu, S. , Loo, J.A. , Wong, D.T. , 2007. Human saliva proteome analysis. Ann. N.Y. Acad. Sci.. 1098, 323–329. [DOI] [PubMed] [Google Scholar]
- Ishihama, Y. , Oda, Y. , Tabata, T. , Sato, T. , Nagasu, T. , Rappsilber, J. , Mann, M. , 2005. Exponentially modified protein abundance index (emPAI) for estimation of absolute protein amount in proteomics by the number of sequenced peptides per protein. Mol. Cell. Proteomics. 4, 1265–1272. [DOI] [PubMed] [Google Scholar]
- Ishihama, Y. , Sato, T. , Tabata, T. , Miyamoto, N. , Sagane, K. , Nagasu, T. , Oda, Y. , 2005. Quantitative mouse brain proteomics using culture-derived isotope tags as internal standards. Nat. Biotechnol.. 23, 617–621. [DOI] [PubMed] [Google Scholar]
- Johnson, E.S. , Blobel, G. , 1997. Ubc9p is the conjugating enzyme for the ubiquitin-like protein Smt3p. J. Biol. Chem.. 272, 26799–26802. [DOI] [PubMed] [Google Scholar]
- Johnson, E.S. , Schwienhorst, I. , Dohmen, R.J. , Blobel, G. , 1997. The ubiquitin-like protein Smt3p is activated for conjugation to other proteins by an Aos1p/Uba2p heterodimer. EMBO J. 16, 5509–5519. [DOI] [PMC free article] [PubMed] [Google Scholar]
- Kaiser, P. , Huang, L. , 2005. Global approaches to understanding ubiquitination. Genome Biol.. 6, 233 [DOI] [PMC free article] [PubMed] [Google Scholar]
- Kalkum, M. , Lyon, G.J. , Chait, B.T. , 2003. Detection of secreted peptides by using hypothesis-driven multistage mass spectrometry. Proc. Natl. Acad. Sci. USA. 100, 2795–2800. [DOI] [PMC free article] [PubMed] [Google Scholar]
- Karin, M. , Ben-Neriah, Y. , 2000. Phosphorylation meets ubiquitination: the control of NF-[kappa]B activity. Annu. Rev. Immunol.. 18, 621–663. [DOI] [PubMed] [Google Scholar]
- Kelleher, N.L. , Hicks, L.M. , 2005. Contemporary mass spectrometry for the direct detection of enzyme intermediates. Curr. Opin. Chem. Biol.. 9, 424–430. [DOI] [PubMed] [Google Scholar]
- Keller, A. , Nesvizhskii, A.I. , Kolker, E. , Aebersold, R. , 2002. Empirical statistical model to estimate the accuracy of peptide identifications made by MS/MS and database search. Anal. Chem.. 74, 5383–5392. [DOI] [PubMed] [Google Scholar]
- Keshamouni, V.G. , 2006. Differential protein expression profiling by iTRAQ-2DLC–MS/MS of lung cancer cells undergoing epithelial-mesenchymal transition reveals a migratory/invasive phenotype. J. Proteome Res.. 5, 1143–1154. [DOI] [PubMed] [Google Scholar]
- Khalili, P. , Arakelian, A. , Chen, G. , Singh, G. , Rabbani, S.A. , 2005. Effect of Herceptin on the development and progression of skeletal metastases in a xenograft model of human breast cancer. Oncogene. 24, 6657–6666. [DOI] [PubMed] [Google Scholar]
- Khatib-Shahidi, S. , Andersson, M. , Herman, J.L. , Gillespie, T.A. , Caprioli, R.M. , 2006. Direct molecular analysis of whole-body animal tissue sections by imaging MALDI mass spectrometry. Anal. Chem.. 78, 6448–6456. [DOI] [PubMed] [Google Scholar]
- King, R.W. , Deshaies, R.J. , Peters, J.M. , Kirschner, M.W. , 1996. How proteolysis drives the cell cycle. Science. 274, 1652–1659. [DOI] [PubMed] [Google Scholar]
- Kjeldsen, F. , Haselmann, K.F. , Budnik, B.A. , Sorensen, E.S. , Zubarev, R.A. , 2003. Complete characterization of posttranslational modification sites in the bovine milk protein PP3 by tandem mass spectrometry with electron capture dissociation as the last stage. Anal. Chem.. 75, 2355–2361. [DOI] [PubMed] [Google Scholar]
- Klammer, A.A. , MacCoss, M.J. , 2006. Effects of modified digestion schemes on the identification of proteins from complex mixtures. J. Proteome Res.. 5, 695–700. [DOI] [PMC free article] [PubMed] [Google Scholar]
- Kluger, H.M. , Chelouche Lev, D. , Kluger, Y. , McCarthy, M.M. , Kiriakova, G. , Camp, R.L. , Rimm, D.L. , Price, J.E. , 2005. Using a xenograft model of human breast cancer metastasis to find genes associated with clinically aggressive disease. Cancer Res.. 65, 5578–5587. [DOI] [PubMed] [Google Scholar]
- Larmann, J.P. , Lemmo, A.V. , Moore, A.W. , Jorgenson, J.W. , 1993. Two-dimensional separations of peptides and proteins by comprehensive liquid chromatography-capillary electrophoresis. Electrophoresis. 14, 439–447. [DOI] [PubMed] [Google Scholar]
- Lee, H. , Griffin, T.J. , Gygi, S.P. , Rist, B. , Aebersold, R. , 2002. Development of a multiplexed microcapillary liquid chromatography system for high-throughput proteome analysis. Anal. Chem.. 74, 4353–4360. [DOI] [PubMed] [Google Scholar]
- Lee, H.J. , Lee, E.Y. , Kwon, M.S. , Paik, Y.K. , 2006. Biomarker discovery from the plasma proteome using multidimensional fractionation proteomics. Curr. Opin. Chem. Biol.. 10, 42–49. [DOI] [PubMed] [Google Scholar]
- Lemmel, C. , Weik, S. , Eberle, U. , Dengjel, J. , Kratt, T. , Becker, H.D. , Rammensee, H.G. , Stevanovic, S. , 2004. Differential quantitative analysis of MHC ligands by mass spectrometry using stable isotope labeling. Nat. Biotechnol.. 22, 450–454. [DOI] [PubMed] [Google Scholar]
- Levander, F. , Rognvaldsson, T. , Samuelsson, J. , James, P. , 2004. Automated methods for improved protein identification by peptide mass fingerprinting. Proteomics. 4, 2594–2601. [DOI] [PubMed] [Google Scholar]
- Li, X.J. , Zhang, H. , Ranish, J.A. , Aebersold, R. , 2003. Automated statistical analysis of protein abundance ratios from data generated by stable-isotope dilution and tandem mass spectrometry. Anal. Chem.. 75, 6648–6657. [DOI] [PubMed] [Google Scholar]
- Lin, W.T. , 2006. Multi-Q: a fully automated tool for multiplexed protein quantitation. J. Proteome Res.. 5, 2328–2338. [DOI] [PubMed] [Google Scholar]
- Link, A.J. , Eng, J. , Schieltz, D.M. , Carmack, E. , Mize, G.J. , Morris, D.R. , Garvik, B.M. , Yates, J.R. , 1999. Direct analysis of protein complexes using mass spectrometry. Nat. Biotechnol.. 17, 676–682. [DOI] [PubMed] [Google Scholar]
- Listgarten, J. , Emili, A. , 2005. Statistical and computational methods for comparative proteomic profiling using liquid chromatography-tandem mass spectrometry. Mol. Cell. Proteomics. 4, 419–434. [DOI] [PubMed] [Google Scholar]
- Liu, H. , Lin, D. , Yates, J.R. , 2002. Multidimensional separations for protein/peptide analysis in the post-genomic era. Biotechniques. 32, 898, 900, 902 passim [DOI] [PubMed] [Google Scholar]
- Liu, H. , Sadygov, R.G. , Yates, J.R. , 2004. A model for random sampling and estimation of relative protein abundance in shotgun proteomics. Anal. Chem.. 76, 4193–4201. [DOI] [PubMed] [Google Scholar]
- Liu, T. , 2006. Evaluation of multiprotein immunoaffinity subtraction for plasma proteomics and candidate biomarker discovery using mass spectrometry. Mol. Cell. Proteomics. 5, 2167–2174. [DOI] [PMC free article] [PubMed] [Google Scholar]
- Liu, Y. , Patricelli, M.P. , Cravatt, B.F. , 1999. Activity-based protein profiling: the serine hydrolases. Proc. Natl. Acad. Sci. USA. 96, 14694–14699. [DOI] [PMC free article] [PubMed] [Google Scholar]
- Lu, Y. , Bottari, P. , Turecek, F. , Aebersold, R. , Gelb, M.H. , 2004. Absolute quantification of specific proteins in complex mixtures using visible isotope-coded affinity tags. Anal. Chem.. 76, 4104–4111. [DOI] [PubMed] [Google Scholar]
- MacCoss, M.J. , Wu, C.C. , Liu, H. , Sadygov, R. , Yates, J.R. , 2003. A correlation algorithm for the automated quantitative analysis of shotgun proteomics data. Anal. Chem.. 75, 6912–6921. [DOI] [PubMed] [Google Scholar]
- Marouga, R. , David, S. , Hawkins, E. , 2005. The development of the DIGE system: 2D fluorescence difference gel analysis technology. Anal. Bioanal. Chem.. 382, 669–678. [DOI] [PubMed] [Google Scholar]
- McAlhany, S.J. , Ressler, S.J. , Larsen, M. , Tuxhorn, J.A. , Yang, F. , Dang, T.D. , Rowley, D.R. , 2003. Promotion of angiogenesis by ps20 in the differential reactive stroma prostate cancer xenograft model. Cancer Res.. 63, 5859–5865. [PubMed] [Google Scholar]
- McDonald, W.H. , Ohi, R. , Miyamoto, D.T. , Mitchison, T.J. , Yates, J.R. , 2002. Comparison of three directly coupled HPLC MS/MS strategies for identification of proteins from complex mixtures: single-dimension LC–MS/MS, 2-phase MudPIT, and 3-phase MudPIT. Int. J. Mass Spectrom.. 219, 245–251. [Google Scholar]
- Meehan, K.L. , Sadar, M.D. , 2004. Quantitative profiling of LNCaP prostate cancer cells using isotope-coded affinity tags and mass spectrometry. Proteomics. 4, 1116–1134. [DOI] [PubMed] [Google Scholar]
- Mikesh, L.M. , Ueberheide, B. , Chi, A. , Coon, J.J. , Syka, J.E. , Shabanowitz, J. , Hunt, D.F. , 2006. The utility of ETD mass spectrometry in proteomic analysis. Biochim. Biophys. Acta. 1764, 1811–1822. [DOI] [PMC free article] [PubMed] [Google Scholar]
- Motoyama, A. , Venable, J.D. , Ruse, C.I. , Yates, J.R. , 2006. Automated ultra-high-pressure multidimensional protein identification technology (UHP-MudPIT) for improved peptide identification of proteomic samples. Anal. Chem.. 78, 5109–5118. [DOI] [PubMed] [Google Scholar]
- Motoyama, A. , Xu, T. , Ruse, C.I. , Wohlschlegel, J.A. , Yates, J.R. , 2007. Anion and cation mixed-bed ion exchange for enhanced multidimensional separations of peptides and phosphopeptides. Anal. Chem.. 79, (10) 3623–3634. [DOI] [PMC free article] [PubMed] [Google Scholar]
- Moulder, R. , 2005. A comparative evaluation of software for the analysis of liquid chromatography-tandem mass spectrometry data from isotope coded affinity tag experiments. Proteomics. 5, 2748–2760. [DOI] [PubMed] [Google Scholar]
- Mukhopadhyay, D. , Riezman, H. , 2007. Proteasome-independent functions of ubiquitin in endocytosis and signaling. Science. 315, 201–205. [DOI] [PubMed] [Google Scholar]
- Nesvizhskii, A.I. , Aebersold, R. , 2004. Analysis, statistical validation and dissemination of large-scale proteomics datasets generated by tandem MS. Drug Discov. Today. 9, 173–181. [DOI] [PubMed] [Google Scholar]
- Nesvizhskii, A.I. , Keller, A. , Kolker, E. , Aebersold, R. , 2003. A statistical model for identifying proteins by tandem mass spectrometry. Anal. Chem.. 75, 4646–4658. [DOI] [PubMed] [Google Scholar]
- Normanno, N. , 2006. Epidermal growth factor receptor (EGFR) signaling in cancer. Gene. 366, 2–16. [DOI] [PubMed] [Google Scholar]
- Oda, Y. , Huang, K. , Cross, F.R. , Cowburn, D. , Chait, B.T. , 1999. Accurate quantitation of protein expression and site-specific phosphorylation. Proc. Natl. Acad. Sci. USA. 96, 6591–6596. [DOI] [PMC free article] [PubMed] [Google Scholar]
- Oda, Y. , Nagasu, T. , Chait, B.T. , 2001. Enrichment analysis of phosphorylated proteins as a tool for probing the phosphoproteome. Nat. Biotechnol.. 19, 379–382. [DOI] [PubMed] [Google Scholar]
- Olsen, J.V. , Blagoev, B. , Gnad, F. , Macek, B. , Kumar, C. , Mortensen, P. , Mann, M. , 2006. Global, in vivo, and site-specific phosphorylation dynamics in signaling networks. Cell. 127, 635–648. [DOI] [PubMed] [Google Scholar]
- Ong, S.E. , Kratchmarova, I. , Mann, M. , 2003. Properties of 13C-substituted arginine in stable isotope labeling by amino acids in cell culture (SILAC). J. Proteome Res.. 2, 173–181. [DOI] [PubMed] [Google Scholar]
- Opiteck, G.J. , Jorgenson, J.W. , 1997. Two-dimensional SEC/RPLC coupled to mass spectrometry for the analysis of peptides. Anal. Chem.. 69, 2283–2291. [DOI] [PubMed] [Google Scholar]
- Orlowski, R.Z. , 1999. The role of the ubiquitin-proteasome pathway in apoptosis. Cell Death Diff.. 6, 303–313. [DOI] [PubMed] [Google Scholar]
- Osborne, C.K. , Hobbs, K. , Trent, J.M. , 1987. Biological differences among MCF-7 human breast cancer cell lines from different laboratories. Breast Cancer Res. Treat.. 9, 111–121. [DOI] [PubMed] [Google Scholar]
- Pan, C. , 2006. ProRata: a quantitative proteomics program for accurate protein abundance ratio estimation with confidence interval evaluation. Anal. Chem.. 78, 7121–7131. [DOI] [PubMed] [Google Scholar]
- Pang, J.X. , Ginanni, N. , Dongre, A.R. , Hefta, S.A. , Opitek, G.J. , 2002. Biomarker discovery in urine by proteomics. J. Proteome Res.. 1, 161–169. [DOI] [PubMed] [Google Scholar]
- Pawlik, T.M. , Hawke, D.H. , Liu, Y. , Krishnamurthy, S. , Fritsche, H. , Hunt, K.K. , Kuerer, H.M. , 2006. Proteomic analysis of nipple aspirate fluid from women with early-stage breast cancer using isotope-coded affinity tags and tandem mass spectrometry reveals differential expression of vitamin D binding protein. BMC Cancer. 6, 68 [DOI] [PMC free article] [PubMed] [Google Scholar]
- Pemberton, P.A. , Wong, D.T. , Gibson, H.L. , Kiefer, M.C. , Fitzpatrick, P.A. , Sager, R. , Barr, P.J. , 1995. The tumor suppressor maspin does not undergo the stressed to relaxed transition or inhibit trypsin-like serine proteases. Evidence that maspin is not a protease inhibitory serpin. J. Biol. Chem.. 270, 15832–15837. [DOI] [PubMed] [Google Scholar]
- Peng, J. , 2003. A proteomics approach to understanding protein ubiquitination. Nat. Biotechnol.. 21, 921–926. [DOI] [PubMed] [Google Scholar]
- Peng, J. , Elias, J.E. , Thoreen, C.C. , Licklider, L.J. , Gygi, S.P. , 2003. Evaluation of multidimensional chromatography coupled with tandem mass spectrometry (LC/LC–MS/MS) for large-scale protein analysis: the yeast proteome. J. Proteome Res.. 2, 43–50. [DOI] [PubMed] [Google Scholar]
- Pesavento, J.J. , Mizzen, C.A. , Kelleher, N.L. , 2006. Quantitative analysis of modified proteins and their positional isomers by tandem mass spectrometry: human histone H4. Anal. Chem.. 78, 4271–4280. [DOI] [PubMed] [Google Scholar]
- Pieper, R. , Su, Q. , Gatlin, C.L. , Huang, S.T. , Anderson, N.L. , Steiner, S. , 2003. Multi-component immunoaffinity subtraction chromatography: an innovative step towards a comprehensive survey of the human plasma proteome. Proteomics. 3, 422–432. [DOI] [PubMed] [Google Scholar]
- Qian, W.J. , Jacobs, J.M. , Liu, T. , Camp, D.G. , Smith, R.D. , 2006. Advances and challenges in liquid chromatography-mass spectrometry-based proteomics profiling for clinical applications. Mol. Cell. Proteomics. 5, 1727–1744. [DOI] [PMC free article] [PubMed] [Google Scholar]
- Qiu, Y. , Sousa, E.A. , Hewick, R.M. , Wang, J.H. , 2002. Acid-labile isotope-coded extractants: a class of reagents for quantitative mass spectrometric analysis of complex protein mixtures. Anal. Chem.. 74, 4969–4979. [DOI] [PubMed] [Google Scholar]
- Resing, K.A. , 2004. Improving reproducibility and sensitivity in identifying human proteins by shotgun proteomics. Anal. Chem.. 76, 3556–3568. [DOI] [PubMed] [Google Scholar]
- Reyzer, M.L. , Caprioli, R.M. , 2005. MALDI mass spectrometry for direct tissue analysis: a new tool for biomarker discovery. J. Proteome Res.. 4, 1138–1142. [DOI] [PubMed] [Google Scholar]
- Righetti, P.G. , 2004. Critical survey of quantitative proteomics in two-dimensional electrophoretic approaches. J. Chromatogr. A. 1051, 3–17. [DOI] [PubMed] [Google Scholar]
- Roelofsen, H. , Alvarez-Llamas, G. , Schepers, M. , Landman, K. , Vonk, R.J. , 2007. Proteomics profiling of urine with surface enhanced laser desorption/ionization time of flight mass spectrometry. Proteome Sci.. 5, 2 [DOI] [PMC free article] [PubMed] [Google Scholar]
- Rush, J. , 2005. Immunoaffinity profiling of tyrosine phosphorylation in cancer cells. Nat. Biotechnol.. 23, 94–101. [DOI] [PubMed] [Google Scholar]
- Sadygov, R.G. , Cociorva, D. , Yates, J.R. , 2004. Large-scale database searching using tandem mass spectra: looking up the answer in the back of the book. Nat. Methods. 1, 195–202. [DOI] [PubMed] [Google Scholar]
- Sadygov, R.G. , Maroto, F.M. , Huhmer, A.F. , 2006. ChromAlign: a two-step algorithmic procedure for time alignment of three-dimensional LC-MS chromatographic surfaces. Anal. Chem.. 78, 8207–8217. [DOI] [PubMed] [Google Scholar]
- Salomon, A.R. , 2003. Profiling of tyrosine phosphorylation pathways in human cells using mass spectrometry. Proc. Natl. Acad. Sci. USA. 100, 443–448. [DOI] [PMC free article] [PubMed] [Google Scholar]
- Schwartz, J.C. , Senko, M.W. , Syka, J.E. , 2002. A two-dimensional quadrupole ion trap mass spectrometer. J. Am. Soc. Mass Spectrom.. 13, 659–669. [DOI] [PubMed] [Google Scholar]
- Seo, J. , Lee, K.J. , 2004. Post-translational modifications and their biological functions: proteomic analysis and systematic approaches. J. Biochem. Mol. Biol.. 37, 35–44. [DOI] [PubMed] [Google Scholar]
- Sheng, S. , Carey, J. , Seftor, E.A. , Dias, L. , Hendrix, M.J. , Sager, R. , 1996. Maspin acts at the cell membrane to inhibit invasion and motility of mammary and prostatic cancer cells. Proc. Natl. Acad. Sci. USA. 93, 11669–11674. [DOI] [PMC free article] [PubMed] [Google Scholar]
- Siuti, N. , Roth, M.J. , Mizzen, C.A. , Kelleher, N.L. , Pesavento, J.J. , 2006. Gene-specific characterization of human histone H2B by electron capture dissociation. J. Proteome Res.. 5, 233–239. [DOI] [PubMed] [Google Scholar]
- Smolka, M.B. , Zhou, H. , Purkayastha, S. , Aebersold, R. , 2001. Optimization of the isotope-coded affinity tag-labeling procedure for quantitative proteome analysis. Anal. Biochem.. 297, 25–31. [DOI] [PubMed] [Google Scholar]
- Stewart, J.J. , White, J.T. , Yan, X. , Collins, S. , Drescher, C.W. , Urban, N.D. , Hood, L. , Lin, B. , 2006. Proteins associated with Cisplatin resistance in ovarian cancer cells identified by quantitative proteomic technology and integrated with mRNA expression levels. Mol. Cell. Proteomics. 5, 433–443. [DOI] [PubMed] [Google Scholar]
- Syka, J.E. , 2004. Novel linear quadrupole ion trap/FT mass spectrometer: performance characterization and use in the comparative analysis of histone H3 post-translational modifications. J. Proteome Res.. 3, 621–626. [DOI] [PubMed] [Google Scholar]
- Sze, S.K. , Ge, Y. , Oh, H. , McLafferty, F.W. , 2002. Top-down mass spectrometry of a 29-kDa protein for characterization of any posttranslational modification to within one residue. Proc. Natl. Acad. Sci. USA. 99, 1774–1779. [DOI] [PMC free article] [PubMed] [Google Scholar]
- Tabb, D.L. , McDonald, W.H. , Yates, J.R. , 2002. DTASelect and Contrast: tools for assembling and comparing protein identification from shotgun proteomics. J. Proteome Res.. 1, 21–26. [DOI] [PMC free article] [PubMed] [Google Scholar]
- Tamura, G. , 2006. Alterations of tumor suppressor and tumor-related genes in the development and progression of gastric cancer. World J. Gastroenterol.. 12, 192–198. [DOI] [PMC free article] [PubMed] [Google Scholar]
- Thomas, C.E. , Kelleher, N.L. , Mizzen, C.A. , 2006. Mass spectrometric characterization of human histone H3: a bird's eye view. J. Proteome Res.. 5, 240–247. [DOI] [PubMed] [Google Scholar]
- Tuxhorn, J.A. , McAlhany, S.J. , Yang, F. , Dang, T.D. , Rowley, D.R. , 2002. Inhibition of transforming growth factor-beta activity decreases angiogenesis in a human prostate cancer-reactive stroma xenograft model. Cancer Res.. 62, 6021–6025. [PubMed] [Google Scholar]
- Unlu, M. , Morgan, M.E. , Minden, J.S. , 1997. Difference gel electrophoresis: a single gel method for detecting changes in protein extracts. Electrophoresis. 18, 2071–2077. [DOI] [PubMed] [Google Scholar]
- Venable, J.D. , Dong, M.Q. , Wohlschlegel, J. , Dillin, A. , Yates, J.R. , 2004. Automated approach for quantitative analysis of complex peptide mixtures from tandem mass spectra. Nat. Methods. 1, 39–45. [DOI] [PubMed] [Google Scholar]
- Vogt, P.K. , Jiang, H. , Aoki, M. , 2005. Triple layer control: phosphorylation, acetylation and ubiquitination of FOXO proteins. Cell Cycle. 4, 908–913. [DOI] [PubMed] [Google Scholar]
- Voorhees, P.M. , Dees, E.C. , O'Neil, B. , Orlowski, R.Z. , 2003. The proteasome as a target for cancer therapy. Clin. Cancer Res.. 9, 6316–6325. [PubMed] [Google Scholar]
- Wall, D.B. , Kachman, M.T. , Gong, S. , Hinderer, R. , Parus, S. , Misek, D.E. , Hanash, S.M. , Lubman, D.M. , 2000. Isoelectric focusing nonporous RP HPLC: a two-dimensional liquid-phase separation method for mapping of cellular proteins with identification using MALDI-TOF mass spectrometry. Anal. Chem.. 72, 1099–1111. [DOI] [PubMed] [Google Scholar]
- Wang, G. , Wu, W.W. , Pisitkun, T. , Hoffert, J.D. , Knepper, M.A. , Shen, R.F. , 2006. Automated quantification tool for high-throughput proteomics using stable isotope labeling and LC-MSn. Anal. Chem.. 78, 5752–5761. [DOI] [PubMed] [Google Scholar]
- Wang, W. , 2003. Quantification of proteins and metabolites by mass spectrometry without isotopic labeling or spiked standards. Anal. Chem.. 75, 4818–4826. [DOI] [PubMed] [Google Scholar]
- Washburn, M.P. , Ulaszek, R. , Deciu, C. , Schieltz, D.M. , Yates, J.R. , 2002. Analysis of quantitative proteomic data generated via multidimensional protein identification technology. Anal. Chem.. 74, 1650–1657. [DOI] [PubMed] [Google Scholar]
- Washburn, M.P. , Wolters, D. , Yates, J.R. , 2001. Large-scale analysis of the yeast proteome by multidimensional protein identification technology. Nat. Biotechnol.. 19, 242–247. [DOI] [PubMed] [Google Scholar]
- Wei, J. , Sun, J. , Yu, W. , Jones, A. , Oeller, P. , Keller, M. , Woodnutt, G. , Short, J.M. , 2005. Global proteome discovery using an online three-dimensional LC–MS/MS. J. Proteome Res.. 4, 801–808. [DOI] [PubMed] [Google Scholar]
- Weinstein, I.B. , Joe, A.K. , 2006. Mechanisms of disease: oncogene addiction–a rationale for molecular targeting in cancer therapy. Nat. Clin. Pract. Oncol.. 3, 448–457. [DOI] [PubMed] [Google Scholar]
- Wienkoop, S. , Weckwerth, W. , 2006. Relative and absolute quantitative shotgun proteomics: targeting low-abundance proteins in Arabidopsis thaliana. J. Exp. Bot.. 57, 1529–1535. [DOI] [PubMed] [Google Scholar]
- Wohlschlegel, J.A. , Johnson, E.S. , Reed, S.I. , Yates, J.R. , 2004. Global analysis of protein sumoylation in Saccharomyces cerevisiae. J. Biol. Chem.. 279, 45662–45668. [DOI] [PubMed] [Google Scholar]
- Wolters, A.D. , Washburn, M.P. , Yates, J.R. , 2001. An automated multidimensional protein identification technology for shotgun proteomics. Anal. Chem.. 73, 5683–5690. [DOI] [PubMed] [Google Scholar]
- Wu, C.C. , MacCoss, M.J. , Howell, K.E. , Matthews, D.E. , Yates, J.R. , 2004. Metabolic labeling of mammalian organisms with stable isotopes for quantitative proteomic analysis. Anal. Chem.. 76, 4951–4959. [DOI] [PubMed] [Google Scholar]
- Xu, B.J. , Caprioli, R.M. , Sanders, M.E. , Jensen, R.A. , 2002. Direct analysis of laser capture microdissected cells by MALDI mass spectrometry. J. Am. Soc. Mass Spectrom.. 13, 1292–1297. [DOI] [PubMed] [Google Scholar]
- Yarden, Y. , 2001. The EGFR family and its ligands in human cancer. signalling mechanisms and therapeutic opportunities. Eur. J. Cancer. 37, (Suppl. 4) S3–S8. [DOI] [PubMed] [Google Scholar]
- Yates, J.R. , Cociorva, D. , Liao, L. , Zabrouskov, V. , 2006. Performance of a linear ion trap-Orbitrap hybrid for peptide analysis. Anal. Chem.. 78, 493–500. [DOI] [PubMed] [Google Scholar]
- Yates, J.R. , Speicher, S. , Griffin, P.R. , Hunkapiller, T. , 1993. Peptide mass maps: a highly informative approach to protein identification. Anal. Biochem.. 214, 397–408. [DOI] [PubMed] [Google Scholar]
- Yocum, A.K. , Busch, C.M. , Felix, C.A. , Blair, I.A. , 2006. Proteomics-based strategy to identify biomarkers and pharmacological targets in leukemias with t(4;11) translocations. J. Proteome Res.. 5, 2743–2753. [DOI] [PubMed] [Google Scholar]
- Yoo, C. , Patwa, T.H. , Kreunin, P. , Miller, F.R. , Huber, C.G. , Nesvizhskii, A.I. , Lubman, D.M. , 2007. Comprehensive analysis of proteins of pH fractionated samples using monolithic LC/MS/MS, intact MW measurement and MALDI-QIT-TOF MS. J. Mass Spectrom.. 42, 312–314. [DOI] [PMC free article] [PubMed] [Google Scholar]
- Yoshida, K. , Sorimachi, Y. , Fujiwara, M. , Hironaka, K. , 1995. Calpain is implicated in rat myocardial injury after ischemia or reperfusion. Jpn. Circ. J.. 59, 40–48. [DOI] [PubMed] [Google Scholar]
- Zang, L. , Palmer Toy, D. , Hancock, W.S. , Sgroi, D.C. , Karger, B.L. , 2004. Proteomic analysis of ductal carcinoma of the breast using laser capture microdissection, LC-MS, and 16O/18O isotopic labeling. J. Proteome Res.. 3, 604–612. [DOI] [PubMed] [Google Scholar]
- Zhang, M. , Volpert, O. , Shi, Y.H. , Bouck, N. , 2000. Maspin is an angiogenesis inhibitor. Nat. Med.. 6, 196–199. [DOI] [PubMed] [Google Scholar]
- Zhou, H. , Boyle, R. , Aebersold, R. , 2004. Quantitative protein analysis by solid phase isotope tagging and mass spectrometry. Methods Mol. Biol.. 261, 511–518. [DOI] [PubMed] [Google Scholar]
- Zhu, H. , Pan, S. , Gu, S. , Bradbury, E.M. , Chen, X. , 2002. Amino acid residue specific stable isotope labeling for quantitative proteomics. Rapid Commun. Mass. Spectrom.. 16, 2115–2123. [DOI] [PubMed] [Google Scholar]
- Zieske, L.R. , 2006. A perspective on the use of iTRAQ reagent technology for protein complex and profiling studies. J. Exp. Bot.. 57, 1501–1508. [DOI] [PubMed] [Google Scholar]
- Zybailov, B. , Coleman, M.K. , Florens, L. , Washburn, M.P. , 2005. Correlation of relative abundance ratios derived from peptide ion chromatograms and spectrum counting for quantitative proteomic analysis using stable isotope labeling. Anal. Chem.. 77, 6218–6224. [DOI] [PubMed] [Google Scholar]