Abstract
Accumulation of microdamage during fatigue can lead to increased fracture susceptibility in bone. Current techniques for imaging microdamage in bone are inherently destructive and two-dimensional. Therefore, the objective of this study was to image the accumulation of fatigue microdamage in cortical bone using micro-computed tomography (micro-CT) with a barium sulfate (BaSO4) contrast agent. Two symmetric notches were machined on the tensile surface of bovine cortical bone beams in order to generate damage ahead of the stress concentrations during four-point bending fatigue. Specimens were loaded to a specified number of cycles or until one notch fractured, such that the other notch exhibited the accumulation of microdamage prior to fracture. Microdamage ahead of the notch was stained in vitro by precipitation of BaSO4 and imaged using micro-CT. Reconstructed images showed a distinct region of bright voxels around the notch tip or along propagating cracks due to the presence of BaSO4, which was verified by backscattered electron imaging and energy dispersive spectroscopy. The shape of the stained region ahead of the notch tip was consistent with principal strain contours calculated by finite element analysis. The relative volume of the stained region was correlated with the number of loading cycles by non-linear regression using a power-law. This study demonstrates new methods for the non-destructive and three-dimensional detection of fatigue microdamage accumulation in cortical bone in vitro, which may be useful to gain further understanding into the role of microdamage in bone fragility.
Keywords: Fatigue Microdamage, Cortical Bone, Micro-Computed Tomography, Contrast Agents, Barium Sulfate
1. Introduction
Healthy bone is crucial to overall human health. Bone provides structural support for the body, protects soft tissues and organs, produces red blood cells, stores essential minerals and transmits muscular forces during movement (Jee, 2001). Microdamage accumulates in bone tissue in vivo due to repetitive loading and is observed in the form of microcracks or diffuse damage (Burr et al., 1997; Martin, 2003). In vitro studies have shown that microdamage accumulation has a detrimental effect on the mechanical properties of cortical bone (Jepsen and Davy, 1997; Schaffler et al., 1989). However, in vivo, microdamage is repaired by, and may signal, bone remodeling (Burr et al., 1985; Martin, 2003; Martin and Burr, 1982; Mori and Burr, 1993). Thus, excessive accumulation of microdamage prior to remodeling can lead to increased fracture susceptibility. However, the role of microdamage in clinical bone fragility is not yet well understood, in part due to limited capabilities for imaging and measuring microdamage accumulation both in vivo and in vitro.
Current imaging techniques, such as ultraviolet light microscopy using fluorescent stains or chelating agents (Burr and Stafford, 1990; Lee et al., 2000; O’Brien et al., 2002, 2005), backscattered electron imaging (BEI) using a lead-uranyl acetate stain (Schaffler et al., 1994), laser scanning confocal microscopy (LSCM) using fluorescent stains (O’Brien et al., 2000; Zioupos and Currey, 1994) and serial imaging using fluorescent stains (O’Brien et al., 2000), require the preparation of many histologic sections which are inherently destructive and two-dimensional. LCSM provides limited depth of field for three-dimensional (3D) imaging of labeled microdamage, but the sample preparation is destructive and the depth of field is not sufficient to image whole microcracks and tissue architecture.
A non-destructive and 3D imaging technique would enable measurement of the spatial density of microdamage accumulation, which could be correlated to local variations in mechanical loading, bone mineral density (BMD) or microarchitecture. Therefore, recent studies have begun to investigate non-invasive, 3D imaging techniques. Positron emission tomography (PET) was used to image microdamage in vivo with a sodium fluoride (Na18F) contrast agent (Li et al., 2005; Silva et al., 2006). Micro-computed tomography (micro-CT) was used to detect microdamage in vitro with lead sulfide (PbS) (Leng et al., 2005), barium sulfate (BaSO4) (Wang et al., 2007) or iodinated (Parkesh et al., 2006, 2007) contrast agents. In particular, BaSO4 was proposed as a more benign alternative to lead-based stains. BaSO4 was also considered a logical choice for a contrast agent with potential for future use in vivo due to high x-ray attenuation and reasonable biocompatibility. BaSO4 is currently used clinically as a contrast agent for gastrointestinal radiography (Skucas, 1989) and as a radiopacifier in polymethylmethacrylate bone cement (Lewis, 1997).
The objective of this study was to non-destructively and three-dimensionally image microdamage accumulation in cortical bone in vitro using micro-CT with a BaSO4 contrast agent. The BaSO4 stain employed in this study was previously used to label microdamage in vitro in trabecular bone specimens that were damaged by an overload (Wang et al., 2007). In this study, similar methods were used to detect the progressive accumulation of fatigue microdamage ahead of a notch in cortical bone specimens.
2. Materials and Methods
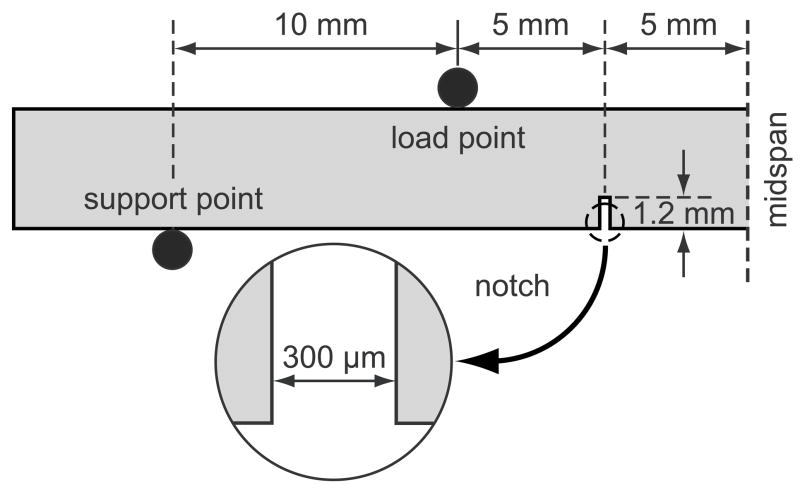
Twenty-four parallelepiped beams, 4 × 4 × 50–60 mm, were sectioned from the cortex at the mid-diaphysis of a single bovine tibia. Two symmetric notches were machined on the periosteal surface of beams, which was loaded in tension under bending, in order to concentrate damage ahead of the notch during loading. The notches were machined 10 mm apart to a depth of 1.2 mm and width of 300 μm using a low speed diamond wafer saw (Fig. 1). As-prepared beams were wrapped in gauze, hydrated with buffered saline solution, and stored at −20°C in airtight containers prior to mechanical testing and staining.
Figure 1.
Schematic diagram of a double-notched beam in four-point bending sectioned at the midspan, showing loading points and dimensions.
Specimens were randomly divided into six groups which were loaded in four-point bending fatigue to 0 (unloaded control), 1·105, 2·105, 3·105, 4·105 and 5·105 cycles. A 5 N compressive preload was initially applied to each beam and the displacement was set to zero. Beams were loaded using an electromagnetic test instrument (ELF 3300, ElectroForce Systems Group of Bose Corp., Eden Prairie, MN) under displacement control (0.1 mm minimum and 0.3 mm maximum deflection) at a frequency of 2 Hz, while soaking in de-ionized water under ambient conditions. Loading was stopped after reaching the designated number of cycles or when fracture occurred at one of the notches, such that the un-fractured notch exhibited the accumulation of microdamage prior to fracture (Nalla et al., 2003, 2005). Specimens that fractured prior to the designated number of cycles were reassigned to the appropriate group based on the number of cycles to failure. Load and displacement data were recorded continuously for 10 s for every 100 s. The beam stiffness (S, N/mm) was calculated as the secant from the maximum and minimum loads and displacements for each loading cycle recorded. The relative stiffness was calculated as the ratio of the stiffness at a given number of loading cycles to the initial stiffness and was correlated to the number of loading cycles using least squares linear regression (JMP 5.1, SAS Institute, Inc., Cary, NC).
After mechanical loading, all beams were sectioned at the midspan (Fig. 1). For each beam, a specimen half with a notch that did not fracture was stained by BaSO4 precipitation, soaking in an equal parts mixture of 1 M barium chloride (certified ACS crystal, Fisher Scientific, Fair Lawn, NJ) in de-ionized water, buffered saline and acetone for 7 days, followed by an equal parts mixture of 1 M sodium sulfate (anhydrous powder, Fisher Scientific, Fair Lawn, NJ) in de-ionized water, buffered saline and acetone for 7 days, both under vacuum (50 mm Hg). Barium chloride and sodium sulfate staining solutions were neutralized by the addition of sodium hydroxide (ACS reagent, Sigma Chemical, St. Louis, MO) and nitric acid (ACS reagent, Aldrich Chemical, Milwaukee, WI), respectively. The staining mechanism was a simple and benign precipitation reaction where BaCl2(aq) + Na2SO4(aq) → BaSO4(s) + 2NaCl(aq) (Leng et al., 2004).
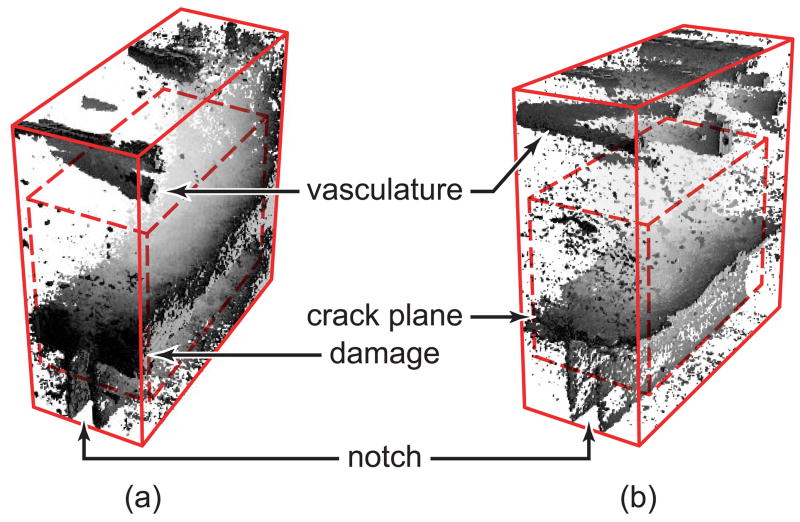
Stained specimens were imaged using micro-CT (μCT-80, Scanco Medical AG, Bassersdorf, Switzerland) at 10 μm resolution, 70 kVp voltage and 113 μA current with slices taken either transversely or longitudinally. For transverse slices, a 1.6 mm long region of the entire specimen cross-section, which fully spanned the notch, was scanned using a 200 ms integration time. Longitudinal slices were imaged to a depth of 0.8 mm in the center of the specimen cross-section using a 300 ms integration time. In order to remove the effect of excess BaSO4 staining on the free surfaces of beams and within vasculature located near the endosteal surface, images reconstructed from transverse slices were also analyzed within a 1.6 × 2.0 × 3.6 mm subregion surrounding the notch tip. This subregion was located 1.4 mm from the endosteal surface, 0.6 mm from the periosteal surface and 0.2 mm from the beam sides (Fig. 2). Gaussian smoothing was applied to suppress noise and 3D images were thresholded in order to show the BaSO4 stain.
Figure 2.
Three-dimensional micro-CT images reconstructed from transverse slices of specimens loaded to 5·105 cycles and stained with BaSO4, showing (a) a typical specimen with a damaged region ahead of the notch and (b) a specimen with a macroscopic crack propagating laterally from the notch tip. The entire region imaged is shown by the solid box (1.6 × 4.0 × 4.0 mm) and the subregion is shown by the dashed box (1.6 × 2.0 × 3.6 mm). Note that BaSO4 also stained the endosteal vasculature shown at the top of each image and free surfaces of the beam, such as around the notch shown at the bottom of each image.
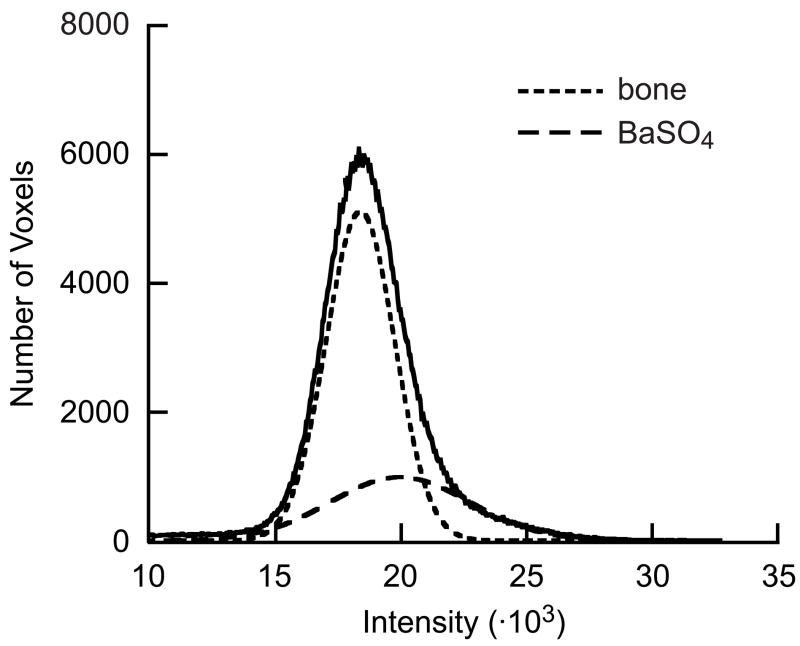
Damage was quantified from the micro-CT image intensity histogram which, after removing background pixels, represents the volume of material at a given image intensity. After staining with BaSO4, the otherwise symmetric Gaussian distribution for bone was skewed to higher intensities due to the presence of BaSO4 (Fig. 3). Therefore, the single, asymmetric Gaussian peak in the image intensity histogram was fit as the sum of two symmetric Gaussian peaks, which represented the two known sources of x-ray attenuation (bone and BaSO4), using a non-linear least-squares algorithm (Fig. 3). The relative volume of stain was measured as the ratio of the BaSO4 integrated peak intensity relative to the total integrated peak intensity. Nonlinear regression was used to correlate the relative peak intensity for BaSO4 to the number of loading cycles using a power-law (JMP 5.1, SAS Institute, Inc., Cary, NC). Regression analysis was conducted with all twenty-four specimens and after the exclusion of outlier specimens, which included two specimens that were over-stained and four specimens with macroscopic cracks present at the notch.
Figure 3.
Representative micro-CT image intensity histogram showing bone and BaSO4 peaks fit using a two-peaked Gaussian function.
Selected specimens were also imaged by scanning electron microscopy (SEM) using backscattered electron imaging (BEI) (Evo 50, LEO Electron Microscopy Ltd., Cambridge, UK) at an accelerating voltage of 20 kV and a working distance of 7 mm. Note that image contrast in BEI is primarily due to compositional differences in atomic number, with increasing atomic number resulting in increased intensity. The elemental composition was also measured by electron probe microanalysis (EPMA) using energy dispersive spectroscopy (EDS) (INCA x-sight model 7636, Oxford Instruments America, Concord, MA). Specimens were embedded in poly(methylmethacrylate), sectioned with a low speed diamond wafer saw, polished with a series of diamond compounds to a 0.25 μm final finish, washed with methanol, dried overnight in an oven at 90°C and coated with Au-Pd by sputter deposition.
Finite element analysis (FEA) was used to qualitatively compare principal strain contours around the notch to micro-CT images of the staining. The finite element model was created with four-node plane strain elements and analyzed with ABAQUS (v.6.3, ABAQUS, Inc., Providence, RI). Isotropic material properties were assigned to the bone tissue, using an elastic modulus of 18 GPa (Reilly and Burstein, 1974) and Poisson’s ratio of 0.3. Displacement bounding conditions were applied to simulate the maximum deflection in four-point bending.
3. Results
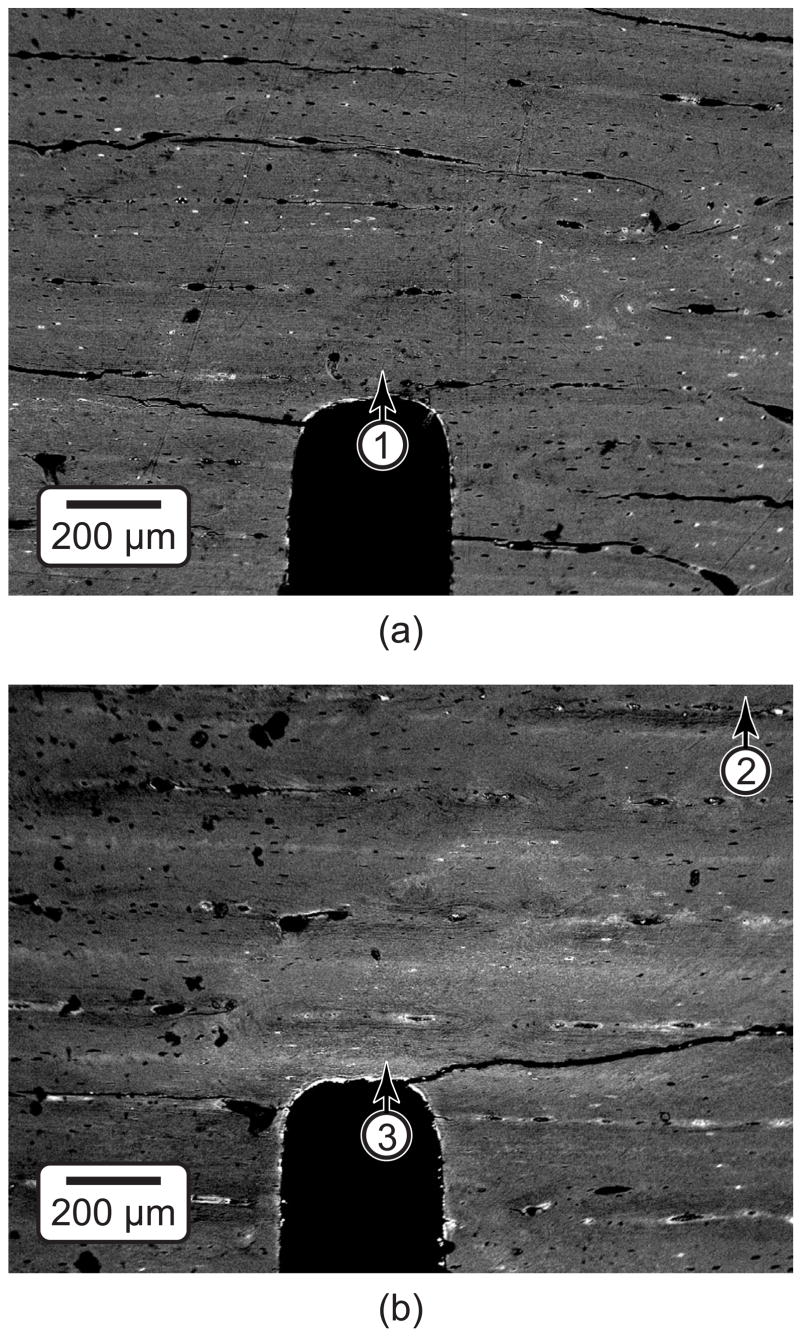
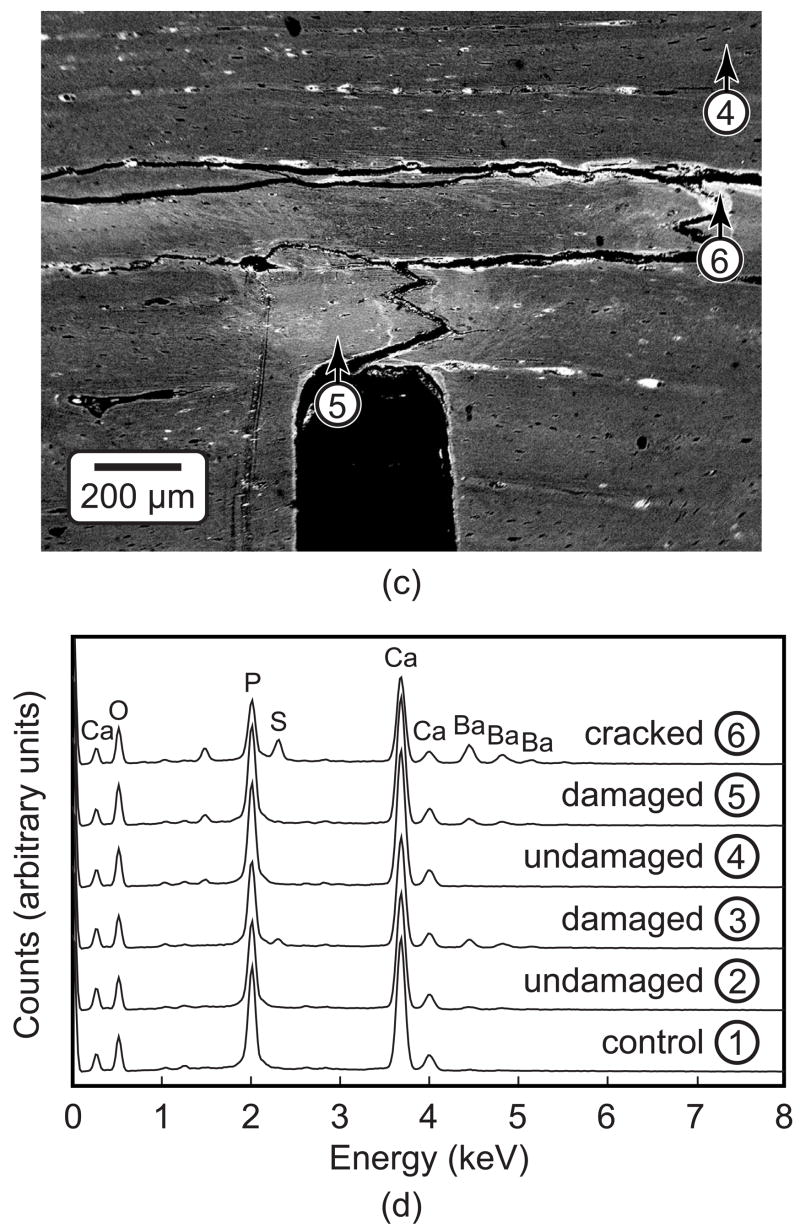
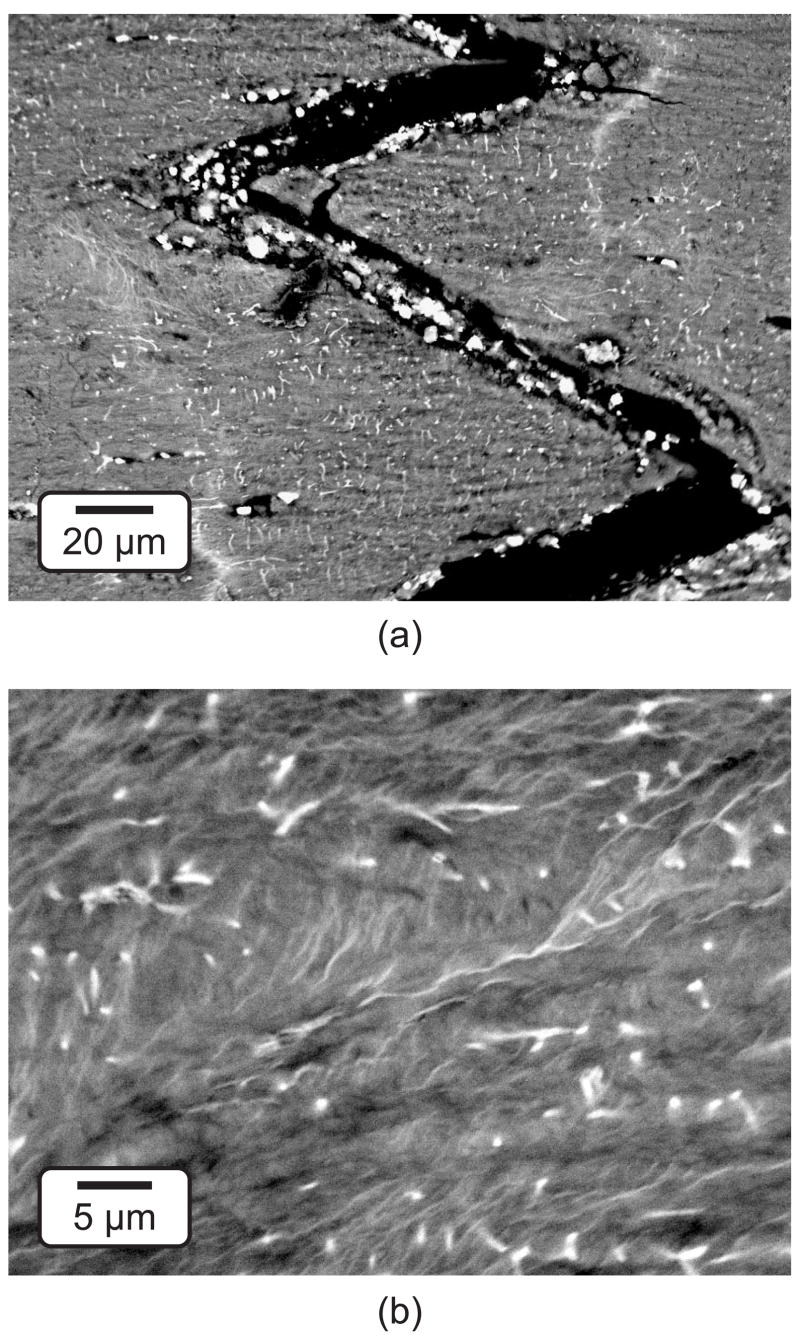
Micro-CT images of damaged specimens showed high intensity voxels within the bone tissue in regions ahead of the notch tip, as well as on surfaces associated with specimen edges, propagating cracks and vasculature (Fig. 2). These high intensity voxels were observed at higher resolution and shown to be due to the presence of precipitated BaSO4 using BEI and EDS, respectively (Fig. 4). The highest image intensity and highest levels of elemental barium (Ba) and sulfur (S) were detected within propagating cracks (Fig. 4, location 6) or vasculature (Fig. 2). Lower levels of Ba and S were detected in damaged tissue ahead of the notch, which appeared at an intermediate image intensity (Fig. 4, locations 3 and 5). The stain was virtually undetectable within the unloaded control specimen or regions of tissue far away from the notch, where the lowest image intensity was observed and no damage was expected (Fig. 4, locations 1, 2 and 4). Note that the absence of BaSO4 within cracks allowed drying cracks (e.g., Figs. 4a and 4b) to be distinguished from cracks that initiated and propagated during loading (e.g., Fig. 4c). Higher magnification SEM micrographs revealed the presence of individual BaSO4 crystals, less than 5 μm in size, on the surfaces of propagating cracks (Fig. 5a) and diffuse staining within damaged tissue (Fig. 5b). Thus, BaSO4 staining enhanced the contrast of tissue that was damaged during loading which enabled imaging by micro-CT using a suitable threshold intensity.
Figure 4.
SEM micrographs using BEI showing (a) an unloaded control specimen and specimens loaded to 5·105 cycles exhibiting (b) microdamage accumulation ahead of the notch and (c) a crack that propagated from the notch. All specimens were stained with BaSO4. (d) The elemental composition was measured using EDS at the locations shown in undamaged tissue, damaged tissue and the within the crack. Note that the specimen shown in Figure 4a is the same as that shown in Figure 6 (unloaded control); the specimen shown in Figure 4b is the same as that shown in Figures 2a and 6 (5·105 cycles); and the specimen shown in Figure 4c is the same as that shown in Figures 2b and 9.
Figure 5.
Higher magnification SEM micrographs using BEI for specimens loaded to 5·105 cycles showing (a) a crack that propagated from the notch (Fig. 4c) and (b) diffuse staining of damage ahead of the notch (Fig. 4b, location 3). Note the presence of BaSO4 crystals within the crack, staining of canuliculi, and characteristic wavy lines for diffuse damage.
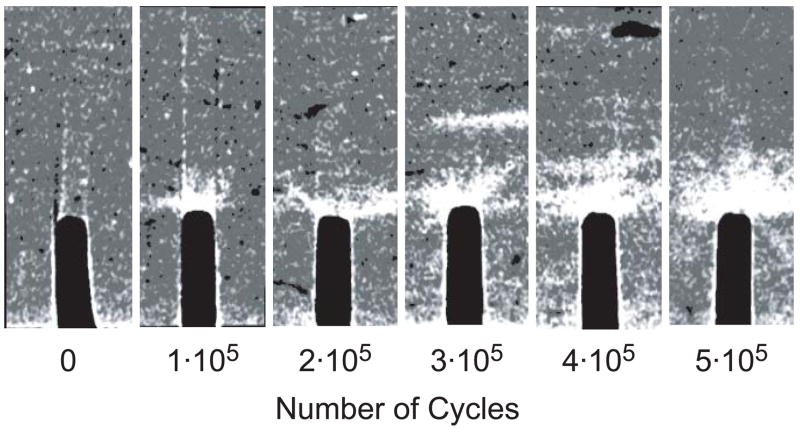
The amount of staining ahead of the notch tip visibly increased with an increased number of loading cycles, as shown by representative two-dimensional micro-CT images from different specimens (Fig. 6). Note that unloaded control specimens exhibited negligible staining ahead of the notch but did exhibit staining of vasculature and the free surfaces of beams (Figs. 4a and 6). Furthermore, the shape of stained regions ahead of the notch tip was qualitatively consistent with principal strain contours calculated by FEA, which exhibited a characteristic kidney shape of high intensity immediately ahead of the notch (Fig. 7).
Figure 6.
Representative two-dimensional micro-CT images from different specimens showing changes in the stained region ahead of the notch with the number of loading cycles. The images were taken from specimens loaded to 0 (control), 1·105, 2·105, 3·105, 4·105 and 5·105 cycles (left to right). The width of each image is 1.2 mm.
Figure 7.
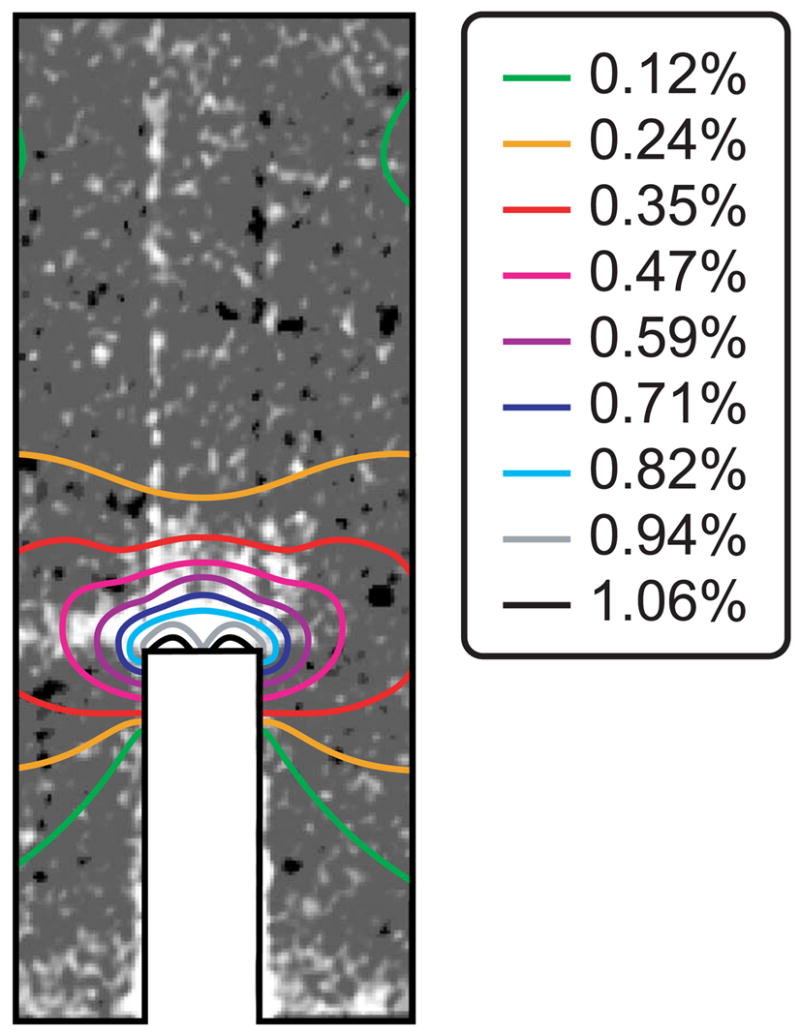
Two-dimensional micro-CT image of a specimen loaded to 1·105 cycles showing the shape of the stained region ahead of the notch in comparison to principal strain contours calculated by FEA.
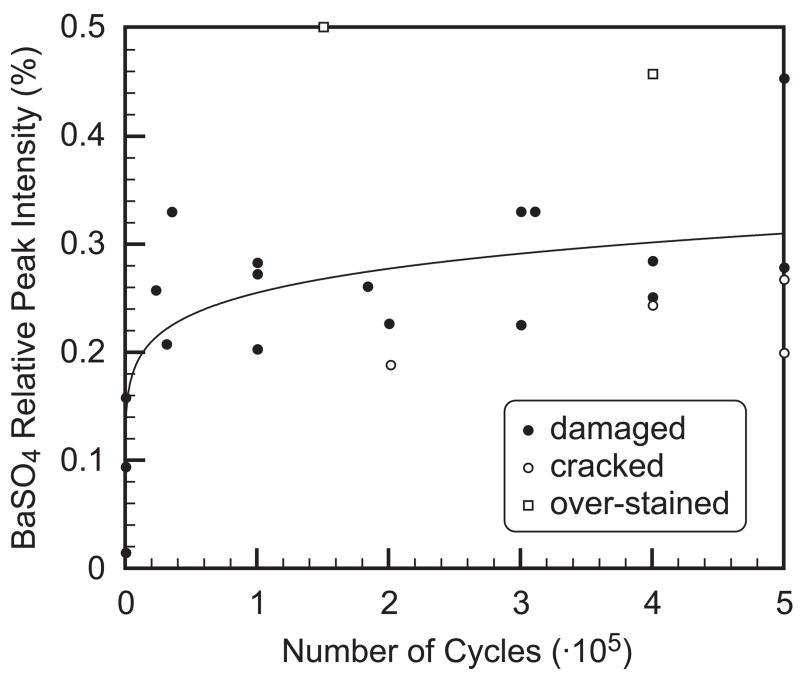
The amount of staining was measured from micro-CT image histograms by the ratio of the BaSO4 integrated peak intensity relative to the overall integrated peak intensity (Fig. 3), and was correlated with the number of loading cycles using a power-law regression (Fig. 8, Table 1). The strength and significance of the correlation was improved using a subregion that excluded the free surfaces of beams and endosteal vasculature (Fig. 2, Table 1). The correlation was also improved by excluding two specimens that were observed to be over-stained and four specimens that exhibited macroscopic cracks propagating from the imaged notch, rather than only microdamage ahead of the notch (Fig. 8, Table 1).
Figure 8.
Power-law regression of the BaSO4 relative peak intensity with the number of loading cycles using the image subregion and including all specimens, y = 0.063x0.121 (p < 0.0001, r2 = 0.56). Data points considered as outliers in subsequent regression analyses, shown in Table 1, included two specimens that were observed to be over-stained and four specimens that exhibited macroscopic cracks propagating from the imaged notch.
Table 1.
Non-linear regression of the BaSO4 relative peak intensity with the number of loading cycles using a power-law, y = A·xb. The region of analysis included either the micro-CT image of the entire specimen cross-section or a subregion that excluded the free surfaces of beams and endosteal vasculature, as shown in Figure 2. Specimens regarded as outliers included two specimens that were observed to be over-stained and four specimens that exhibited macroscopic cracks propagating from the imaged notch (Fig. 8).
| Specimens | Region of Analysis | A | b | p | r2 |
|---|---|---|---|---|---|
| all (n = 24) | entire cross-section | 0.165 | 0.041 | < 0.05 | 0.23 |
| all (n = 24) | subregion | 0.063 | 0.121 | < 0.0001 | 0.56 |
| outliers removed (n =18) | entire cross-section | 0.162 | 0.045 | < 0.005 | 0.41 |
| outliers removed (n =18) | subregion | 0.062 | 0.124 | < 0.0001 | 0.61 |
4. Discussion
The accumulation of microdamage during fatigue was non-destructively and three-dimensionally imaged in notched bovine cortical bone beams in vitro using micro-CT with a new BaSO4 staining technique (Figs. 2 and 6). BaSO4 was precipitated within damaged tissue, cracks and vasculature, and enhanced the intensity of voxels in micro-CT due to the higher x-ray attenuation of BaSO4 relative to bone tissue (Figs. 2 and 4). The amount of staining was measured from the image intensity histogram and correlated with the number of loading cycles using a power-law regression (Fig. 8). Thus, this study demonstrated the feasibility of nondestructive and three-dimensional detection of microdamage in cortical bone in vitro using micro-CT with a suitable contrast agent.
Staining occurred via a simple and benign precipitation reaction (Leng et al., 2004). Specimens were soaked in supersaturated staining solutions such that barium and sulfate ions diffused and concentrated within void space in the tissue – e.g., vasculature and cracks – which acted as a “micro-reactor” and provided an abundance of heterogeneous nucleation sites on surface of the extra-cellular matrix. The presence of BaSO4 was verified by BEI and EDS (Fig. 4). Furthermore, individual crystals less than 5 μm in size were observed on the surfaces of propagating cracks at high magnification (Fig. 5a). These crystals appeared similar to those prepared under more highly controlled conditions (Leng et al., 2004). Staining was not observed in tissue ahead of the notch in unloaded control specimens or far away from the notch in loaded specimens (Fig. 4). Therefore, the observed staining of tissue ahead of the notch tip in loaded specimens suggests that damage resulted in the extra-cellular matrix having an increased permeability to the staining solutions due to ultrastructural (“diffuse”) damage. Higher magnification SEM micrographs revealed “diffuse staining” and “diffuse damage” (Fig. 5b) similar to observations with BEI using a lead-uranyl acetate stain (Schaffler et al., 1994) and ultraviolet light or confocal microscopy using fluorescent stains or chelating agents (Boyce et al., 1998; Martin, 2003; Wang and Niebur, 2006; Zioupos and Currey, 1994).
The region of diffuse staining ahead of the notch tip did not extend as far ahead of the notch in specimens where a macroscopic crack propagated from the notch (Figs. 2b, 4c and 8). In such cases, the crack propagated laterally from the notch, due to the orientation of the notch relative to the plexiform (or fibrolamellar) structure of bovine cortical bone, and the crack plane was able to be imaged using longitudinal slices in micro-CT (Fig. 9). The smaller region of diffuse staining ahead of the notch in cracked specimens suggests that damage accumulation occurred primarily before, rather than during crack propagation. Similarly, studies investigating the toughness of cortical bone during crack propagation (R-curve behavior) have concluded that microcracking contributes relatively little as a toughening mechanism, per se (Ager et al., 2006; Nalla et al., 2004, 2005). Thus, the role of microcracking is more likely as a precursor to crack propagation (Ager, et al., 2006; O’Brien et al., 2005) rather than a toughening mechanism during crack propagation (Vashishth et al., 1997, 2000).
Figure 9.
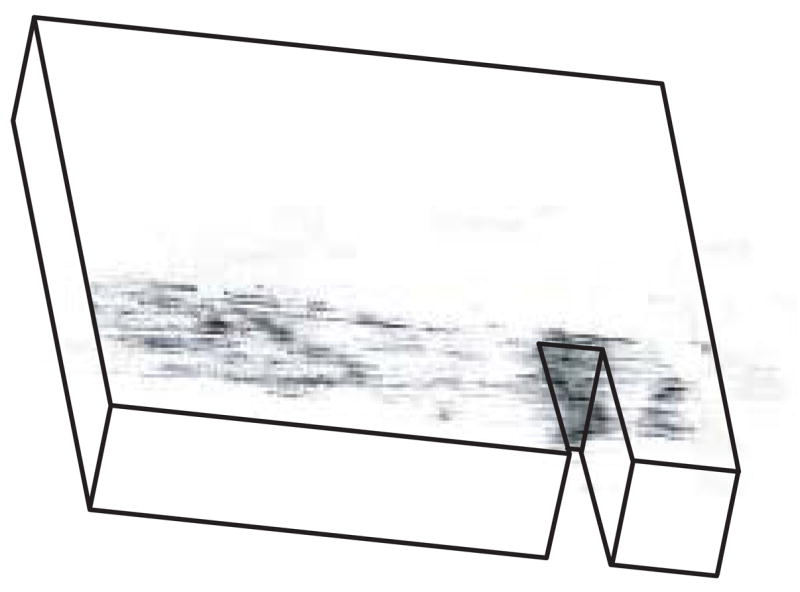
Three-dimensional micro-CT image reconstructed from longitudinal slices of a specimen loaded to 5·105 cycles and stained with BaSO4, showing a crack propagating laterally from the notch. Note that the specimen is the same as that shown in Figures 2b and 4c.
The amount of BaSO4 staining was correlated with the number of loading cycles using a power-law regression (Fig. 8, Table 1). The power-law relationship was not surprising since specimens were loaded under displacement control, where damage accumulation was expected to lower the beam stiffness and thus the applied load with increasing loading cycles. Since BaSO4 staining was shown to be due to microdamage, the amount of BaSO4 staining was considered a relative, but not an absolute, measure of damage. This was a limitation of the study design where only one unbroken notch from each specimen was consistently suitable for imaging microdamage and was stained only with BaSO4. If loaded specimens were sectioned lengthwise prior to staining, matching pairs could be stained and imaged by both micro-CT using BaSO4 and ultraviolet light microscopy using a fluorescent stain or chelating agent. Thus, a direct correlation could be made between each measure of damage and such a study is in progress.
The strength and significance of the correlation for the amount of BaSO4 staining with the number of loading cycles was substantially improved using a subregion that excluded nonspecific staining of the free surfaces of beams and endosteal vasculature (Table 1). In particular, the presence and amount of endosteal vasculature was randomly distributed amongst specimens, but had a profound influence on the staining volume when present (cf. Fig. 2a vs. 2b). The correlation was also improved by excluding six specimens exhibiting atypical behavior that was ascribed to the study methods. On average, the four specimens with macroscopic cracks propagating laterally from the unbroken notch exhibited less diffuse staining ahead of the notch (Figs. 2 and 8), for reasons discussed above. On the other hand, the reason for the apparent over-staining of two specimens was not clear. These specimens exhibited homogeneous staining of up to one-half the specimen cross-section that was clearly unrelated to the notch, loading or tissue microstructure.
Each loaded beam exhibited a continuous decrease in stiffness with the number of loading cycles, as expected. The amount of staining was correlated with the total (%) stiffness loss using a power-law regression (p < 0.05 for all sets of data shown in Table 1). However, the total (%) loss in stiffness was not correlated with the number of loading cycles (p = 0.51 and 0.26 for n = 24 and 18, respectively). There are a couple of plausible explanations for this unexpected behavior. Specimens with macroscopic cracks propagating laterally from the unbroken notch exhibited less diffuse staining ahead of the notch, as described above, but a greater and more rapid stiffness loss. This explanation logically leads to a question of why the unbroken notch in most specimens exhibited damage accumulation ahead of the notch, but several specimens exhibited cracks propagating from the notch. The use of double-notched beams is a clever experimental technique that was previously used to characterize conditions ahead of the unbroken notch after static loading with the assumption that conditions ahead of the unbroken notch are reflective of the broken notch just prior to failure (Nalla et al., 2003, 2005). In this study, double-notched beams were loaded in displacement controlled fatigue and the same assumption was made. Thus, the results of this study may call this assumption into question, perhaps due to the heterogeneity of bone tissue ahead of each notch.
In summary, BaSO4 staining enabled non-destructive and three-dimensional detection of microdamage in cortical bone using micro-CT. The amount of staining was qualitatively and quantitatively correlated with microdamage accumulation. Therefore, the methods in this study may be useful for future in vitro studies into the role of microdamage in bone fragility by enabling correlation of the spatial density of microdamage accumulation to local variations in mechanical loading, bone mineral density (BMD) or microarchitecture. Extension of this technique to in vivo detection of microdamage will require improved specificity, biocompatibility, deliverability and x-ray dosage. Staining by BaSO4 precipitation was nonspecific for damage, including all void spaces such as vasculature and free surfaces, and the staining solutions were not biocompatible. Specificity could be greatly improved by molecular or particulate contrast agents with functional groups that enable preferential binding to calcium exposed on the surfaces of microcracks or diffuse damage (Parkesh et al., 2007). Such a contrast agent could be delivered during the accumulation of damage in bone in situ. Finally, the x-ray dosage of current micro-CT scanners is not yet suitable for imaging in vivo, though it is not known whether a suitable contrast agent could enable the detection of damaged tissue using clinical CT scanners.
Conclusions
Non-destructive and three-dimensional detection of fatigue microdamage accumulation in notched cortical bone specimens was enabled in vitro using micro-CT with a precipitated BaSO4 contrast agent. Reconstructed images showed a distinct region of bright voxels around the notch tip or along propagating cracks due to the presence of BaSO4, which was verified by backscattered electron imaging and energy dispersive spectroscopy. The shape of the stained region ahead of the notch tip was qualitatively consistent with principal strain contours calculated by finite element analysis. The relative volume of the stained region was correlated with the number of loading cycles by non-linear regression using a power-law. The new methods demonstrated in this study may be useful for future in vitro studies into the role of microdamage in bone fragility.
Acknowledgments
This research was supported by the National Institutes of Health (AR049598) and U.S. Army Medical Research and Materiel Command (W81XWH-06-1-0196).
Funding Sources: National Institutes of Health (AR049598) and U.S. Army Medical Research and Materiel Command (W81XWH-06-1-0196).
Footnotes
Publisher's Disclaimer: This is a PDF file of an unedited manuscript that has been accepted for publication. As a service to our customers we are providing this early version of the manuscript. The manuscript will undergo copyediting, typesetting, and review of the resulting proof before it is published in its final citable form. Please note that during the production process errors may be discovered which could affect the content, and all legal disclaimers that apply to the journal pertain.
References
- Ager JW, III, Balooch G, Ritchie RO. Fracture, aging, and disease in bone. J Mater Res. 2006;21 (8):1878–1892. [Google Scholar]
- Boyce TM, Fyhrie DF, Glotkowski MC, Radin EL, Schaffler MB. Damage type and strain mode associations in human compact bone bending fatigue. J Orthop Res. 1998;16 (5):322–329. doi: 10.1002/jor.1100160308. [DOI] [PubMed] [Google Scholar]
- Burr DB, Martin RB, Schaffler MB, Radin EL. Bone remodeling in response to in vivo fatigue microdamage. J Biomechanics. 1985;18:189–200. doi: 10.1016/0021-9290(85)90204-0. [DOI] [PubMed] [Google Scholar]
- Burr DB, Stafford T. Validity of the bulk-staining technique to separate artefactual from in vivo bone microdamage. Clin Orthop Rel Res. 1990;260:305–308. [PubMed] [Google Scholar]
- Burr DB, Forwood MR, Fyhrie DP, Martin RB, Schaffler MB, Turner CH. Bone microdamage and skeletal fragility in osteoporotic and stress fractures. J Bone Miner Res. 1997;12:6–15. doi: 10.1359/jbmr.1997.12.1.6. [DOI] [PubMed] [Google Scholar]
- Jee WSS. Integrated bone tissue physiology: anatomy and physiology. In: Cowin SC, editor. Bone Mechanics Handbook. 2. CRC Press LLC; Boca Raton: 2001. pp. 1.1–1.68. [Google Scholar]
- Jepsen KJ, Davy DT. Comparison of damage accumulation measures in human cortical bone. J Biomechanics. 1997;30(9):891–894. doi: 10.1016/s0021-9290(97)00036-5. [DOI] [PubMed] [Google Scholar]
- Lee TC, Arthur TL, Gibson LJ, Hayes WC. Sequential labelling of microdamage in bone using chelating agents. J Orthop Res. 2000;18:322–325. doi: 10.1002/jor.1100180222. [DOI] [PubMed] [Google Scholar]
- Leng H, Wang X, Niebur GL, Roeder RK. Synthesis of a barium sulfate nanoparticle contrast agent for micro-computed tomography of bone microstructure. Ceram Trans. 2004;159:219–229. [Google Scholar]
- Leng H, VanDersarl JJ, Niebur GL, Roeder RK. Microdamage in bovine cortical bone measured using micro-computed tomography. Trans Orthop Res Soc. 2005;30:665. [Google Scholar]
- Lewis G. Properties of acrylic bone cement: State of the art review. J Biomed Mater Res (Appl Biomater) 1997;38:155–182. doi: 10.1002/(sici)1097-4636(199722)38:2<155::aid-jbm10>3.0.co;2-c. [DOI] [PubMed] [Google Scholar]
- Li J, Miller MA, Hutchins GD, Burr DB. Imaging bone microdamage in vivo with positron emission tomography. Bone. 2005;37 (6):819–824. doi: 10.1016/j.bone.2005.06.022. [DOI] [PubMed] [Google Scholar]
- Martin RB, Burr DB. A hypothetical mechanism for the stimulation of osteonal remodelling by fatigue damage. J Biomechanics. 1982;15 (3):137–139. doi: 10.1016/s0021-9290(82)80001-8. [DOI] [PubMed] [Google Scholar]
- Martin RB. Fatigue microdamage as an essential element of bone mechanics and biology. Calcif Tissue Int. 2003;73 (2):101–107. doi: 10.1007/s00223-002-1059-9. [DOI] [PubMed] [Google Scholar]
- Mori S, Burr DB. Increased intracortical remodeling following fatigue damage. Bone. 1993;14:103–109. doi: 10.1016/8756-3282(93)90235-3. [DOI] [PubMed] [Google Scholar]
- Nalla RK, Kinney JH, Ritchie RO. Mechanistic fracture criteria for the failure of human cortical bone. Nature Mater. 2003;2:164–168. doi: 10.1038/nmat832. [DOI] [PubMed] [Google Scholar]
- Nalla RK, Kruzic JJ, Ritchie RO. On the origin of the toughness of mineralized tissue: microcracking or crack bridging? Bone. 2004;34:790–798. doi: 10.1016/j.bone.2004.02.001. [DOI] [PubMed] [Google Scholar]
- Nalla RK, Stölken JS, Kinney JH, Ritchie RO. Fracture in human cortical bone: local fracture criteria and toughening mechanisms. J Biomechanics. 2005;38:1517–1525. doi: 10.1016/j.jbiomech.2004.07.010. [DOI] [PubMed] [Google Scholar]
- O’Brien FJ, Taylor D, Dickson GR, Lee TC. Visualization of three-dimensional microcracks in compact bone. J Anat. 2000;197:413–420. doi: 10.1046/j.1469-7580.2000.19730413.x. [DOI] [PMC free article] [PubMed] [Google Scholar]
- O’Brien FJ, Taylor D, Lee TC. An improved labelling technique for monitoring microcrack growth in compact bone. J Biomechanics. 2002;35:523–526. doi: 10.1016/s0021-9290(01)00200-7. [DOI] [PubMed] [Google Scholar]
- O’Brien FJ, Taylor D, Lee TC. The effect of bone microstructure on the initiation and growth of microcracks. J Orthop Res. 2005;23 (2):475–480. doi: 10.1016/j.orthres.2004.08.005. [DOI] [PubMed] [Google Scholar]
- Parkesh R, Lee TC, Gunnlaugsson T, Gowin W. Microdamage in bone: Surface analysis and radiological detection. J Biomechanics. 2006;39:1552–1556. doi: 10.1016/j.jbiomech.2005.04.003. [DOI] [PubMed] [Google Scholar]
- Parkesh R, Mohsin S, Lee TC, Gunnlaugsson T. Histological, spectroscopic, and surface analysis of microdamage in bone: Toward real-time analysis using fluorescent sensors. Chem Mater. 2007;19:1656–1663. [Google Scholar]
- Reilly DT, Burstein AH. The mechanical properties of cortical bone. J Bone Joint Surg Am. 1974;56 (5):1001–1022. [PubMed] [Google Scholar]
- Schaffler MB, Radin EL, Burr DB. Mechanical and morphological effects of strain rate on fatigue of compact bone. Bone. 1989;10 (3):207–214. doi: 10.1016/8756-3282(89)90055-0. [DOI] [PubMed] [Google Scholar]
- Schaffler MB, Pitchford W, Choi K, Riddle JM. Examination of compact bone microdamage using back-scattered electron microscopy. Bone. 1994;15:483–488. doi: 10.1016/8756-3282(94)90271-2. [DOI] [PubMed] [Google Scholar]
- Silva MJ, Uthgenannt BA, Rutlin JR, Wohl GR, Lewis JS, Welch MJ. In vivo skeletal imaging of 18F-fluoride with positron emission tomography reveals damage- and time-dependent responses to fatigue loading in the rat ulna. Bone. 2006;39:229–236. doi: 10.1016/j.bone.2006.01.149. [DOI] [PubMed] [Google Scholar]
- Skucas J. Barium sulfate: Clinical Application, Barium sulfate: Toxicity and Complications. In: Skucas J, editor. Radiographic Contrast Agents. 2. Aspen Publishers, Inc; Rockville: 1989. pp. 10–76. [Google Scholar]
- Vashishth D, Behiri JC, Bonfield W. Crack growth resistance in cortical bone: Concept of microcrack toughening. J Biomechanics. 1997;30:763–769. doi: 10.1016/s0021-9290(97)00029-8. [DOI] [PubMed] [Google Scholar]
- Vashishth D, Tanner KE, Bonfield W. Contribution, development and morphology of microcracking in cortical bone during crack propagation. J Biomechanics. 2000;33:1169–1174. doi: 10.1016/s0021-9290(00)00010-5. [DOI] [PubMed] [Google Scholar]
- Wang X, Niebur GL. Microdamage propagation in trabecular bone due to changes in loading mode. J Biomechanics. 2006;39:781–790. doi: 10.1016/j.jbiomech.2005.02.007. [DOI] [PubMed] [Google Scholar]
- Wang X, Masse DB, Leng H, Hess KP, Ross RD, Roeder RK, Niebur GL. Detection of trabecular bone microdamage by micro-computed tomography. J Biomechanics. 2007 doi: 10.1016/j.jbiomech.2007.05.009. in press. [DOI] [PMC free article] [PubMed] [Google Scholar]
- Zioupos P, Currey JD. The extent of microcracking and the morphology of microcracks in damaged bone. J Mater Sci. 1994;29:978–986. [Google Scholar]


