Abstract
The majority of iron for essential mammalian biological activities such as erythropoiesis is thought to be reutilized from cellular hemoproteins. Here, we generated mice lacking functional heme oxygenase 1 (Hmox1; EC 1.14.99.3), which catabolizes heme to biliverdin, carbon monoxide, and free iron, to assess its participation in iron homeostasis. Hmox1-deficient adult mice developed an anemia associated with abnormally low serum iron levels, yet accumulated hepatic and renal iron that contributed to macromolecular oxidative damage, tissue injury, and chronic inflammation. Our results indicate that Hmox1 has an important recycling role by facilitating the release of iron from hepatic and renal cells, and describe a mouse model of human iron metabolic disorders.
Iron is a crucial ligand in virtually all cell types for a vast number of cellular processes, including ATP generation, oxygen transport, and detoxification. It has catalytic function within heme or iron–sulfur clusters, or directly bound to proteins. Iron metabolism disorders are quite common in the human population. For instance, dietary iron deficiency results in millions of cases of anemia yearly, while functional hypoferremia contributes to the anemia that is frequently observed in chronic inflammatory diseases (1). While these conditions result from iron insufficiency, other human disorders are caused by excessive iron storage. Notably, free iron is a potent oxidant that damages cellular macromolecules, presumably through reaction with hydrogen peroxide to form the deleterious hydroxyl radical (2). Frequent blood transfusions often result in iron overloading and related symptoms, requiring iron chelation therapy. In addition, hereditary hemochromatosis, a disorder of increased iron absorption and storage yielding multiorgan pathology, affects approximately 1 in 200 individuals within the Caucasian population (3). Therefore, it is important to understand iron metabolism not only at the molecular and cellular levels but also at the level of the whole organism.
Normally in humans, about 1 mg of iron is absorbed by the intestine daily, and at the same time an approximately equal amount is eliminated from the body. Remarkably, this dietary iron accounts for only 1–3% of the iron that is supplied daily to the blood. Most of the iron requirement is provided through reutilization from existing total body stores of 3–4 g, of which about 70% is maintained within hemoglobin (4). From these facts, it is clear that dissociation of iron from heme moieties and subsequent cellular release constitute a major component of iron homeostasis. Nevertheless, the mechanisms and regulation of heme iron reutilization are poorly understood.
Mammalian heme oxygenase (Hmox, also known as HO; EC 1.14.99.3), which catabolizes cellular heme to biliverdin, carbon monoxide, and free iron, is represented by two isoforms, Hmox1 and Hmox2, encoded by separate genes. Evidence has recently accumulated suggesting that carbon monoxide generated by Hmox2 may be a physiological signaling molecule (5–8). On the other hand, the Hmox1 isoform is thought to provide an antioxidant defense mechanism, on the basis of its marked up-regulation in stressed cells (9–12). Both Hmox isoforms might be largely responsible for the recycling of iron by its liberation from heme and hemoproteins, although their contribution to total iron homeostasis has not been carefully examined.
Here, to study the extent to which Hmox1 participates in iron homeostasis, we generated mice with targeted Hmox1 null mutations and analyzed parameters of iron metabolism. We discovered that adult Hmox1-deficient animals develop both serum iron deficiency and pathological iron-loading, indicating that Hmox1 is crucial for the expulsion of iron from tissue stores.
MATERIALS AND METHODS
Hmox1 Targeting Vector.
The published murine Hmox1 cDNA sequence was utilized for synthesis of primers toward generating a DNA probe by PCR amplification of genomic DNA (13). This probe had sequence contained in exon 5 of the murine Hmox1 gene and was used to screen a λEMBL3 library containing 129/Sv strain genomic fragments, from which the Hmox1 gene was obtained. A 4.4-kb HindIII–XhoI fragment and a 4.0-kb HindIII fragment were used as 5′ and 3′ arms of the contruct, surrounding a 1.8-kb pgk-neo fragment in pBluescript KS (+). The construct was designed to remove a 3.7-kb XhoI–HindIII fragment of murine DNA with intron sequence and coding sequence for the final 226 amino acids.
Targeting Experiments and Generation of Hmox1−/− Mice.
D3 embryonic stem (ES) cells were utilized for transfection as previously described (14). Genomic DNA for KpnI restriction digests was isolated from 240 colonies grown in 24-well plates. Southern blotting and hybridization with the 5′ 160-bp external probe or the 3′ 250-bp internal probe revealed that approximately 25% of the colonies were homologous recombinants. Three of these positive clones were used for injection into C57BL/6 blastocysts. Chimeric mice were generated as described (15). Hmox1+/− mice were obtained by mating male chimeras with C57BL/6 females; these Hmox1+/− animals were intercrossed to produce Hmox1−/− mice. Genotypes of mice were determined by Southern analysis of progeny tail DNA as described above. In vitro fertilization with sperm from Hmox1−/− mice and eggs from Hmox1+/− animals was performed as described (16). Pseudopregnant (C57BL/6 × DBA/2)F1 or Swiss Webster females were used as two-cell embryo recipients.
Serum Iron Parameters.
Mice were bled retroorbitally, and 200 μl of serum from each animal was used for analysis of iron and total iron-binding capacity by using a kit from Sigma, and ferritin was measured by using an immunoassay kit from Microgenics (Concord, CA). All assays were performed by Genox (Baltimore), using a Cobas Fara II chemical analyzer.
Blood Cell Counts and Histology.
Blood was obtained by retroorbital sampling, and blood cell counts were determined by using a Coulter automatic cell counter (performed by Massachusetts Institute of Technology Division of Comparative Medicine Laboratories). For histology, tissues were dissected and fixed in 4% paraformaldehyde or 10% formalin for 24 hr, and embedded in paraffin. Microtome sections 4 μm thick were mounted onto slides and stained with hematoxylin and eosin, Prussian blue to detect ferric iron, or Masson’s trichrome method, all by using standard procedures.
Analysis of Oxidative Damage.
Protein carbonyl content was measured using a protocol slightly modified from previous reports (17, 18). Tissue was dissected, washed in PBS, and disrupted with a Tissumizer from Tekmar (Cincinnati). From the soluble protein fraction, 300-μl aliquots containing 1.4–2.5 mg of protein were treated with either 300 μl of 2 M HCl (control) or 300 μl of 10 mM 2,4-dinitrophenylhydrazine dissolved in 2 M HCl. Samples were incubated at room temperature for 1 hr with occasional mixing, precipitated with an equal volume of 20% trichloroacetic acid, and pelleted. The pellet was washed three times with 1 ml of a 1:1 mixture of ethanol/ethyl acetate and was dissolved in 1 ml of 6 M guanidine⋅hydrochloride at 42°C. The difference in absorbance between the control and treated samples was determined at 364 nm, and an extinction coefficient of 22 mM−1⋅cm−1 for aliphatic hydrazones was used. Results were expressed as nmol of carbonyl groups per mg of protein. Lipid peroxidation was measured with a kit from Oxis (Portland, OR).
Immunological Analyses.
Thymus, spleen, and lymph node single-cell suspensions were prepared by disrupting the organs between glass slides. Approximately 1 × 10⁶ cells were incubated with labeled antibodies at 4°C for 30 min. Cells were washed and analyzed with a FACScan (Becton Dickinson) for fluorescein isothiocyanate (FITC) and phycoerythrin (PE) stainings. Cells were initially gated by size and scatter to restrict consideration to live lymphoid cells. Data from 10,000 cells were collected.
RESULTS
Generation of Mice Containing Targeted Hmox1 Mutations.
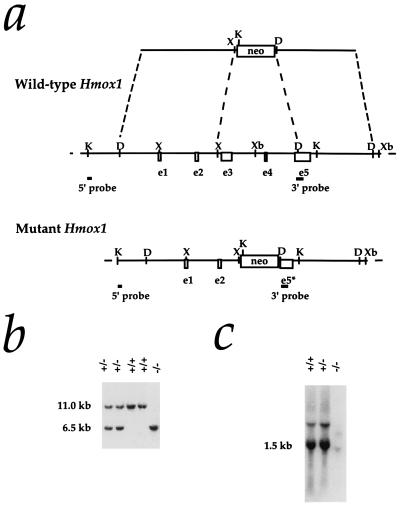
A construct was designed to replace 3.7 kb within the murine Hmox1 locus, including approximately 85% of the coding sequence, with a neomycin resistance cassette containing a pgk promoter (Fig. 1a). Following standard procedures for the production of recombinant ES cells and chimeras, we generated heterozygous mice in the (129/Sv × C57BL/6) hybrid strain background.
Figure 1.
Targeted disruption of the Hmox1 gene. (a) Hmox1 genomic locus and targeting vector. A 3.7-kb region including exons 3, 4, and a portion of 5 (e3–e5) was replaced with a pgk-neo cassette. The 5′ and 3′ probes used for screening ES cell clones and genotyping mice are shown. The 5′ probe hybridizes to an 11-kb KpnI fragment of the native Hmox1 gene and a 6.5-kb fragment from the disrupted gene. D, HindIII site; K, KpnI; X, XhoI; Xb, XbaI. (b) Southern blot analysis of KpnI-digested tail DNA from ES cell-derived mice. The blot was hybridized with the 5′ Hmox1 probe. Genotypes of one Hmox1 homozygous mutant mouse (−/−), two wild-type mice (+/+), and two heterozygous mice (+/−) are indicated. (c) Northern blot analysis of total splenic RNA from a wild-type mouse (+/+), a heterozygous mouse (+/−), and a homozygous mutant mouse (−/−). The blot was hybridized with a rat Hmox1 cDNA probe (13), which recognizes a major mRNA band of approximately 1.5 kb. The Hmox1 probe recognized an aberrantly sized mRNA from Hmox1−/− mice that was barely detectable even in an overloaded lane.
Partial Prenatal Lethality Among Hmox1-Deficient Mice.
Matings between heterozygous mice did not yield the expected Mendelian ratio. As genotyped at weaning age, the first several litters included 69 wild-type, 143 heterozygous, and 11 homozygous Hmox1 mutant animals (hereafter referred to as Hmox1+/+, Hmox1+/−, and Hmox1−/− mice, respectively; Fig. 1b). Fig. 1c indicates the extreme effects of the targeted mutation on Hmox1 mRNA expression in Hmox1−/− animals. The low Hmox1−/− survival percentage (20% of expected Hmox1−/− mice) was maintained in matings between Hmox1−/− and Hmox1+/− mice, which yielded 216 Hmox1+/− and 26 Hmox1−/− animals; Hmox1−/− mating pairs did not yield viable litters. We were able to increase the percentage of surviving Hmox1−/− embryos to 48% of those expected, by using in vitro fertilization techniques with gametes from Hmox1−/− and Hmox1+/− animals, which produced 369 Hmox1+/− and 118 Hmox1−/− mice. This report focuses on analysis of adult Hmox1−/− mice generated from these in vitro fertilizations, while the basis of the prenatal lethality will be described in detail elsewhere (K.D.P., unpublished work).
Hypoferremia and Anemia in Hmox1-Deficient Mice.
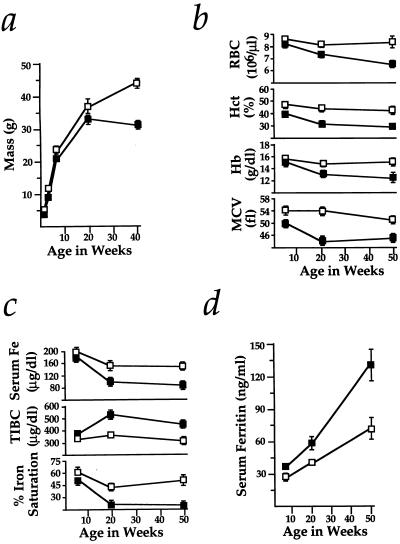
Mice lacking Hmox1 were slightly smaller than Hmox1+/+ or Hmox1+/− littermates from birth to early adulthood, but were otherwise indistinguishable. However, we noticed that, as early as 25 weeks of age, most Hmox1−/− animals became thin and poorly groomed, bred poorly, and appeared less active than Hmox1+/+ or Hmox1+/− mice. Although one Hmox1−/− mouse has lived up to 22 months, premature mortalities in Hmox1−/− mice after 25 weeks of age were not uncommon. Fig. 2a indicates the extent to which the disease reduced average weights of Hmox1−/− mice compared with healthy Hmox1+/− littermates.
Figure 2.
Wasting, anemia, and serum iron deficiency in Hmox1−/− mice. (a) Hmox1−/− mice were consistently slightly smaller than Hmox1+/− littermates, but weight loss between 20 and 40 weeks of age was clearly indicative of wasting. Data are shown mean ± SEM. One and 3 weeks, 9 Hmox1−/− and 19 Hmox1+/− males and females were analyzed; 6 weeks, 12 Hmox1−/− and 24 Hmox1+/− males only; 20 weeks, 9 Hmox1−/− and 11 Hmox1−/− males; and 40 weeks, 13 Hmox1−/− and 15 Hmox1+/− males. Significant differences (P < 0.05) were observed between Hmox1−/− and Hmox1+/− masses at all ages. In a–d, □, Hmox1+/− mean values; ▪, Hmox1−/− mean values. (b) Red blood cell counts (RBC), packed cell volume (hematocrit, Hct), blood hemoglobin concentration (Hb), and mean cell volume (MCV) analyzed in 7–11 male and female Hmox1−/− and Hmox1+/− littermates at 6, approximately 20, and approximately 50 weeks of age. Significant differences (P < 0.05) were observed for each parameter at all ages except for 6-week RBC and Hb values. (c) Serum iron (Fe), total iron-binding capacity (TIBC), and iron saturation analyzed in 5 Hmox1+/− and 5 Hmox1−/− male mice of each age group. Significant differences (P < 0.05) were observed in each parameter except for 6-week serum iron values. Iron saturation percentage is equal to 100(serum iron/TIBC). (d) Serum ferritin values analyzed in mice from c. Significant differences (P < 0.05) were observed at each age examined.
Associated with the disease was an anemia, involving reductions in both erythrocyte number and size, that was present by 20 weeks of age in Hmox1−/− animals (Fig. 2b). Analyses of blood smears (data not shown) and erythrocyte volume (Fig. 2b) indicated that this anemia was normochromic and microcytic, with anisocytosis. Since this description is characteristic of iron deficiency anemia in humans, we analyzed serum iron levels in Hmox1−/− mice. As predicted, Hmox1−/− serum iron values were severely reduced by 20 weeks of age (Fig. 2c). Similarly to hypoferremia caused by iron deficiency, the total iron-binding capacity (largely represented by serum levels of transferrin, the major extracellular iron-carrying protein) was high in Hmox1−/− mice, resulting in a reduced iron saturation percentage (Fig. 2c). These results indicate that heme catabolism by Hmox1 contributes to maintaining the blood iron levels that are necessary for optimal erythropoiesis.
Mice Lacking Functional Hmox1 Accumulate Tissue Iron.
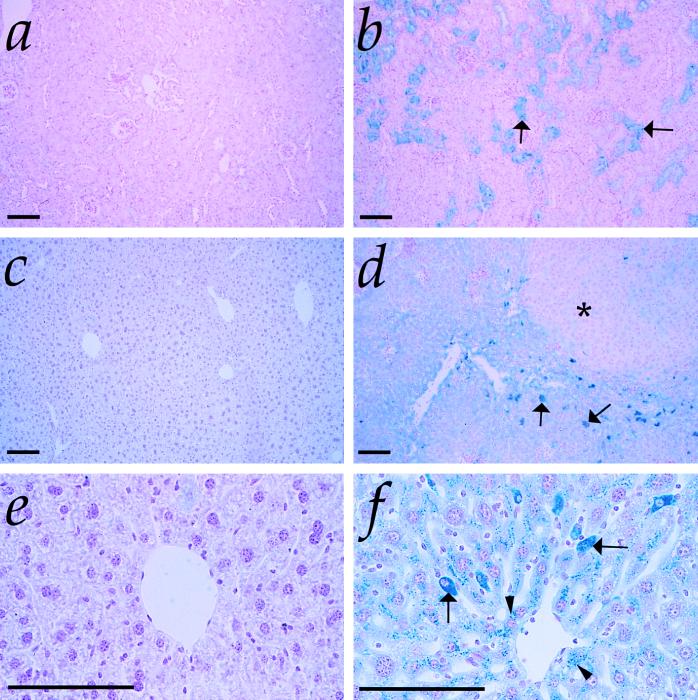
Serum levels of ferritin, the main intracellular chelator of iron, typically reflect body iron stores in humans (4). Although Hmox1−/− mice displayed serum iron deficiency, we found that they also had significantly increased levels of serum ferritin (Fig. 2d). Examination of Hmox1−/− organs for iron showed that while no 6- to 9-week-old Hmox1−/− tissues had evidence of iron deposition (as assessed by Prussian blue staining; data not shown), renal proximal cortical tubules of virtually all Hmox1−/− mice over 20 weeks of age contained nonheme iron deposits, likely in the form of hemosiderin and ferritin (Fig. 3b). In addition, some 20- to 24-week and all 40- to 55-week-old Hmox1−/− mice had considerable hepatic iron staining in both Kupffer cells and hepatocytes (Fig. 3 d and f). Hmox1+/+ or Hmox1+/− animals had very little or no positive iron staining in kidneys or liver (Fig. 3 a, c, and e). The amount of stainable iron detected in other Hmox1−/− organs appeared normal (data not shown), including that in spleen, which is typically the organ with highest Hmox1 activity (19).
Figure 3.
Iron-loading in Hmox1−/− tissues. (a) Kidney section from 50-week-old Hmox1+/− mouse stained with Prussian blue for detection of loosely bound ferric iron, shown at low magnification. Stainable renal iron was rarely detectable in Hmox1+/− or Hmox1+/+ mice. (b) Kidney section from 50-week-old Hmox1−/− mouse stained with Prussian blue. Note the intense blue positive staining in the proximal cortical tubules (arrows), which was consistently observed in Hmox1−/− renal tissue. (c) Liver section from 50-week-old Hmox1+/− mouse stained with Prussian blue and at low magnification. Mice containing functional Hmox1 displayed no hepatic iron deposits. (d) Liver section from 50-week-old Hmox1−/− mouse stained with Prussian blue, demonstrating iron-loaded Kupffer cells (arrows), as well as diffusely staining hepatocytes. Note the faint-staining regenerative nodule indicative of injury (asterisk). All Hmox1−/− mice displayed hepatic iron-loading by 50 weeks of age, varying in severity. (e) High-magnification view of liver section from 50-week-old Hmox1+/− mouse stained with Prussian blue, displaying no detectable iron in hepatocytes. (f) High-magnification view of liver section from 50-week-old Hmox1−/− mouse stained with Prussian blue, indicating iron-positive granules in hepatocytes (arrowheads), and intensely staining Kupffer cells (arrows). (All magnification bars = 100 μm.)
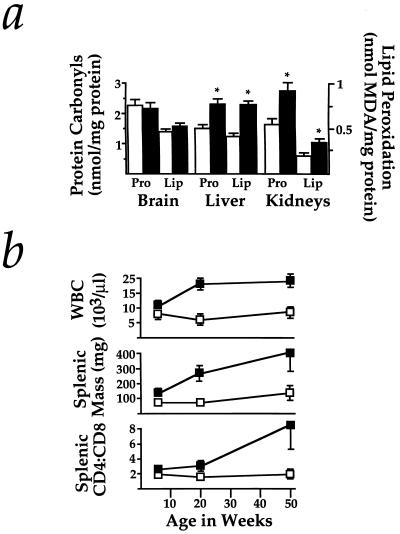
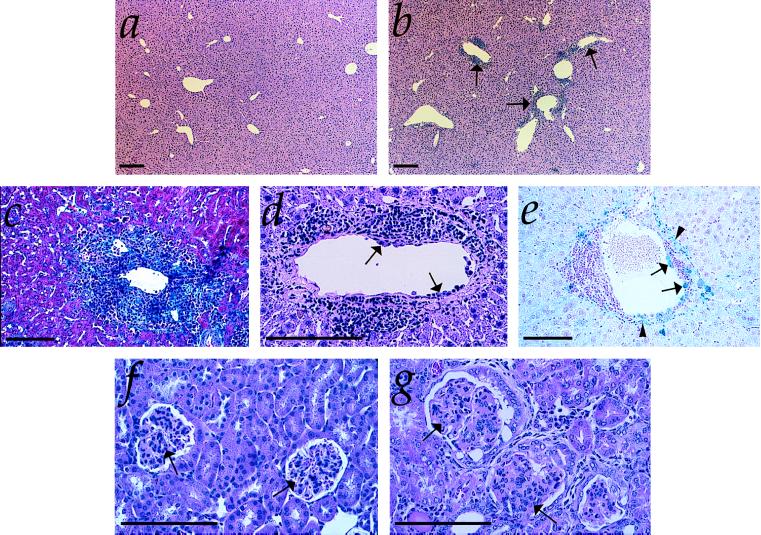
Iron-loading had several pathological consequences in Hmox1−/− mice, mildly evident by 20–24 weeks of age, when the anemia and iron deposition were first noticed, and more severe by 40–55 weeks of age. To assess oxidative stress that may have resulted from iron deposition, we analyzed levels of oxidized proteins and lipids in tissues of 20- to 24-week-old Hmox1−/− and Hmox1+/− mice. Hmox1−/− livers showed increases in oxidized proteins and lipid peroxidation values of 51% and 95% over Hmox1+/− values, respectively, while kidneys had increases of 69% and 74% (Fig. 4a). Furthermore, Hmox1−/− mice contracted a progressive chronic inflammatory disease, demonstrated by enlarged spleens (due to both extramedullary hematopoiesis and follicular hyperplasia) and lymph nodes, high peripheral white blood cell counts, high splenic and lymph node CD4+:CD8+ T-cell ratios (Fig. 4b) with numerous activated CD4+ T cells (data not shown), and consistently observed hepatic inflammatory cell infiltrates, composed of lymphocytes, plasma cells, neutrophils, and macrophages (Fig. 5 a and b). Fibrosis was evident within infiltrates (Fig. 5c), and regenerative nodules indicative of hepatic injury were occasionally noted (see Fig. 3d). While many of the infiltrates were periportal (as in Fig. 5c), others had a predilection for the portal venous tissue itself, which often contained iron deposits. Notably, we observed many instances where monocytes had adhered to vessel walls, a hallmark of vascular injury (Fig. 5 d and e). Occasionally observed were vascular and perivascular infiltrates in Hmox1−/− lungs (data not shown), and glomerulonephritis, which may have been caused either by iron toxicity or by deposition of immune complexes (Fig. 5 f and g).
Figure 4.
Markers of stress and inflammation in Hmox1−/− mice. (a) Protein carbonyls were measured by the method utilizing 2,4-dinitrophenylhydrazine in supernatant harvested from Hmox1+/− and Hmox1−/− brain, liver, or kidneys. Estimates of lipid peroxidation were obtained by malondialdehyde (MDA) measurements of tissue homogenates. Data represent mean ± SEM from duplicate or triplicate determinations from each of 4 mice of each genotype for brain samples, and each of 6–8 mice of each genotype for liver and kidney samples. Open bars represent Hmox1+/− values, while closed bars represent Hmox1−/− values. ∗, Hmox1−/− liver and kidneys, which consistently showed iron loading, had significantly greater oxidative damage than those from Hmox1+/− animals (P < 0.05). Note that Hmox1−/− brains, which had no iron deposition, showed no evidence of enhanced oxidative damage. (b) Average white blood cell counts (WBC), splenic mass, and splenic CD4+:CD8+ T-cell ratios analyzed from 7–11 mice of each age group for WBC, and 4–7 mice of each age group for splenic mass and T-cell ratios, at 6, approximately 20, and approximately 50 weeks of age. Significant differences (P < 0.05) were observed for each parameter at each age examined. □, Hmox1+/− values; ▪, Hmox1−/− values.
Figure 5.
Hepatic and renal pathology of Hmox1−/− animals. (a) Liver section from 50-week-old Hmox1+/− mouse, stained with hematoxylin and eosin and shown at low magnification. (b) Liver section from 50-week-old Hmox1−/− mouse, with typical pattern of lesions. Vascular lesions are indicated by arrows. (c) High-magnification view of typical periportal fibrosis and inflammation from a 50-week-old Hmox1−/− mouse. This section was stained with Masson’s trichrome reagent, which reacts with collagen, an indicator of fibrosis, as bright blue. (d) High-magnification view of hepatic vascular lesion shown in b stained with hematoxylin and eosin. Note the proliferation of smooth muscle, the infiltration of neutrophils and lymphocytes into the vessel wall, and the monocytes adhered to the inner vessel wall (arrows). (e) High-magnification view of hepatic vascular lesion from a 50-week-old Hmox1−/− mouse. This section was stained for ferric iron (blue). Note the iron-laden monocytes adhering to the vessel wall (arrows), as well as the iron-laden vascular and connective tissue (arrowheads). (f) High-magnification view of kidney section of 75-week-old Hmox1+/− mouse, stained with hematoxylin and eosin, displaying normal glomerular morphology (arrows). (g) Kidney section of 75-week-old Hmox1−/− mouse displaying severely damaged glomeruli with membranous proliferation, lobularity, crescent formation, and sclerosis (arrows). (All magnification bars = 100 μm.)
The appearance of pathological iron-loading in Hmox1−/− tissues temporally correlated with the diminishing of serum iron levels. The simplest explanation for these results is that Hmox1−/− mice have a defect in iron reutilization, that is, delivery from tissue stores to blood. Importantly, the pathology we described is related to nonheme rather than heme iron accrual. Therefore, our interpretation is that Hmox1 activity predominantly contributes to extracellular release of iron, while an alternative heme-metabolizing pathway(s) mainly leads to its intracellular storage.
DISCUSSION
Role of Hmox1 in Iron Reutilization.
The bulk of total body iron is contained within cellular heme moieties. The two symptoms associated with a Hmox1 deficiency, hypoferremia and iron-loading, illustrate the requirement of Hmox1-mediated heme catabolism as a part of physiological iron homeostasis. Our study also defines at least two distinct cellular mechanisms for the employment of catabolized heme iron. One is the Hmox1-dependent pathway, where free iron liberated from heme is released relatively efficiently to the extracellular space. It is unknown how Hmox1 accomplishes this, but we speculate that Hmox1-dependent cellular iron discharge may depend on the microsomal location of Hmox, which could allow interaction of the free iron product with recycling endosomal transferrin and transferrin receptors or with yet-unidentified iron transporters. The second pathway of heme catabolism, independent of Hmox1, seems to generate free iron that is predominantly shuttled to intracellular stores such as ferritin. In fact, that heme might be catabolized by an alternative mechanism was implied in a previous study, which indicated that less than 50% of endogenous hepatic heme degradation in rats was accounted for by measurement of the exhaled Hmox product, carbon monoxide (20). Possible minor mediators of heme degradation include microsomal NADPH-dependent cytochrome P450 reductase, a cytosolic xanthine oxidase, and a mitochondrial heme-degrading activity not fully characterized (21).
The Hmox isoform Hmox2 is an obvious candidate for carrying out an Hmox1-independent heme catabolic pathway. Hmox2 is chiefly distinguished from Hmox1 by its regulation, as it is not induced by heme or by oxidative stress, but is constitutively expressed at relatively high levels in most major organs. However, our previous work indicated that mice lacking functional Hmox2 show no disturbances in iron metabolism (ref. 14; K.D.P., unpublished data). Therefore, it is unclear whether Hmox2 is linked to either of the two catabolic mechanisms mentioned above.
Conspicuous Hmox1−/− iron-loading is observed only in renal cortical tubules, Kupffer cells, hepatocytes, and hepatic vascular tissue. Interestingly, preliminary work has indicated that irradiated Hmox1+/+ mice reconstituted with Hmox1-deficient bone marrow do not show anemia or hepatic and renal iron deposition at 20 weeks after transplantation (K.D.P. and S. Marusic-Galesic, unpublished data). These results suggest that, although hemolysis usually occurs in phagocytic cells (22), the parenchymal cells of the liver and kidney, which are known to incorporate the vast majority of plasma heme (20, 23), are important mediators of Hmox1-dependent heme iron reutilization.
Mouse Model of Iron Retention.
The Hmox1−/− mouse described here represents an animal model of human iron overload disorders. Parenchymal iron-loading displayed by Hmox1−/− animals constitutes the most obvious similarity with hereditary hemochromatosis, which is caused by a mutation in a nonclassical major histocompatibility complex class I-type gene (24). Several other symptoms of of Hmox1−/− mice are similar to those shown by hemochromatosis patients. These include the progression of symptoms, splenomegaly, high CD4+:CD8+ T-cell ratios, increased lipid peroxidation, fibrosis and hepatic injury, late-onset weight loss, decreased mobility, and premature mortality (3, 25). Furthermore, mature Hmox1−/− males have a nearly 25% reduction in the size of testes as compared with similarly sized Hmox1+/− littermates (K.D.P., unpublished data). Hypogonadism and lack of libido are common in males affected with hereditary hemochromatosis.
Interestingly, symptoms of Hmox1−/− mice are also similar to those of patients with anemia of chronic inflammation, who also show hypoferremia with increases in both serum ferritin and tissue iron stores (1, 26). Hmox1 activity is normally strongly up-regulated by inflammatory cytokines (27–29), and the enzyme appears to be important in preserving serum iron levels and reducing inflammation in mice. Therefore, it is conceivable that an iron release pathway involving Hmox1 is down-regulated in the course of chronic inflammatory illnesses. In this light, modulation of Hmox1 activity might be a novel therapeutic approach to improve serum iron levels and perhaps even reduce the extent of inflammation in chronically ill patients. The Hmox1−/− mouse appears to provide an especially useful model of this prevalent iron metabolic disorder.
Acknowledgments
We are grateful to R. Bronson, C. Dangler, A. Alles, M. Anderson, and M. Fleming for help with histopathology, and to K. Mercer and D. Crowley for valuable advice concerning histological techniques. We thank A. Poss, D. Gerber, K. Ishikawa, M. Fleming, M. Anderson, and M. Krieger for critique of the manuscript. S.T. was supported by a grant from the National Institutes of Health (RO1-NS32925–03) and a gift from the Shionogi Institute for Medical Science.
ABBREVIATIONS
- Hmox
heme oxygenase
- ES
embryonic stem
References
- 1.Means R T, Krantz S B. Blood. 1992;80:1639–1647. [PubMed] [Google Scholar]
- 2.Halliwell B, Gutteridge J M C. Methods Enzymol. 1990;186:1–85. doi: 10.1016/0076-6879(90)86093-b. [DOI] [PubMed] [Google Scholar]
- 3.Bacon B R, Tavill A S. In: Hepatology. A Textbook of Liver Disease. Zakim D, Boyer T D, editors. Philadelphia: Saunders; 1996. pp. 1439–1472. [Google Scholar]
- 4.Bothwell T H, Charlton R W, Motulsky A G. In: The Metabolic and Molecular Bases of Inherited Disease. Scriver C R, Beaudet A L, Sly W S, Valle D, editors. New York: McGraw-Hill; 1995. pp. 2237–2269. [Google Scholar]
- 5.Verma A, Hirsch D J, Glatt C E, Ronnett G V, Snyder S H. Science. 1993;259:381–384. doi: 10.1126/science.7678352. [DOI] [PubMed] [Google Scholar]
- 6.Nathanson J A, Scavone C, Scanlon C, McKee M. Neuron. 1995;14:781–794. doi: 10.1016/0896-6273(95)90222-8. [DOI] [PubMed] [Google Scholar]
- 7.Zakhary R, Gaine S P, Dinerman J L, Ruat M, Flavahan N A, Snyder S H. Proc Natl Acad Sci USA. 1996;93:795–798. doi: 10.1073/pnas.93.2.795. [DOI] [PMC free article] [PubMed] [Google Scholar]
- 8.Zufall F, Leinders-Zufall T. J Neurosci. 1997;17:2703–2712. doi: 10.1523/JNEUROSCI.17-08-02703.1997. [DOI] [PMC free article] [PubMed] [Google Scholar]
- 9.Keyse S M, Tyrrell R M. Proc Natl Acad Sci USA. 1989;86:99–103. doi: 10.1073/pnas.86.1.99. [DOI] [PMC free article] [PubMed] [Google Scholar]
- 10.Eisenstein R S, Garcia-Mayol D, Pettingell W, Munro H N. Proc Natl Acad Sci USA. 1991;88:688–692. doi: 10.1073/pnas.88.3.688. [DOI] [PMC free article] [PubMed] [Google Scholar]
- 11.Ewing J F, Maines M D. Proc Natl Acad Sci USA. 1991;88:5364–5368. doi: 10.1073/pnas.88.12.5364. [DOI] [PMC free article] [PubMed] [Google Scholar]
- 12.Kutty R K, Kutty G, Wiggert B, Chader G J, Darrow R M, Organisciak D T. Proc Natl Acad Sci USA. 1995;92:1177–1181. doi: 10.1073/pnas.92.4.1177. [DOI] [PMC free article] [PubMed] [Google Scholar]
- 13.Shibahara S, Muller R, Taguchi H, Yoshida T. Proc Natl Acad Sci USA. 1985;82:7865–7869. doi: 10.1073/pnas.82.23.7865. [DOI] [PMC free article] [PubMed] [Google Scholar]
- 14.Poss K D, Thomas M J, Ebralidze A K, O’Dell T J, Tonegawa S. Neuron. 1995;15:867–873. doi: 10.1016/0896-6273(95)90177-9. [DOI] [PubMed] [Google Scholar]
- 15.Bradley A. In: Teratocarcinomas and Embryonic Stem Cells: A Practical Approach. Robertson E, editor. Oxford: IRL; 1987. pp. 113–151. [Google Scholar]
- 16.Hogan B, Constantini F, Lacy E. Manipulating the Mouse Embryo. Plainview, NY: Cold Spring Lab. Press; 1986. [Google Scholar]
- 17.Oliver C N, Ahn B, Moerman E J, Goldstein S, Stadtman E R. J Biol Chem. 1987;262:5488–5491. [PubMed] [Google Scholar]
- 18.Sohal R S, Agarwal S, Dubey A, Orr W C. Proc Natl Acad Sci USA. 1993;90:7255–7259. doi: 10.1073/pnas.90.15.7255. [DOI] [PMC free article] [PubMed] [Google Scholar]
- 19.Braggins P E, Trakshel G M, Kutty R K, Maines M D. Biochem Biophys Res Commun. 1986;141:528–533. doi: 10.1016/s0006-291x(86)80205-4. [DOI] [PubMed] [Google Scholar]
- 20.Bissell D M, Guzelian P S. J Clin Invest. 1980;65:1135–1140. doi: 10.1172/JCI109767. [DOI] [PMC free article] [PubMed] [Google Scholar]
- 21.Maines M D. Annu Rev Pharmacol Toxicol. 1997;37:517–554. doi: 10.1146/annurev.pharmtox.37.1.517. [DOI] [PubMed] [Google Scholar]
- 22.Noyes W D, Bothwell T H, Finch C A. Br J Haematol. 1960;6:43–55. doi: 10.1111/j.1365-2141.1960.tb06216.x. [DOI] [PubMed] [Google Scholar]
- 23.Hershko C, Cook J D, Finch C A. J Lab Clin Med. 1972;80:624–634. [PubMed] [Google Scholar]
- 24.Feder J N, Gnirke A, Thomas W, Tsuchihashi Z, Ruddy D A, et al. Nat Genet. 1996;13:399–408. doi: 10.1038/ng0896-399. [DOI] [PubMed] [Google Scholar]
- 25.Arosa F A, da Silva A J, Godinho I M, ter Steege J C, Porto G, Rudd C E, de Sousa M. Scand J Immunol. 1994;39:426–432. doi: 10.1111/j.1365-3083.1994.tb03396.x. [DOI] [PubMed] [Google Scholar]
- 26.Lee G R. Semin Hematol. 1983;20:61–80. [PubMed] [Google Scholar]
- 27.Cantoni L, Rossi C, Rizzardini M, Ghezzi P. Biochem J. 1991;279:891–894. doi: 10.1042/bj2790891. [DOI] [PMC free article] [PubMed] [Google Scholar]
- 28.Kutty R K, Naginemi G N, Kutty G, Hooks J J, Chader G J, Wiggert B. J Cell Physiol. 1994;159:371–378. doi: 10.1002/jcp.1041590221. [DOI] [PubMed] [Google Scholar]
- 29.Rizzardini M, Terao M, Falciani F, Cantoni L. Biochem J. 1993;290:343–347. doi: 10.1042/bj2900343. [DOI] [PMC free article] [PubMed] [Google Scholar]


