

Abstract
The temporally encoded information obtained by vibrissal touch could be decoded “passively,” involving only input-driven elements, or “actively,” utilizing intrinsically driven oscillators. A previous study suggested that the trigeminal somatosensory system of rats does not obey the bottom-up order of activation predicted by passive decoding. Thus, we have tested whether this system obeys the predictions of active decoding. We have studied cortical single units in the somatosensory cortices of anesthetized rats and guinea pigs and found that about a quarter of them exhibit clear spontaneous oscillations, many of them around whisking frequencies (≈10 Hz). The frequencies of these oscillations could be controlled locally by glutamate. These oscillations could be forced to track the frequency of induced rhythmic whisker movements at a stable, frequency-dependent, phase difference. During these stimulations, the response intensities of multiunits at the thalamic recipient layers of the cortex decreased, and their latencies increased, with increasing input frequency. These observations are consistent with thalamocortical loops implementing phase-locked loops, circuits that are most efficient in decoding temporally encoded information like that obtained by active vibrissal touch. According to this model, and consistent with our results, populations of thalamic “relay” neurons function as phase “comparators” that compare cortical timing expectations with the actual input timing and represent the difference by their population output rate.
Keywords: neural coding, phase-locked loops, thalamocortical loops, vibrissal touch, neuronal oscillations
Rats, like other rodents, possess a specialized system for active touch. During tactile exploration, their whiskers scan the environment by rhythmic movements of 5–11 Hz (1, 2) to obtain sensory information about the location and texture of external objects (3, 4). Temporally, an object’s location is encoded by the time interval between receptor firing at the onset of a whisking cycle and receptor firing due to perturbation of whisker motion by an external object [first-order vibrissal neurons respond strongly to these two events (5)]. This information could be decoded “passively;” that is, by feed-forward, bottom-up transformations utilizing neuronal temporal sensitivities (6) [axonal delay lines are not efficient at the millisecond range (7)]. Alternatively, temporal decoding could be obtained “actively,” which involves top-down processes whereby intrinsic cortical oscillators track the input and provide a measure of its instantaneous frequency (8, 9).
In passive decoding, sensory signals propagate in a feed-forward manner to the cortex through thalamic “relay” neurons (Fig. 1A). Thus, whisker-locked activities of somatosensory thalamic neurons should lag brainstem but lead the cortical activities (Fig. 1B). In contrast, during whisker-locked oscillatory epochs in freely behaving rats, thalamic neurons phase-lag both brainstem and cortical neurons (10). Moreover, the oscillatory epochs are usually initiated at the cortex, further questioning the assumption of passive temporal decoding. However, both observations are consistent with active decoding, which involves intrinsic cortical oscillators that lock-in to the input frequency (Fig. 1 A and B). According to this hypothesis, the somatosensory cortex should employ independent oscillators that can phase-lock to periodic inputs and track changes in the instantaneous input frequency. We report here the existence of ≈10-Hz single-cell oscillators in the somatosensory cortices of rats and guinea pigs. We show that their oscillating frequencies can be locally controlled by glutamate and can track the frequencies of periodic whisker stimulations. We propose a specific model for the involvement of these oscillators in active temporal decoding, present simulations, and describe additional testable predictions of the model.
Figure 1.

Possible pathways for temporal decoding. (A) Passive decoding is assumed to flow through feed-forward connections where the activity at each level depends on the activity at a lower (more peripheral) level. Arrows represent feed-forward elements including “simple” axons, delay lines, and synapses. Active decoding involves an independent cortical source of information—local oscillators; information flows both ways and compared, in this example, in the thalamus. The circuits can be closed (dashed lines) or open loops. (B) Possible orders of activations determined by the causal dependencies. With passive decoding the cortical neurons must lag at least some of the thalamic neurons, whereas with active decoding cortical neurons can fire at any time due to their intrinsic oscillatory sources. When operating as comparators, thalamic neurons should lag at least some of the cortical neurons. (C) Active decoding by direct coupling between input oscillations and cortical oscillators. (D) Predicted dependencies of thalamic responses on the input frequency.
MATERIALS AND METHODS
Recording and Iontophoresis.
Standard methods for anesthesia, surgery, and recordings were used (11, 12). Briefly, the rats (n = 7) were anesthetized by an i.p. injection of urethane (1.5 g/kg initially, plus 0.15 g/kg when required). The guinea pigs (n = 7) were anesthetized by an i.p. injection of urethane (1.2 g/kg) and supplementary i.m. injections of Rompun (xylazine hydrochloride, 8 mg/kg) when required. Four electrodes were driven into the somatosensory cortices: two standard tungsten-in-glass electrodes and two “combined electrodes,” each consisted of a tungsten electrode within the central barrel of a seven-barreled glass pipette (11). In these experiments, two barrels were filled with NaCl (3 M) and four with glutamate (1 M). Single-units were isolated by spike templates and multiunits by amplitudes using spike sorters (MSD-2, Alpha-Omega; Nazareth, Israel). Glutamate was applied iontophoretically through the surrounding pipettes of the combined electrodes. Because ejection currents were low (<40 nA), unbalanced ejections were used to avoid ejection of glutamate by the balance barrel during retention periods (13). Control NaCl currents of <40 nA did not affect the rates or autocorrelations of the recorded cells. Ejecting tips were distanced ≈20 μm from the recording tip (11).
Stimulations.
An electromagnetic vibrator (14) was attached to the principal whisker associated with the cortical column containing the studied neuron (15). For each frequency, stimuli were applied in trains of 6-s vibrations plus 4-s pauses each, which were repeated 10 or 20 times. Two types of stimuli were used: (i) Square-wave stimuli: within each cycle, the whisker was protracted for half a cycle and then retracted with peak-to-peak amplitudes of 100–320 μm (5 mm from the face); and (ii) pulse stimuli: during the first 10 ms of each cycle the whisker was protracted (rise time = 5 ms, amp = 160 μm) and immediately retracted (fall time = 5 ms), producing a constant movement profile for all frequencies.
Data Analysis.
Auto- and cross-correlation histograms (8, 12) were calculated for all spike trains and simultaneously recorded spike trains, respectively, in all experimental conditions and were monitored on-line for the appearance of oscillations. Oscillating correlograms were quantitatively analyzed off-line and were classified as “clear oscillatory” if they passed the following criteria (8): (i) the autocorrelation included at least three peaks, with <15% jitter of the inter-peak intervals; (ii) the modulation depth [(peak rate − trough rate)/mean rate] of the second peak exceeded 20%; and (iii) the second peak was significantly above chance level (<0.01). First-order interspike-interval (ISI) histograms were calculated off-line. Stimulus-driven activities were further analyzed using (i) standard peri-stimulus-time histograms (PSTHs), which present average responses; and (ii) plots of ISIs and stimulus-to-spike delays (OSC delays) as functions of time, presenting single trial dynamics (e.g., see Fig. 3B). Average response intensities and latencies were measured from the PSTHs (see the legend to Fig. 4).
Figure 3.

Frequency locking of a single-cell cortical oscillator (OSC) recorded from layers 2–3 of the barrel cortex of an anesthetized rat during stimulations of whisker E2 with square-wave stimuli (see Materials and Methods). (A) ISI histograms computed during the entire stimulation periods (blue) and the interleaved spontaneous periods (cyan). Red arrows point to the interstimulus intervals. (B) Lock-in dynamics during single stimulus trains. ISls (blue), inter-stimulus-intervals (red) and OSC-delays (green) are plotted as a function of time. Time 0 and the dashed line denote the beginning of a stimulus train. Note the 1:1 firing (one OSC spike per stimulus cycle) and constant phase difference during stabilized states. In the trial presented at the Bottom, the OSC remained “locked” for two additional cycles after the stimulus train ended.
Figure 4.

Comparison of OSCs and non-OSCs response characteristics. (A) Entrainment tuning curves for 13 OSCs of the barrel cortex. OSCs were recorded from layers 2–3 (n = 4), 4 (n = 3), and 5–6 (n = 6) and their principal whiskers were stimulated with either square-wave or pulse stimuli. Symbols show the spontaneous frequencies of these oscillators. Locking index = 1 − |fi − fo|/(fi + fo), where fi is the stimulation frequency and fo is the oscillator frequency during stimulation. Oscillators were grouped by their locking ranges. (B) OSC delays of the 13 OSCs. OSC delays were measured from PSTHs as the delays between stimulus onset and onset of the closest activity peak of the oscillator. Oscillators that showed no dependency [n = 4, green symbols, all showed wide lock-in ranges (A Lower)] were pooled up separately. Different OSCs were tested with different frequencies. Small symbols indicate n = 1 for that frequency. Vertical lines indicate standard errors of the means. (C and D) Responses of non-OSC multiunits from layers 4–5 of the rat barrel cortex to pulse-stimuli applied to their principal whiskers. (C) Dependency of multiunit (n = 18) output rates and latencies-to-peak (Inset) on the stimulus frequency. All spikes that were elicited between 10 to 60 ms from the stimulus onset were counted and averaged over all repetitions of the same stimulus frequency. Latencies to peak response were measured from PSTHs, such as those in D. Neurons that showed no dependency (n = 4, green symbols) were pooled up separately. Symbols and vertical lines as in B. (D) PSTHs of a layer 5 non-OSC multiunit to different stimulus frequencies. Increased latency and reduced output rate accompanied increased stimulus frequency.
Histology.
Recorded neurons were related to cortical layers by comparing the recording depth with the histologically defined layers and with the location of electrolytical lesions induced at the end of recording sessions. Cortical layers were defined in coronal sections of paraffin-embedded hemispheres that were stained with cresyl violet (15). In these preparations, the different layers, barrel borders, and the tracks of the electrodes were clearly seen. In some experiments (with both species), the cortices were flattened, embedded in paraffin and cut parallel to pial surface. With consecutive sections, the locations of the coagulated tissue, induced by the lesions, were related to specific barrels of the posteromedial barrel subfiels.
Simulations.
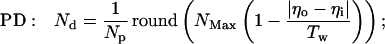
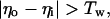
The inhibitory phase-locked loop (iPLL; see Results) was simulated with linear transfer functions for the phase detector (PD) and the rate-controlled oscillator (RCO). The RCO was simulated as a single neuron and the PD as a population of Np neurons that inhibit the RCO. The afferent input to the PD was simulated as a sequence of ISIs. The PD’s population output was active at every time step for which both PD’s inputs (i.e., the afferent input and the RCO’s output) had been active (not necessarily simultaneously) within a preceding time window of duration Tw. Therefore, the PD responded at a constant average rate for a duration whose length became shorter as the absolute time delay between the two inputs became longer (see figure 4 in ref. 9). While the PD was active, the RCO’s ISI increased (reflecting an inhibitory effect) at a constant rate, so that the total increment in the RCO’s ISI was proportional to the number of spikes elicited by the PD (i.e., the integral of the PD’s response) at the same cycle.
The RCO and PD were thus simulated by the following equations (see also ref. 9):
 |
1 |
 |
 |
 |
 |
2 |
where Io is the RCO’s ISI; Tc is the RCO’s intrinsic period; γ is the sensitivity of the RCO to its input; Np is the number of neurons composing the PD; Nd is the number of spikes elicited, on the average, by a single PD neuron during the current RCO’s interval; NMax is the maximal number of spikes that can be elicited by the PD during a single RCO’s interval; Tw is the maximum time delay to which the PD responds and round(x) rounds x to its nearest integer. The parameters are as follows: Tc = 100 ms, Tw = 50 ms, Np = 20 neurons, NMax = 500 spikes (per cycle), γ = 0.08 ms/spike. The delays are as follows: input-to-PD = 5 ms; RCO-to-PD = 3 ms.
RESULTS
Spontaneous Single-Cell Oscillations.
We have recorded the spontaneous activities of single neurons from the somatosensory cortices under anesthesia to rule out whisking-locked oscillations. About half of the recorded neurons (533/1,127) exhibited signs of spontaneous oscillatory activity, as characterized by multiple, equally spaced peaks in the autocorrelograms (e.g., Fig. 2B). Of these neurons, 256 (23% of the total) exhibited “clear oscillations,” i.e., their oscillatory pattern satisfied predefined criteria for periodicity (see Materials and Methods and ref. (8). Clearly oscillating neurons were recorded from supragranular, granular, and deep layers with similar probabilities. The majority of the frequencies of the clear oscillations (Fig. 2A) were either around 1 Hz (probably due to anesthesia and responses to respiratory body movements), 10 Hz, or 100 Hz. Somewhat surprisingly, the distribution of oscillating frequencies was similar between hardly whisking (guinea pigs) and vigorously whisking (rats) animals. In both, but mainly in rats, the ≈10-Hz oscillators could be utilized for active sensory decoding.
Figure 2.

(A) Distribution of clear oscillation frequencies in the somatosensory cortices of rats (n = 152 frequencies) and guinea pigs (n = 132). Of the 256 clearly oscillating neurons, 26 exhibited more than one oscillating frequency. (B) Effect of glutamate on oscillation frequencies. Autocorrelograms of a guinea pig OSC before (panel 1), during (panels 2 and 4), and between (panel 3) glutamate applications at 30 s each. (C) Current-frequency curves for nine OSCs (two from rats and seven from guinea pigs).
Efficient active decoding requires oscillatory mechanism whose frequency can be controlled locally (9). We have tested the dependency of oscillating frequencies on local excitation levels by applying glutamate to the vicinity of the single-cell ≈10 Hz oscillators (OSCs). Upon applications of glutamate, 17 (63%) of 27 neurons increased their oscillatory frequency, usually with a monotonic dose-response dependency (Fig. 2 B and C). Of the other 10, 8 (30%) did not change their frequency, 1 decreased its frequency, and 1 became nonoscillatory. Thus, the oscillating frequencies of the majority of the recorded oscillators could be controlled locally. This result and the fact that the spontaneous ≈10-Hz oscillations were usually not correlated among neighboring cells suggest that the origin of the oscillations was local.
Frequency and Phase Locking to Vibrissal Stimulations.
To participate in active decoding, the local oscillators should follow, at least to some extent, changes in whisker movement frequencies (9). Whereas passive entrainment of nonoscillatory neurons (non-OSCs; neurons that show no spontaneous oscillations) is well documented, frequency locking of cortical single-cell oscillators by sensory stimulation was demonstrated only in monkeys (16). We have tested frequency locking of 13 OSCs by applying periodic stimulations to the whiskers that best activated the cortical columns containing the studied OSCs (Fig. 3; see Materials and Methods). All oscillators exhibited working ranges in which they locked to input frequencies that were both lower and higher than their spontaneous oscillating frequencies (Fig. 4A). With stimulation frequencies between 1 and 15 Hz, four OSCs could track only frequencies below 10 Hz (Fig. 4A Upper) and nine could track frequencies both above and below 10 Hz (Fig. 4A Lower). During frequency locking (entrainment), the peaks of the OSCs’ autocorrelations and ISI histograms were shifted from their spontaneous periods and became centered around the stimulation periods (Fig. 3A). Detailed examinations of individual ISIs indicated that OSCs locked in and out during presentations of oscillatory stimulations. Fig. 3B demonstrates early (Middle) and late (Bottom) lock-in cases within single trials. The locked states were characterized by stabilized ISIs and stimulus-to-OSC delays (OSC-delays; Fig. 3B). Often, OSCs fired one or more “extra spikes”, at the stimulus’ ISI, after the completion of the stimulus train (e.g., Fig. 3B Lower).
We observed that, within the range of 3–12 Hz (i.e., within the whisking frequency range), the phase difference of all recorded OSCs increased with increasing input frequency (Figs. 3B and 4B). By phase difference we refer to the ratio of the OSC-delay to the input ISI that varies in the interval [0,1). The observed dependence of the phase difference on the input frequency is predicted by the theory of stable forced oscillations (17). We further observed that in most cases the increase in phase difference was associated with an increase in the OSC delay (Figs. 3B and 4B). Only in four cases the increase in phase difference was a by-product of the change in the period of the oscillations at a constant OSC delay (Fig. 4B).
Direct Coupling Rejected.
Forced oscillations at the level of the OSCs may simply indicate that the OSCs are forced directly by the input (17) via thalamic “relay” neurons (Fig. 1C). This implementation gives rise to temporal-to-phase decoding: the temporal information is encoded in the relative phases of an ensemble of OSCs, where OSCs with different intrinsic frequencies oscillate at different phases. A strong prediction of this “direct coupling” hypothesis is that the response characteristics of the thalamic neurons should follow the peripheral ones. The response intensities (per cycle) and latencies of most of the vibrissal afferents are determined by the amplitude and velocity of the whisker stimulations independent of the frequency (up to, at least, 50 Hz) at which the stimulations are repeated (18, 19). Similarly, if thalamic neurons only relay input information, whisker stimulations at 1–12 Hz with constant amplitude and velocity should yield constant thalamic output rates (per cycle) and latencies (Fig. 1D).
To characterize the thalamic input to the barrel cortex, we have recorded, during the same vertical penetrations in which OSCs were recorded, the activity of non-OSCs in layers 4–5, layers that receive most of the thalamic input (20, 21). To keep peripheral responses (per cycle) constant, we deflected the whiskers with pulses of a constant amplitude and velocity, and varied only the interpulse interval to obtain different frequencies (pulse stimuli, see Materials and Methods). Whereas layers 4–5 non-OSCs were entrained by almost all frequencies between 1 to 15 Hz, their response intensities and latencies, unlike the expected peripheral responses, usually varied (decreasing and increasing, respectively) with increasing frequency (Fig. 4 C and D). Both latency-to-onset and latency-to-peak increased with the input frequency, with the latter exhibiting a more pronounced dependency. The increased latency was not a by-product of the decreased intensity because, with constant input frequencies, there was no correlation between latencies and response intensities among these neurons (r2 = 0.03, n = 69, P > 0.2). The dissociation between the response characteristics of layers 4–5 non-OSCs and those expected at the periphery strongly suggests that thalamic neurons did not merely relay sensory oscillations but, rather, participated in their processing. This finding is consistent with previous findings describing significant transformations at the level of thalamic “relay” neurons (22).
The Phase-Locked Loop (PLL) Model.
The above observations are consistent with the hypothesis that entire thalamocortical loops (containing the OSCs) behave as forced oscillations, and, in particular, implement PLLs—circuits that utilize intrinsic oscillators to decode temporal information and convert it into rate code (refs. 8 and 9; see also ref. 23). The basic thalamocortical PLL circuit relies on a cortical rate-controlled oscillator (RCO; Fig. 5A) and a thalamic PD. A RCO is an intrinsic oscillator that modulates its oscillating frequency as a monotonic function of its input’s rate. The controlling input to the RCO is generated by the PD. The PD detects the delay between the input and the RCO, and responds with an output rate that varies monotonically with this delay. The PLL can decode temporal information whenever the PD and RCO transfer functions establish a stable negative feedback loop (9, 23). Two basic stable implementations of the PLL are referred to as excitatory PLL, in which the PD directly drives the RCO, and iPLL, in which the PD drives inhibitory interneurons that inhibit the RCO (Fig. 5A). By virtue of its stable negative feedback, the PLL forces the RCO to phase-lock to the input; deviations of the input from its expected timing (as represented by the cortical RCO’s timing) are detected by the thalamic PD, affect the PD’s output rate, and thereby, readjust the timing of the subsequent RCO’s activity. The corresponding PD’s output rate, which is required to adjust the RCO’s oscillating frequency to the input frequency, establishes a rate-encoded representation of the temporal information in the input. For example, when the iPLL locks in to higher frequencies, the RCO requires less inhibition, and thus the iPLL stabilizes at lower PD outputs and longer RCO delays (Fig. 5B).
Figure 5.

(A) The thalamo-cortical iPLL decoder. INH, inhibitory neuron(s); -, inhibitory connection; ηo, time of the recent RCO spike; ηi, time of the recent input spike. (B) iPLL transfer functions. The transfer functions should be monotonic, but not necessarily linear, within the PLL’s working ranges. The PD’s output decreases as the RCO delay (ηo − ηi) increases (PD curve). The RCO’s firing time is delayed as the PD’s output is increased (RCO curves). The exact relation between the two transfer functions depends on the input frequency (f1 < f2 < f3); stable (crossing) working points for higher frequencies are associated with larger RCO delays and lower outputs. (C) Simulation of an iPLL: steady input. (Upper) Frequency and phase locking-in are depicted. Stimulus started at t = 500 ms (dashed line). The RCO’s ISI (•) followed the input’s ISI (□). During the phase-locked state, the RCO-delay (Top) and the output rate (Nd/Io) of the average single PD neuron (Middle) were stabilized at values that represented the input frequency. The cycle histograms (Bottom) describe the instantaneous firing rates of the RCO and of the PD as functions of the input phase. After phase-locking was achieved, the RCO’s firing always preceded the PD’s firing. (D) Simulation of an iPLL: object localization. The whisking (period of 110 ms) commenced at t = 410 ms and the object was introduced at t = 1200 ms and at a spatial angle of 32°. The introduction of the object was simulated by inserting, in every whisking cycle, an additional input spike at the time when the whisker would have touched the object (20 ms from the protraction onset). After a transient response, the PLL relocked to the full whisking cycle, but with a new phase (upper panel). Different object locations (8°, 16°, and 32°) yielded, and thus are encoded by, different magnitudes of the transient response (Lower).
In general, the iPLL requires an increasing RCO transfer function and a decreasing PD transfer function (Fig. 5B) with the RCO delay being directly related to the input frequency. Thus, unlike direct coupling, the iPLL predicts that thalamic output rates (per cycle) will decrease while OSC delays and thalamic latencies will increase with increasing input frequencies (Fig. 1D). Indeed, these predictions agree with the locking characteristics of cortical OSCs and the response characteristics of non-OSCs in the thalamic-recipient layers of the cortex (Figs. 3 and 4). However, causal relationships between OSCs and layers 4–5 non-OSCs could not be determined in this study because only rarely were these two cell types recorded simultaneously, and the non-OSC responses were averaged over the entire stimulation period, regardless of the locking state of the presumed underlying phase-locked loops.
Simulations.
The operation of the PLL, the compatibility of its response with the experimental data, and its predicted behavior during object localization were demonstrated by computer simulations (see Materials and Methods). The response of an iPLL to a steady input rhythm, such as whisking in a free-field, is depicted in Fig. 5C. Once phase-locking is obtained, the RCO’s ISI equals the input’s ISI (Fig. 5C Top), the RCO’s delay (Top) and the output’s firing rate (Middle) stabilize at values that represent the input frequency, and, in agreement with the experimental data (10), “cortical” RCOs phase-lead the “thalamic” PDs (Bottom). The location of an object that is introduced in the whisking field is encoded in the input ISIs by inserting, in every whisking cycle, an additional input spike at the time when the whisker would have touched the object (Fig. 5D Upper). The iPLL responds by temporarily increasing the rate of the PD until a new phase relation is established. The level of the transient output rate of the PLL is directly related to, and thus re-encodes, the object’s location (Fig. 5D Lower). Such responses are predicted for thalamic, or thalamic recipient, non-OSCs during active whisking that is perturbed by an external object.
DISCUSSION
We have studied the steady-state features of spontaneous and vibrissa-coupled cortical oscillations. We have shown that oscillations appear spontaneously in somatosensory cortical single cells and, when coupled with vibrissal periodic stimuli, exhibit behavior that is consistent, in general, with the theory of forced oscillators (17). However, the behavior of multiunits in the thalamic-recipient layers of the barrel cortex was not consistent with a simple “relay” role of the thalamus during the epochs of forced oscillations. Rather, this behavior was consistent with thalamic neurons comparing cortical oscillatory timing against vibrissal timing within thalamocortical PLLs. According to this hypothesis, the entire thalamocortical PLLs are forced by vibrissal oscillations and, during this process, re-encode the vibrissal temporal information in their output firing rates. Such a function explains the present and previous results, suggests a role for the massive corticothalamic feedback connections, and assigns a comparator role for thalamic relay neurons. The PLL principles delineated here may also be applicable to manual tactile decoding (8, 9), decoding of texture and motion by the visual system (A. Arieli and E.A., unpublished observations), and decoding of speech by the auditory system.
Vibrissal Temporal Encoding.
As far as we know, no direct experiment has yet been conducted to define the nature of vibrissal encoding (of object location) that is utilized by the nervous system. However, recordings of vibrissal first-order neurons indicate that afferent signals are time-locked to the onset of a whisking cycle (5, 10, 18) and to the onset of a perturbation due to an external object (5), allowing the straight-forward encoding-by-time of object location (5) assumed here. Different whisker arcs encode the same location with different phases within a whisking cycle. The anatomical isolation between corticothalamic loops processing different whisker arcs (24) suggests that these circuits first decode the temporally encoded information rather than integrate spatiotemporal information. According to the PLL model, integration across different arcs, which is probably required for improving object identification, occurs in later processing stages, where information is mainly rate-encoded. This processing model predicts that a single whisker (in each side) should be sufficient for object localization.
Cortical Oscillations.
Cortical single-cell oscillations were recorded previously in the primate somatosensory cortices (8, 16). Whereas in the rodents the majority of >1-Hz oscillators had frequencies around the whisking frequencies (≈10 Hz), the majority of the monkey’s oscillators oscillated around 30 Hz, a frequency range that matches the best frequencies of the monkey’s rapidly adapting skin mechanoreceptors. In both cases the oscillatory activity was mostly noncorrelated among neighboring neurons as revealed from cross-correlograms. Independent neural oscillators with intrinsic frequencies that match the rhythm of sensory events can participate in decoding temporal sensory information, as proposed here. Whereas correlated oscillations, often observed in visual (25), olfactory (26), and motor (27) cortices and which show no obvious relation to sensory temporal patterns, were hypothesized to participate in binding of neural activity (25) or in temporal encoding of the stimuli (26, 28).
Thalamic Phase Detection.
Input frequency affected OSC delays and non-OSCs latencies (in layers 4–5) in a similar way (compare Inset of Fig. 4 C and Fig. 4B). This observation along with the finding that thalamic neurons phase-lag cortical neurons during whisker-locked oscillatory epochs (10) suggest that populations of thalamocortical neurons function as AND-like PDs; that is, a combined operation of both the afferent and cortical inputs is required to activate the thalamocortical neurons (9). Indeed, the outputs of the two somatosensory thalamic nuclei, the rostral sector of the thalamic posterior complex (29) and, to a lesser degree, the medial ventral posterior nucleus (30), behave as AND-like functions of the sensory and the cortical inputs (see ref. 31 for possible anatomical mechanisms). Usually, the output of AND-like neuronal elements depend on the overlap, and thus on the delay, between the two inputs. In the ranges of delays where this dependency is monotonic (i.e., the “working ranges”), a PD-like operation results (9). A critical prediction of an AND-like PD operation is that during locked (stabilized) states, the cortical OSCs will phase-lead the thalamic non-OSCs. Testing this prediction requires simultaneous recordings of cortical OSCs and thalamic, or thalamic-recipient, non-OSCs.
Conclusion.
We propose that the somatosensory system of rodents contains, embedded in other networks, parallel PLL circuits, tuned around 10 Hz, that decode the location of external objects. The computational function of PLL circuits is 2-fold: (i) temporal-to-rate code conversion, and (ii) novel stimulus detection. Temporal-to-rate conversion of the vibrissal input is essential for sensory–sensory integration (with other, rate-encoded inputs) and for sensory–motor integration, as long as the motor commands are, as generally assumed, rate-encoded (32). Novel stimulus detection by PLL emerges from the computation of the difference between cortical expectations and the actual timing of sensory events. Neuronal PLL in the vibrissal system would respond strongly and transiently when a new object appears (Fig. 5D Lower), thus providing key information for the survival of the rodent.
Acknowledgments
We thank M. Ahissar, M. Brecht, M. E. Diamond, R. Malach, H. Markram, Daniel E. Shulz, and D. J. Simons for their comments on earlier versions; K.O. Johnson for kindly providing the electromagnetic stimulator, advice, and discussions; and B. Schick for reviewing the manuscript. This work was supported by the Minna-James-Heineman Foundation (Germany); the Israel Science Foundation (Israel); and the United States–Israel Binational Science Foundation (Israel).
Footnotes
This paper was submitted directly (Track II) to the Proceedings Office.
Abbreviations: ISI, interspike-interval; OSC, oscillatory single-units with spontaneous frequency around 10 Hz; non-OSC, nonoscillatory units; OSC delay, delay between stimulus onset and OSC firing; PLL, phase-locked loop; iPLL, inhibitory PLL; RCO, rate-controlled oscillator; PD, phase detector; PSTH, peri-stimulus-time histogram.
References
- 1.Welker W I. Behavior. 1964;22:223–244. [Google Scholar]
- 2.Carvell G E, Simons D J. J Neurosci. 1990;10:2638–2648. doi: 10.1523/JNEUROSCI.10-08-02638.1990. [DOI] [PMC free article] [PubMed] [Google Scholar]
- 3.Gustafson J W, Felbain-Keramidas S L. Psychol Bull. 1977;84:477–488. [PubMed] [Google Scholar]
- 4.Simons D J. In: Cerebral Cortex. Jones E G, Diamond I T, editors; Jones E G, Diamond I T, editors. Vol. 11. New York: Plenum; 1995. pp. 263–297. [Google Scholar]
- 5.Zucker E, Welker W I. Brain Res. 1969;12:138–156. doi: 10.1016/0006-8993(69)90061-4. [DOI] [PubMed] [Google Scholar]
- 6.Buanomuno D, Merzenich M M. Science. 1995;267:1028–1030. doi: 10.1126/science.7863330. [DOI] [PubMed] [Google Scholar]
- 7.Carr C E. Annu Rev Neurosci. 1993;16:223–243. doi: 10.1146/annurev.ne.16.030193.001255. [DOI] [PubMed] [Google Scholar]
- 8.Ahissar E, Vaadia E. Proc Natl Acad Sci USA. 1990;87:8935–8939. doi: 10.1073/pnas.87.22.8935. [DOI] [PMC free article] [PubMed] [Google Scholar]
- 9.Ahissar, E. (1997) Neural Computation, in press.
- 10.Nicolelis M A L, Baccala L A, Lin R C S, Chapin J K. Science. 1995;268:1353–1358. doi: 10.1126/science.7761855. [DOI] [PubMed] [Google Scholar]
- 11.Haidarliu S, Shulz D, Ahissar E. J Neurosci Methods. 1995;56:125–131. doi: 10.1016/0165-0270(94)00114-v. [DOI] [PubMed] [Google Scholar]
- 12.Shulz D, Cohen S, Haidarliu S, Ahissar E. Eur J Neurosci. 1997;9:396–409. doi: 10.1111/j.1460-9568.1997.tb01409.x. [DOI] [PubMed] [Google Scholar]
- 13.Sillito A M, Kemp J A. Brain Res. 1983;289:143–155. doi: 10.1016/0006-8993(83)90015-x. [DOI] [PubMed] [Google Scholar]
- 14.Schneider W. Johns Hopkins APL Tech Dig. 1988;9:39–43. [Google Scholar]
- 15.Haidarliu S, Ahissar E. J Comp Neurol. 1997;385:515–527. doi: 10.1002/(sici)1096-9861(19970908)385:4<515::aid-cne3>3.0.co;2-6. [DOI] [PubMed] [Google Scholar]
- 16.Lebedev M A, Nelson R J. J Comp Neurosci. 1995;2:313–334. doi: 10.1007/BF00961443. [DOI] [PubMed] [Google Scholar]
- 17.Kopell N. In: Neural Control of Rhythmic Movements in Vertebrates. Cohen A H, Rossingnol S, Grillner S, editors; Cohen A H, Rossingnol S, Grillner S, editors. New York: Wiley; 1988. pp. 369–413. [Google Scholar]
- 18.Shipley M T. J Neurophysiol. 1974;37:73–90. doi: 10.1152/jn.1974.37.1.73. [DOI] [PubMed] [Google Scholar]
- 19.Hahn J F. J Physiol (London) 1971;213:215–226. doi: 10.1113/jphysiol.1971.sp009377. [DOI] [PMC free article] [PubMed] [Google Scholar]
- 20.Keller A. In: Cerebral Cortex. Jones E G, Diamond I T, editors; Jones E G, Diamond I T, editors. Vol. 11. New York: Plenum; 1995. pp. 221–262. [Google Scholar]
- 21.Armstrong-James M. In: Cerebral Cortex. Jones E G, Diamond I T, editors; Jones E G, Diamond I T, editors. Vol. 11. New York: Plenum; 1995. pp. 333–373. [Google Scholar]
- 22.Gottschaldt K-M, Vahle-hinz C, Hicks T P. In: Somatosensory Integration in the Thalamus. Macchi G, Rustioni A, Spreafico R, editors; Macchi G, Rustioni A, Spreafico R, editors. Amsterdam: Elsevier; 1983. pp. 199–216. [Google Scholar]
- 23.Gardner F M. Phaselock Techniques. New York: Wiley; 1979. [Google Scholar]
- 24.Hoogland P V, Welker E, Van der Loos H. Exp Brain Res. 1987;68:73–87. doi: 10.1007/BF00255235. [DOI] [PubMed] [Google Scholar]
- 25.Engel A K, Konig P, Kreiter A K, Schillen T B, Singer W. Trends Neurosci. 1992;15:218–226. doi: 10.1016/0166-2236(92)90039-b. [DOI] [PubMed] [Google Scholar]
- 26.MacLeod K, Laurent G. Science. 1996;274:976–979. doi: 10.1126/science.274.5289.976. [DOI] [PubMed] [Google Scholar]
- 27.Murthy V N, Fetz E E. Proc Natl Acad Sci USA. 1992;89:5670–5674. doi: 10.1073/pnas.89.12.5670. [DOI] [PMC free article] [PubMed] [Google Scholar]
- 28.Hopfield J J. Nature (London) 1995;376:33–36. doi: 10.1038/376033a0. [DOI] [PubMed] [Google Scholar]
- 29.Diamond M E, Armstrong-James M, Budway M J, Ebner F F. J Comp Neurol. 1992;319:66–84. doi: 10.1002/cne.903190108. [DOI] [PubMed] [Google Scholar]
- 30.Yuan B, Morrow T J, Casey K L. J Neurosci. 1985;5:2971–2978. doi: 10.1523/JNEUROSCI.05-11-02971.1985. [DOI] [PMC free article] [PubMed] [Google Scholar]
- 31.Hoogland P V, Welker E, Van der Loos H, Wouterlood F G. In: Cellular Thalamic Mechanisms. Bentivoglio M, Spreafico R, editors; Bentivoglio M, Spreafico R, editors. Amsterdam: Elsevier; 1988. pp. 152–162. [Google Scholar]
- 32.Georgopoulos A P. Annu Rev Neurosci. 1986;9:147–170. doi: 10.1146/annurev.ne.09.030186.001051. [DOI] [PubMed] [Google Scholar]