Abstract
Loss of functional p53 paradoxically results in either increased or decreased resistance to chemotherapeutic drugs. The inconsistent relationship between p53 status and drug sensitivity may reflect p53’s selective regulation of genes important to cytotoxic response of chemotherapeutic agents. We reasoned that the discrepant effects of p53 on chemotherapeutic cytotoxicity is due to p53-dependent regulation of the multidrug resistance gene (MDR1) expression in tumors that normally express MDR1. To test the hypothesis that wild-type p53 regulates the endogenous mdr1 gene we stably introduced a trans-dominant negative (TDN) p53 into rodent H35 hepatoma cells that express P-glycoprotein (Pgp) and have wild-type p53. Levels of Pgp and mdr1a mRNA were markedly elevated in cells expressing TDN p53 and were linked to impaired p53 function (both transactivation and transrepression) in these cells. Enhanced mdr1a gene expression in the TDN p53 cells was not secondary to mdr1 gene amplification and Pgp was functional as demonstrated by the decreased uptake of vinblastine. Cytotoxicity assays revealed that the TDN p53 cell lines were selectively insensitive to Pgp substrates. Sensitivity was restored by the Pgp inhibitor reserpine, demonstrating that only drug retention was the basis for loss of drug sensitivity. Similar findings were evident in human LS180 colon carcinoma cells engineered to overexpress TDN p53. Therefore, the p53 inactivation seen in cancers likely leads to selective resistance to chemotherapeutic agents because of up-regulation of MDR1 expression.
The emergence of drug resistance poses a major impediment to the success of cancer chemotherapy. Drug resistance can be acquired by tumor cells via many routes, including alterations in transport, drug targets, metabolism and/or genes regulating cell survival. The most common alteration in drug transport is increased expression of the MDR1 gene¶ that encodes P-glycoprotein (PGP), an energy-dependent anti-cancer drug efflux pump. Increases in PGP are largely responsible for the emergence of multidrug-resistant cells from cells resistant to a single agent. In vivo PGP frequently increases in some tumors following relapse after chemotherapy (1). The human MDR1 gene also is highly expressed in some tumors not previously treated with chemotherapy, but this is limited to tumors derived from tissues that normally express substantial levels of PGP, including the colon and liver. Although high constitutive levels of PGP may contribute to the intrinsic broad-spectrum drug resistance observed in these cancers, it is possible that alterations during tumorigenesis (e.g., dominant oncogenes or tumor suppressors; ref. 2) also up-regulate PGP. For example, in experimental models Pgp increases during tumor progression (3), but it is unclear which factors regulate these changes.
The most frequent alteration in human malignancies is deletion or mutation of the p53 gene. p53 is a nuclear phosphoprotein and is a tumor suppressor whose inactivation, either through mutation, selective interaction with cellular MDM2 or viral oncogene products, or alteration in subcellular localization, is strongly correlated with human cancer (4, 5). Wild-type p53 induces the transcription of a number of downstream targets, including GADD45 (6), MDM2 (7), cyclin G (8, 9), and p21 (WAF1/CIP1) (7) with up-regulation of p21 linked to cell cycle arrest (7). However, wild-type p53 also represses the transcription of some genes (10–13), and this function has been correlated with the ability of p53 to induce apoptosis (14). Loss of p53 repression functions results in decreased susceptibility to apoptotic stimuli. Indeed, mutations in p53 correlate with chemotherapeutic resistance (15–17) and relapse in p53-expressing tumors (18) and the absence of p53 in fibroblasts from p53 nullizygous mice is associated with resistance to chemotherapeutic agents such as etoposide, adriamycin, and 5-fluorouracil (19). Superficially this would suggest that p53 status (i.e., wild type or mutant) would predict sensitivity to chemotherapeutic agents. However, reports also link p53 inactivation with enhanced chemosensitivity of some tumors (20–22), thus complicating the selection of the most suitable chemotherapeutic regimen based on p53 status.
We hypothesized that the heretofore unpredictable relationship between p53 and drug sensitivity might be explained by tissue-specific effects of p53 on MDR1 gene expression. Overexpression of MDR1 could result in the selective resistance to drugs that are transported by this membrane pump (e.g., vinblastine, etoposide, taxol, etc.), but not to other chemotherapeutic agents that are not Pgp substrates (e.g., methotrexate, 5-fluorouracil). The MDR1 promoter can be affected by p53 (11, 12), as can many other promoters (23), in transient transfection analysis, yet p53’s effect on the regulation of the endogenous MDR1 gene, particularly in tissues that express significant levels of MDR1 such as liver and colon is unknown. We hypothesized that wild-type p53 represses endogenous MDR1 gene expression and that the effects of loss of functional p53 on the spectrum of drug sensitivity is, in part, determined by its selective tissue-specific affects on MDR1. In support of this concept, this study shows that rat H35 hepatoma cell lines engineered to overexpress trans-dominant negative (TDN) p53 and having impaired p53-mediated transactivation and transrepression, have markedly elevated levels of mdr1 mRNA and Pgp protein, and this increased Pgp conferred resistance specifically to drugs that are Pgp substrates. Furthermore, expression of MDR1 also is elevated by TDN p53 in human LS180 colon carcinoma cells, suggesting that p53 typically represses MDR1 and that loss of p53 in tissues that normally express MDR1 will lead to a predominant resistance to PGP substrates.
MATERIALS AND METHODS
Stable Transfection of TDN p53 into H35 and LS180 Cells.
H35 Reuber hepatoma cells (American Type Culture Collection CRL 1600) (24) were transfected with either TDN p53 or the cytomegalovirus (CMV)-Neo-Bam vector by calcium phosphate precipitation (24), and individual clones were selected in medium containing 600 μg/ml G418. LS180 cells expressing TDN p53 were selected similarly with 300 μg/ml G418.
Transient Transfections and Reporter Assays.
H35 or Saos-2 cells (obtained from Jeff Sample, St. Jude Children’s Research Hospital, Memphis) were transfected by calcium phosphate coprecipitation (24). The cells were harvested, and luciferase assays were performed as described (24). The luciferase activity was normalized to the amount of protein in the lysate. We were unable to normalize to β-galactosidase or chloramphenicol acetyltransferase activities as p53 represses the traditional viral promoters that drive expression of these reporters (13). The MDR1 reporter (−137/+30-LUC) was amplified by PCR from a human MDR1 promoter template (−4.7 kb to +286) (provided by M. Goldsmith and K. Cowan, National Institutes of Health, Bethesda, MD) and cloned into the BglII site of pGl2-basic (Promega). The reporter construct containing consensus p53 elements, p50–2 (25), and the wild-type p53 expression plasmid p11–4 (26) have been described.
RNA Isolation and Slot-Blot Analysis of mdr1a and EI24 mRNA in Stable Transfectants.
Total RNA was isolated from each cell line, and slot-blot analysis was performed on 2 and 10 μg of total RNA (24). The blots sequentially were hybridized with the the following DNA probes: pgp/mdr1a, the following anti-sense oligonucleotide (5′-AAA ATA TTT AAC ATC TCG CAT GGT CAC AGT-3′), and EI24, a 2.2-kb murine EI24 cDNA fragment from pKSEI24 (generously provided by Tom Chittenden, Cambridge, MA; ref. 27). For quantification, the blots were exposed to PhosphorImagers (Molecular Dynamics), and band intensities were quantified by the Image Quant software (Molecular Dynamics).
Western Immunoblot Analysis of Pgp in Membrane Lysates and p53 in Extracts from H35 Cells.
Total cell lysates from each cell line were analyzed for Pgp and thymidylate synthase expression (24, 28), and the proteins were quantified by densitometry. For analysis of TDN p53, cells were lysed in RIPA buffer (50 mM Tris, pH 7.4/150 mM NaCl/0.1% SDS/1% Nonidet P-40/0.5% sodium deoxycholate/100 μg/ml phenylmethysulfonyl fluoride/1 μg/ml aprotinin). Equal amounts of protein were run on SDS/PAGE gels, transferred to nitrocellulose membranes, and developed with a polyclonal antibody (Ab-7) (Oncogene Science) that recognizes both mutant and wild-type p53.
PCR Amplification and Sequence Analysis of p53 from H35 Cells.
Total RNA was isolated from logarithmically growing H35 cells. Amplification was performed on 250 ng of first-strand cDNA using the specific rat p53 primers that span nucleotides 263–287 (5′-CGT GGC CCC TGC TTC AGC TAC ACC G-3′) and nucleotides 1,012–1,036 (5′-CAT CTC GAA GCG CTC ACG CCC ACG GAT-3′). These oligonucleotides amplify a 773-bp rat p53 gene cDNA fragment that spans the middle of exon 4 through exon 10 and will not amplify the reported p53 processed pseudogene (29). Four independent PCR reaction products were cloned into the PCRII vector (Invitrogen) using the TA cloning system. Four individual clones from each PCR reaction were sequenced and found to be identical to the published rat p53 cDNA (GenBank accession no. X13058).
Short-Term Drug Cytotoxicity Assays.
Freshly attached cells were cultured for 48 hr in the presence of vinblastine, VM-26, actinomycin D, methotrexate, carboplatin, or 5-fluorodeoxyuridine. After this interval, aliquots of medium were sampled. The medium then was aspirated and the remaining attached cells were lysed. Lactate dehydrogenase (LDH) activity was measured in the medium and cell lysate by using a Cytotoxicity Assay kit and following the manufacturer’s instructions (Boehringer Mannheim). The proportion of LDH released into the medium as a fraction of the total LDH then was determined (30).
Long-Term Clonogenic Survival Assay.
Five hundred cells of each line were plated on 10-cm Petri dishes and exposed to 50 nM vinblastine for 2 weeks. Colonies formed were stained by incubation with 0.5% crystal violet, washed in deionized water, and photographed, and colonies were counted using an Artek Model 880 counter (Artek, Farmingdale, NY).
RESULTS
TDN p53 Abolishes p53-Mediated Transrepression of the MDR Promoter.
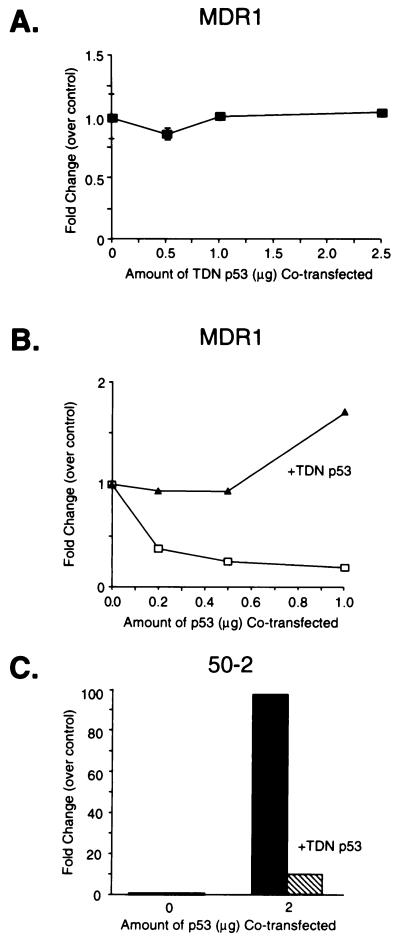
We first determined that our genetically engineered mutant human p53 (TDN p53) with amino acid substitutions at codons 14 (Leu to Gln) and 19 (Phe to Ser) (that impair p53 transactivation (31)) and codon 281 (Asp to Gly) (that eliminates p53 from interacting with its cognate p53 DNA binding site; ref. 25) was functionally inactive with respect to transactivation and transrepression. Cotransfection of various amounts of TDN p53 into p53 negative Saos-2 cells demonstrated that TDN p53 neither activated nor repressed the human MDR1 promoter (−137/+30-LUC) (Fig. 1A). We next evaluated whether TDN p53 could affect p53 transrepression in these cells (Fig. 1B). Transfected wild-type p53 repressed the MDR1 promoter (Fig. 1B), a finding consistent with previous studies (11, 12), whereas cotransfected TDN p53 relieved wild-type p53 repression of the MDR1 promoter. Further studies with a plasmid containing p53 consensus sites (p50–2) revealed that TDN p53 could severely attenuate transactivation mediated by wild-type p53 (Fig. 1C). Thus TDN p53 can block p53 transrepression and transactivation.
Figure 1.
TDN p53 abolishes p53-mediated transactivation and transrepression. (A) p53 null SAOS-2 osteosarcoma cells were transiently transfected with MDR1 (5 μg) and cotransfected with various amounts of TDN p53. (B) The MDR1 plasmid (5 μg) was cotransfected with either no p53 expression vector or a p53 expression vector (p11–4) in the presence of either 2.5 μg of CMV-Neo-Bam or TDN p53. (C) The p50–2Luc plasmid (5 μg) was transfected with either no p53 expression vector or cotransfected with the p53 expression (2.0 μg) plasmid in the absence or presence of TDN p53 (2.5 μg). The cells then were harvested, and luciferase activity was determined.
H35 Cells Stably Transfected with TDN p53 Have Impaired p53 Function.
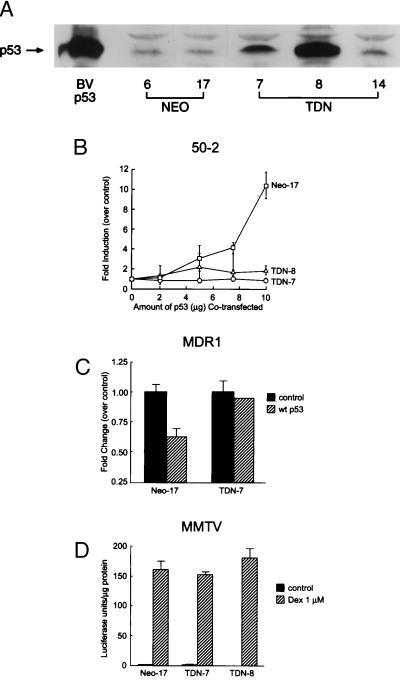
To test the hypothesis that inactivation of wild-type p53 can affect expression of the endogenous mdr1 gene we chose the H35 rat hepatoma cell line that expresses a significant level of functional Pgp (24). The H35 cells express functional wild-type p53 as assessed by sequence analysis, electromobility shift assay, supershifts with p53 antibody, and γ-irradiation induction in these cells of the p53 target and regulator MDM2 (data not shown). Transient transfection demonstrated that TDN p53 interfered with p53-mediated transrepression of the MDR1 promoter in H35 cells similar to Saos-2 cells (not shown). H35 cells were stably transfected with TDN p53 or with the backbone vector, CMV-Neo-Bam and G418 resistant clones were selected. TDN p53 clones and CMV-Neo-Bam (Neo) clones were isolated, expanded, and characterized for p53 expression by immunoblot analysis (Fig. 2A). Clones expressing high (TDN-8), intermediate (TDN-7), and modest (TDN-14) levels of exogenous p53 were chosen for analysis.
Figure 2.
TDN p53 expression in H35 hepatoma cells specifically impairs p53-mediated transactivation and transrepression. (A) Total cell lysates from Neo-6, Neo-17, TDN-7, TDN-8, and TDN-14 were analyzed by immunoblot analysis with anti-p53 antibody. Baculovirus (BVp53)-expressed murine p53 (25) was run in parallel. (B) Transactivation of p50–2 in the Neo-17 versus the TDN cell lines was measured by cotransfection of various amounts of a wild-type p53 expression plasmid along with p50–2 (10 μg). (C) Transrepression by wild-type p53 was evaluated in Neo-17 and TDN-7 cells transfected with MDR1 (5 μg) and empty vector, or cotransfected with a wild-type p53 expression vector. (D) Glucocorticoid transactivation was evaluated in Neo-17, TDN-7, and TDN-8 cells transfected with mouse mammary tumor virus-Luc (10 μg), a glucocorticoid-responsive promoter (48) in cells with or without dexamethasone (1 μM) for 24 hr. The cells were harvested, and luciferase activity was determined. The error bars indicate the average and SD of 3–4 separate experiments each performed in duplicate.
To establish that the TDN p53 was functional in the TDN cells, we compared the ability of wild-type p53 to transactivate and transrepress in TDN versus Neo clones. Cotransfection of Neo control cell lines with the p53-responsive p50–2 reporter and wild-type p53 induced a dose-dependent increase in luciferase activity (Fig. 2B). By contrast, transfected wild-type p53 was unable to transactivate the p53 responsive reporter p50–2 in either TDN-7 or TDN-8 cells. To evaluate whether TDN cells were also refractory to wild-type p53-mediated repression of MDR1, TDN p53 and Neo clones were cotransfected with the MDR1 promoter and the wild-type p53 expression vector (Fig. 2C). Activity of the MDR1 reporter in Neo cells was readily repressed by wild-type p53, whereas cells expressing TDN p53 were refractory to wild-type p53-mediated repression. Therefore, H35 hepatoma cells that express the TDN p53 are impaired in both wild-type p53 transactivation and transrepression functions. To rule out the possibility that the TDN clones selected had generalized defects in transactivation capabilities we tested whether dexamethasone induced the mouse mammary tumor virus (MMTV) promoter in Neo, TDN-7, and TDN-8 cell lines. We found dexamethasone was equally effective in activating MMTV-Luc in all of these clones (Fig. 2D).
Loss of p53 Function in Hepatoma Cells Up-Regulates mdr1a Gene Expression.
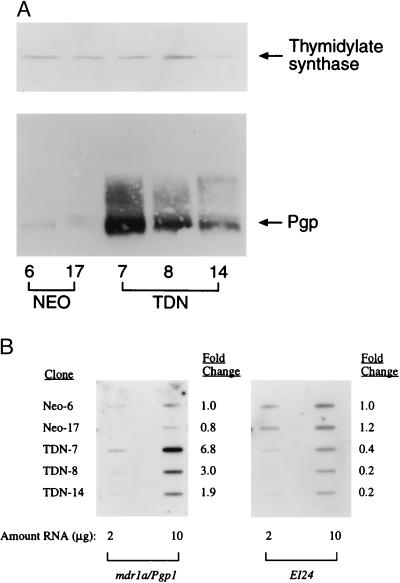
To evaluate whether functional inactivation of p53 leads to changes in endogenous Pgp we prepared cellular lysates from the Neo and TDN cell lines. Immunoblot analysis demonstrated that Pgp levels were increased in TDN-7 (>30-fold), TDN-8 (15-fold), and TDN-14 (4-fold), whereas Neo clones exhibited little variation in Pgp expression (Fig. 3A). The expression of thymidylate synthase was no different between the Neo and TDN cell lines, suggesting the increase in Pgp is not a general change in drug targets. Because increased Pgp expression could result from posttranslational or pretranslational effects we evaluated mdr1 mRNA expression by slot-blot analysis using rodent-specific mdr1a or mdr1b oligonucleotides (32). Mdr1a is most closely related to human MDR1 and its mRNA levels increased 2- to 7-fold in the TDN-7, TDN-8, and TDN-14 cells (Fig. 3B). By contrast, mdr1b mRNA levels were not increased in TDN versus Neo cells (data not shown). Increased mdr1 mRNA and Pgp expression sometimes are linked to amplification of the MDR gene, and p53 nullizygous mice have augmented rates of gene amplification (33). However, Southern blot analysis of genomic DNA isolated from early and/or late passage TDN-7 and TDN-8 cells failed to reveal any changes in mdr1 copy number (data not shown). To establish that the loss of endogenous p53 activity in TDN cells also was associated with interference of p53 regulation of an endogenous target we examined expression of the p53 target EI24 (27). Levels of EI24 were comparable in Neo cell lines, yet were markedly decreased in cells expressing TDN p53 (Fig. 3B). Therefore, expression of TDN p53 abrogates both endogenous p53-regulated pathways.
Figure 3.
Inactivation of wild-type p53 is associated with elevated levels of MDR1 gene expression. (A) Immunoblot analysis of Pgp and thymidylate synthase in total cell lysates from Neo-6, Neo-17, TDN-7, TDN-8, and TDN-14 was performed as described in Materials and Methods. (B) Total RNA (2 or 10 μg) isolated from Neo-6, Neo-17, TDN-7, TDN-8, and TDN-14 was slot-blotted and hybridized with a mdr1a-specific oligonucleotide as described in Materials and Methods. The blot was stripped and reprobed with a cDNA for EI24.
Because p53 causes changes in cellular growth properties it was possible that p53-mediated growth perturbations indirectly could alter mdr1 expression. To address this issue we measured the growth rates of our TDN and Neo cell lines (data not shown). Population doubling times of the TDN and Neo cell lines were almost indistinguishable, and cycle analysis of logarithmically growing cultures revealed that the Neo and the TDN cell lines had remarkably similar cell cycle distributions. Therefore, the large increases in mdr1a expression in TDN cell lines was not due to altered cell cycle kinetics or growth.
Increased Pgp in TDN p53-Expressing Cells Is Functional.
Because increases in immunoreactive Pgp do not strictly correspond to increases in functional protein (34) we assessed Pgp transport capabilities in TDN cells versus Neo controls. To address this issue we determined the cellular accumulation of [3H]vinblastine, a typical Pgp substrate (30). Whereas Neo control cells accumulated substantial vinblastine in a dose-dependent fashion, far less vinblastine accumulated in cells lacking functional p53 with the decreased vinblastine accumulation correlating with the amount of immunoreactive Pgp in the TDN-7 and TDN-8 cells (not shown).
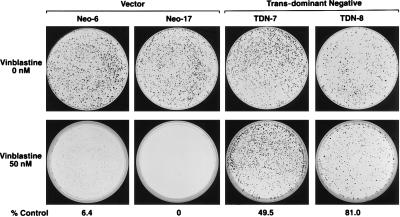
To determine if increased expression of Pgp facilitated the outgrowth of drug-resistant cells we performed a clonogenic assay (Fig. 4) and evaluated whether expression of TDN p53 leads to vinblastine resistance. Whereas the Neo cells had very few drug-resistant colonies the TDN p53 cells had large numbers of vinblastine-resistant colonies. Thus, inactivation of p53 facilitates the development of vinblastine-resistant cells.
Figure 4.
TDN p53-expressing cells are vinblastine resistant. Cells (500) from Neo-6, Neo-17, TDN-7, and TDN-8 were plated on 10-cm Petri dishes, and after attachment they were incubated with 50 nM vinblastine for 2 weeks. The incubation was terminated, and the colonies were stained with crystal violet and enumerated by counting.
Drug Resistance of Cells Lacking Functional p53 Is Linked to Pgp Substrates.
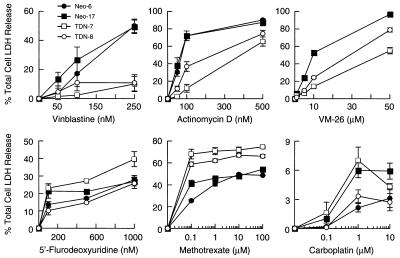
The decreased sensitivity to vinblastine in the long-term clonogenic survival assay could be due to the increased expression of Pgp in cells lacking functional p53, but it was also possible that apoptotic pathways generally were inactivated in these cells (19). One expectation would be that this would lead to a general resistance to a wide range of chemotherapeutic agents, including those that are not Pgp substrates. We therefore tested sensitivity of TDN and Neo cell lines to a variety of anti-tumor agents, including Pgp substrates (vinblastine, VM-26, and actinomycin D) and non-Pgp substrates [carboplatin, 5-fluorodeoxyuridine, and methotrexate (MTX)]. Drug cytotoxicity was assessed by measuring the proportion of total cellular LDH released into the medium after a 48-hr incubation with the indicated drugs (Fig. 5). Neo cell lines were more sensitive to all Pgp substrates tested compared with the TDN cell lines. In general, the TDN-8 cell line was more sensitive than the TDN-7 to these agents, a finding that corresponds with its lower amount of Pgp (Fig. 3 A and B). However, the decreased drug sensitivity of the TDN cell lines did not extend to all chemotherapeutic agents as these cells were equally sensitive to 5-fluorodeoxyuridine and more sensitive to MTX. Therefore, loss of function of p53 confers selective resistance to Pgp substrates.
Figure 5.
TDN p53 cells are selectively resistant to PGP substrates. Cells were plated at equivalent densities onto 60-mm Petri dishes and incubated with the indicated concentrations of drugs for 48 hr. After this interval the proportion of total cellular LDH released into the medium was determined as described in Materials and Methods. Values indicate the average of 2–3 independent experiments each performed in duplicate. The error bars represent the SEM.
Drug Resistance of TDN Cells Lacking Functional p53 Is Abolished by Inhibition of Pgp.
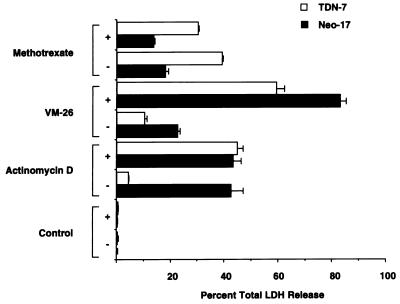
The increased resistance of TDN cell lines to actinomycin D, VM-26, and vinblastine could be due either to increased level of Pgp in these cells or may be secondary to effects of p53 on cellular targets of these drugs. We reasoned that Pgp’s role in decreased cytotoxicity could be confirmed by use of a defined inhibitor of Pgp transport and that this inhibitor would increase drug retention, and therefore cytotoxicity. Reserpine is a potent inhibitor of Pgp-mediated drug efflux and increases the intracellular retention of Pgp drug substrates (35). Addition of reserpine restored actinomycin D and VM-26 sensitivity to cells lacking functional p53. By contrast, MTX cytotoxicity was unaffected by addition of reserpine (Fig. 6). Therefore, up-regulation of mdr1a by loss of p53 function in TDN cells is required to impart resistance to Pgp substrates.
Figure 6.
The PGP inhibitor reserpine abolishes resistance of TDN p53 cells to Pgp substrates. Half of the cells were preincubated for 30 min with 10 μM reserpine (+), and then all of the cells were treated with either 100 nM actinomycin D, 10 μM VM-26, or 0.1 μM MTX for 48 hr. The proportion of LDH released into the medium was determined. Values are from one representative experiment with the range of duplicate values shown.
Loss of p53 Function Also Up-regulates MDR1 Gene Expression in Human LS180 Colon Carcinoma Cells.
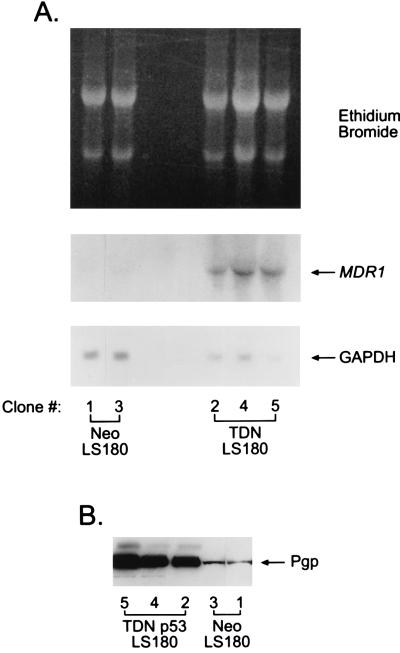
The LS180 human colon carcinoma cell line expresses MDR1 and is functionally wild type for p53 as demonstrated by G1 arrest after γ-irradiation (data not shown). We therefore evaluated whether TDN p53 also interfered with p53-mediated transactivation and transrepression in these cells by transient transfection of p50–2 and MDR1 promoter plasmids. As expected, TDN abrogated p53-mediated transactivation of p50–2 and transrepression of MDR1 (not shown). To determine whether TDN p53 could up-regulate MDR1 gene expression in the LS180 cells we stably transfected these cells with either the TDN p53 expression vector or CMV-Neo-Bam vector and isolated G418-resistant cell lines. All LS180 cells expressing TDN p53 revealed dramatic increases in the expression of MDR1 mRNA (Fig. 7A), and immunoblot analysis revealed a corresponding increase in PGP (Fig. 7B). The TDN LS180 cells were more resistant to vinblastine compared with the Neo cell lines (data not shown). Thus, like the rat hepatoma cell line, the TDN p53 results in increased expression of the MDR1 gene in human colon carcinoma cells.
Figure 7.
Inactivation of p53 in human LS180 cells induces expression of MDR1. (A) Northern blot analysis was performed on 25 μg of total RNA from each cell line. The membrane was probed sequentially with a cDNA fragment for human MDR1 (49) followed by a cDNA for glyceraldehyde 3-phosphate dehydrogenase (GAPDH). (B) Immunoblot analysis of PGP in total cell lysates from Neo-1, Neo-3, TDN-2, TDN-4, and TDN-5 was performed as described in Materials and Methods.
DISCUSSION
The data herein directly link changes in p53 status to regulation of the endogenous MDR1 gene and selective resistance to chemotherapeutic agents. A TDN form of p53 interfered with endogenous wild-type p53 function in both hepatoma and colon carcinoma cell lines, and this leads to impressive increases in Pgp. In rat hepatoma cells increases in immunoreactive Pgp corresponded to increases in the steady-state mdr1a mRNA, the rodent isoform that is most homologous to the human MDR1 (36), which was activated in human colon carcinoma cells by TDN p53. Although gene amplification is possible in p53 deficiency (33, 37), increases in Pgp gene expression by p53 inactivation were not secondary to either amplification of the mdr1 gene nor to alterations in the growth properties of these cells.
A number of criteria (e.g., transport and drug sensitivity) established that increased Pgp in TDN cells was functional and importantly led to selective resistance to Pgp substrates. Moreover, in contrast to other reports, inactivation of p53 does not lead to a generalized drug resistance, but rather causes selective resistance to Pgp substrates and increased sensitivity to other drugs (e.g., MTX). Although we have not explored the mechanistic basis for the increase in MTX sensitivity in the TDN cells, one might envision that p53 affects a gene that is important in MTX drug action, in particular, the ultimate target of MTX, dihydrofolate reductase (DHFR). DHFR is regulated by both growth and cell-cycle factors (38). The transcription factor Sp1 is important for DHFR transcription and interacts with p53 (38–40). Therefore, a change in p53 status could affect Sp1-mediated transcription of DHFR (38). This possibility is under investigation; however, other candidate genes important for MTX action also might be affected by p53 (e.g., folylpolyglutamate synthetase). Alternatively, the increased MTX sensitivity could be due to p53-induced alterations in nucleotide biosynthesis (41), a pathway known to be affected by MTX and important for MTX cytotoxicity (42).
Conflicting results correlating p53 status to chemosensitivity or chemoresistance (17, 19–22) have been attributed to tissue-specific differences in the p53-mediated chemotherapeutic response (43). Although these tissue-specific differences heretofore have been unclear, our results suggest that differences in p53-mediated cell death elicited by drugs that are MDR1 substrates (e.g., taxol, VP-16, and actinomycin D) may depend upon whether a cell expresses the MDR1 gene. However, it is also possible that p53 modulation of MDR1 depends on the integration of p53 signals with other signals known to affect MDR1 gene expression [e.g., raf-1 (ref. 44) or surface receptors (ref. 45)].
These findings have important implications with respect to cancer chemotherapy. Conditions that activate wild-type p53 (e.g., ionizing radiation, DNA damage, hypoxia, etc.) might be predicted to facilitate the chemotherapeutic elimination of Pgp-expressing tumors by suppressing MDR1 gene expression. By contrast, inactivation of p53 (e.g., cytoplasmic sequestration, viral inactivation, etc.) might be predicted to lead to an increase in the expression of the MDR1 gene and promote the survival of more drug-resistant tumors. Thus, based on this information more relevant strategies might be devised for eradicating MDR1 expressing tumors, and more judicious use of current strategies may decrease the outgrowth of multidrug-resistant tumors.
One expectation from our studies is that the mutational inactivation of p53 repression functions would lead not only to predicted increased tumorigenicity (46), but also to an exaggerated increase in MDR1 gene expression. The predicted increase in MDR1 expression in tumors could be secondary to both a loss of p53 repression of MDR1 and enhanced transactivation of MDR1 through mutant p53’s “gain of function” (47). p53’s gain of function facilitates tumor development and may further increase MDR1 gene expression by an undefined mechanism. Thus p53 mutation in cancers that express the MDR1 gene would be anticipated to produce highly multidrug-resistant and malignant tumors, in essence a “double whammy.”
Acknowledgments
We acknowledge the expert technical assistance of Amber Troutman, Drs. Dan Hua Pan and Xiaoping He, and the helpful comments of Dr. John Cleveland. This work was supported by National Institutes of Health Grants ES05851, ES04628, ES08658, and CA63230, National Institutes of Health/National Cancer Institute Cancer Center Support Grant CA21765, and the American Lebanese Syrian Associated Charities. J.V.T. was the recipient of a Glaxo-Wellcome Oncology Clinical Research Scholar Award for an abstract of this work at the 1997 American Association for Cancer Research meetings.
Footnotes
This paper was submitted directly (Track II) to the Proceedings Office.
Abbreviations: PGP, human P-glycoprotein; Pgp, rodent P-glycoprotein; TDN, trans-dominant negative; CMV, cytomegalovirus; LDH, lactate dehydrogenase; MTX, methotrexate.
MDR1 refers throughout to the human multidrug resistance gene or mRNA encoding the drug-transporting PGP protein, and mdr1a and mdr1b refer to the two drug-transporting rodent mdr1 genes or mRNA encoding Pgp.
References
- 1.Hartmann A, Blaszyk H, Kovach J S, Sommer S S. Trends Genet. 1997;13:27–33. doi: 10.1016/s0168-9525(96)10043-3. [DOI] [PubMed] [Google Scholar]
- 2.Ignatova T N, Beck W T. In: Multidrug Resistance in Cancer Cells. Gupta S, Tsuruo T, editors. Chichester: Wiley; 1997. pp. 177–192. [Google Scholar]
- 3.Bradley G, Sharma R, Rajalakshmi S, Ling V. Cancer Res. 1992;52:5154–5161. [PubMed] [Google Scholar]
- 4.Hollstein M, Sidransky D, Vogelstein B, Harris C C. Science. 1991;253:49–53. doi: 10.1126/science.1905840. [DOI] [PubMed] [Google Scholar]
- 5.Levine A J, Momand J, Finlay C A. Nature (London) 1991;351:453–456. doi: 10.1038/351453a0. [DOI] [PubMed] [Google Scholar]
- 6.Kastan M B, Zhan Q, El-Deiry W S, Carrier F, Jacks T, Walsh W V, Plunkett B S, Vogelstein B, Fornace A J., Jr Cell. 1992;71:587–597. doi: 10.1016/0092-8674(92)90593-2. [DOI] [PubMed] [Google Scholar]
- 7.El-Deiry W S, Tokino T, Velculescu V E, Levy D B, Parsons R, Trent J M, Lin D, Mercer W E, Kinzler K W, Vogelstein B. Cell. 1993;75:817–825. doi: 10.1016/0092-8674(93)90500-p. [DOI] [PubMed] [Google Scholar]
- 8.Zauberman A, Lupo A, Oren M. Oncogene. 1995;10:2361–2366. [PubMed] [Google Scholar]
- 9.Okamoto K, Beach D. EMBO J. 1994;13:4816–4822. doi: 10.1002/j.1460-2075.1994.tb06807.x. [DOI] [PMC free article] [PubMed] [Google Scholar]
- 10.Ginsberg D, Mechta F, Yaniv M, Oren M. Proc Natl Acad Sci USA. 1991;88:9979–9983. doi: 10.1073/pnas.88.22.9979. [DOI] [PMC free article] [PubMed] [Google Scholar]
- 11.Chin K-V, Ueda K, Pastan I, Gottesman M M. Science. 1992;255:459–462. doi: 10.1126/science.1346476. [DOI] [PubMed] [Google Scholar]
- 12.Zastawny R L, Salvino R, Chen J, Benchimol S, Ling V. Oncogene. 1993;8:1529–1535. [PubMed] [Google Scholar]
- 13.Subler M A, Martin D W, Deb S. J Virol. 1992;66:4757–4762. doi: 10.1128/jvi.66.8.4757-4762.1992. [DOI] [PMC free article] [PubMed] [Google Scholar]
- 14.Sabbatini P, Chiou S K, Rao L, White E. Mol Cell Biol. 1995;15:1060–1070. doi: 10.1128/mcb.15.2.1060. [DOI] [PMC free article] [PubMed] [Google Scholar]
- 15.Aas T, Borresen A-L, Geisler S, Smith-Sorensen B, Johnsen H, Varhaug J E, Akslen L A, Lonning P E. Nat Med. 1996;2:811–814. doi: 10.1038/nm0796-811. [DOI] [PubMed] [Google Scholar]
- 16.Perego P, Giarola M, Righetti S C, Supino R, Caserini C, Delia D, Pierotti M A, Miyashita T, Reed J C, Zunino F. Cancer Res. 1996;56:556–562. [PubMed] [Google Scholar]
- 17.Fan S, El-Diery W S, Bae I, Freeman J, Jondle D, Bhatia K, Fornace A J, Jr, Magrath I, Kohn K W, O’Connor P M. Cancer Res. 1994;54:5824–5830. [PubMed] [Google Scholar]
- 18.Lowe S W, Bodis S, McClatchey A, Remington L, Ruley H E, Fisher D E, Housman D E, Jacks T. Science. 1994;266:807–810. doi: 10.1126/science.7973635. [DOI] [PubMed] [Google Scholar]
- 19.Lowe S W, Ruley H E, Jacks T, Housman D E. Cell. 1993;74:957–967. doi: 10.1016/0092-8674(93)90719-7. [DOI] [PubMed] [Google Scholar]
- 20.Fan S, Smith M L, Rivet D J, II, Duba D, Zhan Q, Kohn K W, Fornace A J, Jr, O’Connor P M. Cancer Res. 1995;55:1649–1654. [PubMed] [Google Scholar]
- 21.Wahl A F, Donaldson K L, Fairchild C, Lee F Y F, Foster S A, Demers G W, Galloway D A. Nat Med. 1996;2:72–79. doi: 10.1038/nm0196-72. [DOI] [PubMed] [Google Scholar]
- 22.Hawkins D S, Demers G W, Galloway D A. Cancer Res. 1996;56:892–898. [PubMed] [Google Scholar]
- 23.Zambetti G P, Levine A J. FASEB J. 1993;7:855–865. doi: 10.1096/fasebj.7.10.8344485. [DOI] [PubMed] [Google Scholar]
- 24.Schuetz J D, Silverman J A, Thottassery J V, Furuya K N, Schuetz E G. Cell Growth Differ. 1995;6:1321–1332. [PubMed] [Google Scholar]
- 25.Zambetti G P, Bargonetti J, Walker K, Prives C, Levine A J. Genes Dev. 1992;6:1143–1152. doi: 10.1101/gad.6.7.1143. [DOI] [PubMed] [Google Scholar]
- 26.Tan T-H, Wallis J, Levine A J. J Virol. 1986;59:574–583. doi: 10.1128/jvi.59.3.574-583.1986. [DOI] [PMC free article] [PubMed] [Google Scholar]
- 27.Lehar S M, Nacht M, Jacks T, Vater C A, Chittenden T, Guild B C. Oncogene. 1996;12:1181–1187. [PubMed] [Google Scholar]
- 28.Matherly L H, Schuetz J D, Westin E, Goldman I D. Anal Biochem. 1989;182:338–345. doi: 10.1016/0003-2697(89)90605-2. [DOI] [PubMed] [Google Scholar]
- 29.Hulla J E. PCR Methods Appl. 1992;1:251–254. doi: 10.1101/gr.1.4.251. [DOI] [PubMed] [Google Scholar]
- 30.Schuetz J D, Schuetz E G. Cell Growth Differ. 1993;4:31–40. [PubMed] [Google Scholar]
- 31.Lin J, Chen J, Elenbaas B, Levine A J. Genes Dev. 1994;8:1235–1246. doi: 10.1101/gad.8.10.1235. [DOI] [PubMed] [Google Scholar]
- 32.Furuya K N, Gebhardt R, Schuetz E G, Schuetz J D. Biochim Biophys Acta. 1994;1219:636–644. doi: 10.1016/0167-4781(94)90222-4. [DOI] [PubMed] [Google Scholar]
- 33.Livingstone L R, White A, Sprouse J, Livanos E, Jacks T, Tlsty T D. Cell. 1992;70:923–935. doi: 10.1016/0092-8674(92)90243-6. [DOI] [PubMed] [Google Scholar]
- 34.Bates S E, Mickley L A, Chen Y-N, Richert N, Rudick J, Biedler J L, Fojo A T. Mol Cell Biol. 1989;9:4337–4344. doi: 10.1128/mcb.9.10.4337. [DOI] [PMC free article] [PubMed] [Google Scholar]
- 35.Pearce H L, Safa A R, Bach N J, Winter M A, Cirtain M C, Beck W T. Proc Natl Acad Sci USA. 1989;86:5128–5132. doi: 10.1073/pnas.86.13.5128. [DOI] [PMC free article] [PubMed] [Google Scholar]
- 36.Hsu S I, Lothstein L, Horwitz S B. J Biol Chem. 1989;264:12053–12062. [PubMed] [Google Scholar]
- 37.Yin Y, Tainsky M A, Bischoff F Z, Strong L C, Wahl G M. Cell. 1992;70:937–948. doi: 10.1016/0092-8674(92)90244-7. [DOI] [PubMed] [Google Scholar]
- 38.Slansky J E, Farnham P J. BioEssays. 1996;18:55–62. doi: 10.1002/bies.950180111. [DOI] [PubMed] [Google Scholar]
- 39.Gualberto A, Baldwin A S. J Biol Chem. 1995;270:19680–19683. doi: 10.1074/jbc.270.34.19680. [DOI] [PubMed] [Google Scholar]
- 40.Borellini F, Glazer R I. J Biol Chem. 1993;268:7923–7928. [PubMed] [Google Scholar]
- 41.Chernova O B, Chernov M V, Agarwal M L, Taylor W R, Stark G R. Trends Biochem Sci. 1995;20:431–434. doi: 10.1016/s0968-0004(00)89094-5. [DOI] [PubMed] [Google Scholar]
- 42.McGovren J P. In: Cancer Chemotherapy. Dorr R T, Von Hoff D D, editors. Norwalk, CT: Appleton & Lange; 1994. pp. 15–34. [Google Scholar]
- 43.Wu G S, El-Deiry W S. Nat Med. 1996;2:255–256. doi: 10.1038/nm0396-255a. [DOI] [PubMed] [Google Scholar]
- 44.Cornwell M M, Smith D E. J Biol Chem. 1993;268:15347–15350. [PubMed] [Google Scholar]
- 45.Furuya K N, Thottassery J V, Schuetz E G, Sharif M, Schuetz J D. J Biol Chem. 1997;272:11518–11525. doi: 10.1074/jbc.272.17.11518. [DOI] [PubMed] [Google Scholar]
- 46.Eliyahu D, Michalovitz D, Eliyahu S, Pinhasi-Kimhi O, Oren M. Proc Natl Acad Sci USA. 1989;86:8763–8767. doi: 10.1073/pnas.86.22.8763. [DOI] [PMC free article] [PubMed] [Google Scholar]
- 47.Dittmer D, Pati S, Zambetti G, Chu S, Teresky A K, Moore M, Finlay C, Levine A J. Nat Genet. 1993;4:42–46. doi: 10.1038/ng0593-42. [DOI] [PubMed] [Google Scholar]
- 48.Schuetz J D, Schuetz E G, Thottassery J V, Guzelian P S, Strom S, Sun D. Mol Pharmacol. 1996;49:63–72. [PubMed] [Google Scholar]
- 49.Fairchild C R, Ivy S P, Rushmore T, Lee G, Koo P, Goldsmith M E, Myers C E, Farber E, Cowan K H. Proc Natl Acad Sci USA. 1987;84:7701–7705. doi: 10.1073/pnas.84.21.7701. [DOI] [PMC free article] [PubMed] [Google Scholar]


