

Abstract
Cartilage contact geometry, along with joint loading, can play an important role in determining local articular cartilage tissue stress. Thus individual variations in cartilage thickness can be associated with both individual variations in joint loading associated with activities of daily living as well as individual differences in the anatomy of the contacting surfaces of the joint. The purpose of this study was to isolate the relationship between cartilage thickness predicted by individual variations in contact surface geometry based on the radii of the femur and tibia vs. cartilage thickness predicted by individual variations in joint loading. Knee magnetic resonance (MR) images and the peak knee adduction moments during walking were obtained from 11 young healthy male subjects (age 30.5±5.1 years). The cartilage thicknesses and surface radii of the femoral and tibial cartilage were measured in the weight bearing regions of the medial and lateral compartments of three-dimensional models from the MR images. The ratio of contact pressure between the medial and lateral compartments was calculated from the radii of tibiofemoral contact surface geometries. The results showed that the medial to lateral pressure ratios were not correlated with the medial to lateral cartilage thickness ratios. However, in general, pressure was higher in the lateral than medial compartments and cartilage was thicker in the lateral than medial compartments. The peak knee adduction moment showed a significant positive linear correlation with medial to lateral thickness ratio in both femur (R²=0.43, P<0.01) and tibia (R²=0.32, P<0.01). The results of this study suggest that the dynamics of walking is an important factor to describe individual differences in cartilage thickness for normal subjects.
Keywords: Cartilage thickness, Hertzian contact stress, Knee, Adduction moment
INTRODUCTION
The initiation and progression of osteoarthritis is commonly affected by mechanical factors related either to joint loading or local contact stress (Andriacchi, 2004). To understand the disease process, it is vital to understand the mechanical factors that influence the maintenance of healthy cartilage. Assuming cartilage thickness as a surrogate for cartilage health it appears there are numerous mechanical factors that influence cartilage health. For example, increased physical activity was positively associated with increased knee articular cartilage volume in a cross-sectional study (Jones, 2000) and a longitudinal study (Jones, 2003) of healthy children, implying that loading has a positive effect on the articular cartilage of healthy population. Similarly, larger muscle cross-sectional areas were positively associated with increased knee articular cartilage volumes in healthy subjects (Hudelmaier, 2003). More specifically mechanical loads during walking have been shown to have a positive influence on healthy cartilage (Andriacchi 2004).
At the local tissue level it has been suggested that bone and cartilage morphology are regulated by hydrostatic compressive stress and octahedral shear stress (Carter, 1988, Wong, 1990, Wong, 2003). During endochondral growth and ossification of bone rudiments, subchondral growth fronts under articular cartilage advance toward bone ends, forming the shape of the bone (Carter, 2001, Heegaard, 1999). Also, cartilage contact geometry, along with joint loading, can play an important role in determining local tissue stress (Han, 2005). Thus individual variation in cartilage thickness can be associated with both dynamic variations in joint loading as well as individual differences in the anatomy of the contacting surfaces of the joint. While a number of studies (Andriacchi 2004, Cicuttini, 2003, Hudelmaier, 2003, Jones 2000, Jones 2003) have suggested that global functional loads can influence cartilage thickness, the influence of the local contact geometry on cartilage thickness is not well understood. Yet understanding the influence of local contact geometry in cartilage thickness is an important consideration when evaluating the mechanical factors that influence cartilage health.
The influence of biological variations can be reduced by considering the load distribution between the medial and lateral compartments in the knee which can be predicted from the external knee adduction moment during walking which is the most frequent activity in life (Schipplein, 1991). Similarly the contact geometry between the medial and lateral compartments is substantially different. The distal femur has convex surfaces on both condyles, but the proximal tibia has a convex surface in the lateral plateau and a concave surface in the medial plateau (Kapandji, 1987). Thus, the different curvatures (radii) of the contacting surfaces in the two compartments should result in different contact mechanics and different mechanical stress environments in the cartilage. Using the adduction moment as a marker in this load distribution paradigm, one can address the question of the relative influence of local contact geometry versus global functional loads on cartilage health.
The purpose of this study was to test the isolated effect of contact surface geometry and the isolated effect of joint loading during walking on predicting cartilage thickness. We hypothesized (a) that medial to lateral thickness ratio in the knee would increase with increase of medial and lateral contact geometry differences in curvature at the contact surfaces since greater curvature differences would cause higher contact stresses and (b) that medial to lateral thickness ratio would increase with increase of peak knee adduction moment during walking.
METHODS
Bilateral knee magnetic resonance (MR) images were obtained from 11 young healthy adults with no history of knee injury. To reduce the confounding effects, only male subjects with body mass index (BMI) in healthy range and age between 20 and 40 were tested. Average age was 30.5 years (SD 5.1, range 23~40) and average BMI was 23.7 kg/m² (SD 1.7, range 20.1~26.5).
After IRB approval and informed consent were obtained high contrast MR images of the cartilage were obtained using a fat-suppressed three-dimensional (3D) spoiled gradient recalled echo (SPGR) sequence in sagittal plane with TR=60 ms, TE=5 ms, flip angle=40°, field of view 140×140 mm, slice thickness of 1.5 mm, 60 slices and matrix 256×256, and scan time 10:18 using a General Electric 1.5T clinical MR imaging scanner (GE Medical Systems, Milwaukee, WI) with a standard transmit-receive extremity coil. The fat-suppressed 3D SPGR sequence has been reported to be sensitive in detecting abnormalities of hyaline cartilage in the knee (Disler, 1995, Disler, 1997). With this sequence, cartilage appears brightest among soft tissues so that the cartilage boundary can be easily delineated from surrounding structures.
The femoral and tibial cartilage was segmented from each slice of the MR images using a B-Spline Snakes technique followed by manual corrections (Koo, 2005). The segmented femoral and tibial cartilage boundaries were combined and reconstructed into 3D surface models and thicknesses were calculated for each point on the cartilage surfaces using custom software (Koo, 2005). The reproducibility and accuracy of the software have been previously evaluated (Koo, 2005).
The weight bearing regions in the femoral and the tibial cartilage near full knee extension were identified manually for both the medial and lateral compartments (Figure 1 (a)). The weight bearing regions were close to the tibiofemoral contact regions at heel strike with high joint load (Andriacchi, 1994) and matched well with the thickest cartilage regions in each compartment (Koo, 2005, Li, 2005). For the femoral cartilage, the medial-lateral length of the weight bearing region in each compartment was 20% of the medial-lateral length of the femoral cartilage. The anterior-posterior length of the region was determined to include tibiofemoral contact region at heel strike and during the stance phase of normal walking (Koo, 2005). For the tibial cartilage, the thickest regions were in the middle of each plateau in the anterior-posterior direction. The size of the weight bearing region in each compartment of the tibial cartilage was 20% of anterior-posterior length and 20% of medial-lateral length of the tibial cartilage as shown in Figure 1a. The region was adjusted to include the thickest regions which were assumed to be the weight bearing regions at heel strike (Koo, 2005).
Figure 1.
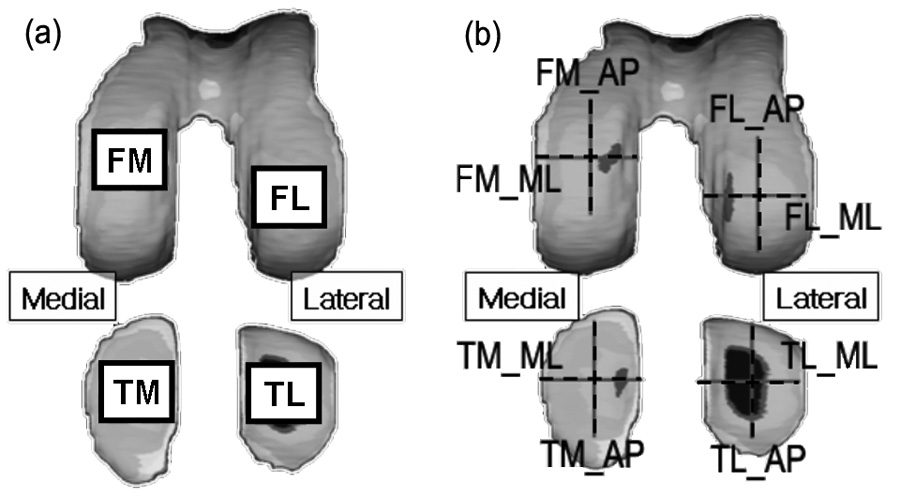
(a) Tibiofemoral weight bearing regions at full knee extension were manually identified. The regions matched well with the thickest regions in each compartment. (b) Articular surface radii were measured in anterior-posterior (AP) and medial-lateral (ML) directions at the center of each tibiofemoral weight bearing region. The acronyms represent femoral medial, femoral lateral, tibial medial and tibial lateral regions for FM, FL, TM and TL, respectively.
To quantify the difference of the contacting surface geometries between the medial and lateral compartments, the medial to lateral contact pressure ratio was calculated using elliptical Hertzian contact stress theory that allows the calculation of the maximum pressure in the two contacting bodies using surface curvatures in principal directions (Hamrock, 1983, Johnson, 1985). The articulating surfaces were modeled as two semi-ellipsoids in contact whose radii were rax and ray for body A and rbx and rby for body B in x and y-axes, respectively, with a force F acting on them. The direction of rolling motion was the x-axis. The simplified solution for the maximum pressure of the contact was adapted from Hamrock et al’s work (Hamrock 1983) and is summarized below.
| (1) |
| (2) |
| (3) |
The equations from (1) to (3) can be calculated from the radii of the semi-ellipsoids. By using the Rx and Ry in (1) and (2), which are called equivalent radii, the contact problem is redefined as a contact between two ellipsoids with the same radii of Rx and Ry.
| (4) |
The equation (4) is calculated from the material properties of the two contacting bodies, where υ is Poisson ratio and E is elastic modulus.
The maximum Hertzian contact pressure at the center of contact can be calculated from the following equation.
| (5) |
where Dx and Dy represent the diameters of the elliptical contact region along x and y directions, respectively. When Rx > Ry, which means that the long axis of the elliptical contact area is parallel to the direction of rolling motion, x-axis,
| (6) |
and when Ry > Rx,
| (7) |
In calculating (6) or (7), ellipticity parameter k which is defined as Dx / Dy and elliptical integral of the second ε kind in Dx and Dy should be calculated. In the classical Hertzian solution, it requires a solution to a transcendental equation relating k and complete elliptic integral of first and second kinds which can usually be obtained by iterative numerical procedures or from charts (Hamrock, 1983). Hamrock et al (Hamrock, 1983) used a curve fit and found a simple equation to obtain approximate values of k and ε.
The maximum pressure ratio under a unit load (Fmedial=Flateral) between the medial and lateral compartments can be calculated as shown below.
| (8) |
In (8), if we assume that the mechanical properties are the same for the cartilage in the medial and lateral compartments (E’medial = E’lateral), only ε, k and R, all of which are functions of the radii of contact surfaces, will be left in (8).
The contact pressure ratio was independent of mechanical properties of cartilage and loading conditions, and dependent solely on contacting surface curvatures. Articulating surface curvatures were measured along the anterior-posterior (AP), x-axis, and medial-lateral (ML) directions, y-axis, for each weight bearing region using commercial software (RapidForm Inc., Sunnyvale, CA) as shown in Figure 1b.
The same subjects underwent gait test at a self-selected normal walking speed. Knee adduction moment was calculated using the 6-marker link model and inverse dynamics (Andriacchi, 2004). The peak knee adduction moment was calculated from the knee adduction moment of the normal walking.
Linear regression analysis was used to examine the relationship between medial to lateral thickness ratios and medial to lateral maximum pressure ratios which were calculated purely based on contact surface geometries. Linear regression analysis was again applied between medial to lateral thickness ratios and peak knee adduction moments. To understand the relative effects of and interaction between the two variables on the cartilage thickness, multiple linear regression analysis was applied on the medial to lateral thickness ratios with independent variables of the medial to lateral pressure ratios and peak knee adduction moments as summarized in Figure 2.
Figure 2.

A summary of the data processing, measurements and statistical analyses
RESULTS
The local cartilage surface curvatures at the thickest regions of the four contact surfaces showed a consistent pattern among individuals. The femoral cartilage had convex surfaces in both the medial and lateral compartments in both AP and ML directions. The tibial cartilage had mostly concave surfaces, except for the AP direction in the lateral compartment.
Tibiofemoral contact surfaces conformed best (convex-concave surfaces contact with similar radii) in the ML direction in the medial compartment and worst (convex-convex surfaces contact) in the AP direction in the lateral compartment. In the lateral condyle of the femur, average curvatures (±SD) for the 11 subjects were 22±4 mm and 25±4 mm in AP and ML directions, respectively. In the medial condyle of the femur, average curvatures were 34±5 mm and 21±3 mm in AP and ML directions, respectively. In the lateral plateau of the tibia, average curvatures were 37±10 mm and −43±11 mm in AP and ML directions, respectively. Here, positive and negative values represent convex and concave surfaces, respectively. In the medial plateau of the tibia, average curvatures were −95±38 mm and −29±7 mm in AP and ML directions, respectively (Figure 3).
Figure 3.
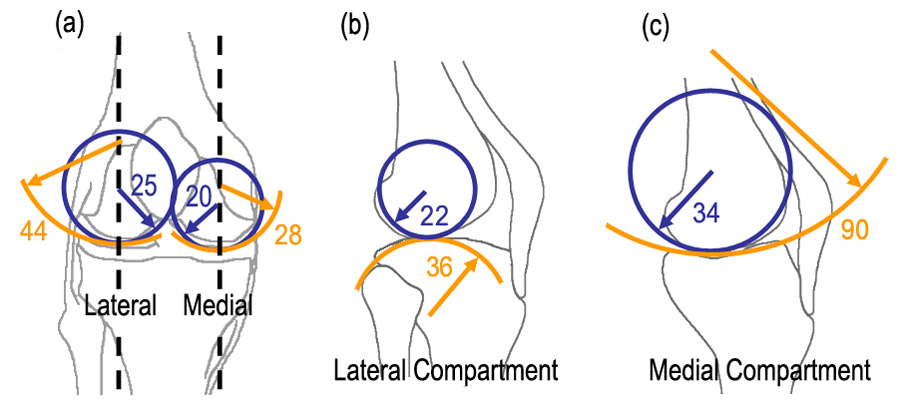
(a) Average radii in mm, of femoral and tibial cartilage in the medial-lateral (ML) direction (b,c) average radii of the femoral and tibial cartilage in anterior-posterior (AP) direction in the lateral and medial compartments.
There was no significant linear relationship between the medial to lateral thickness ratios and the medial to lateral contact surface geometry differences at the significance level of α=0.05. In general, pressure was higher in the lateral than medial compartments and cartilage was thicker in the lateral than medial compartments as shown in Figure 4.
Figure 4.

The medial to lateral thickness ratio was not associated with the medial to lateral pressure ratio in both femoral and tibial cartilage, but, in general, the cartilage was thicker in the lateral compartment and the pressure was higher also in the lateral compartment.
The peak knee adduction moment did predict the individual variability of the thickness ratios. The peak knee adduction moment showed a significant linear correlation with medial to lateral thickness ratio in both femur (R²=0.43, P<0.01) and tibia (R²=0.32, P<0.01) as shown in Figure 5.
Figure 5.

The medial to lateral thickness ratio was significantly associated with the peak knee adduction moment during walking in both femoral and tibial cartilage at the significance level of α=0.05.
According to the multiple linear regression analysis, adduction moment was still a strong factor to explain the individual variation in the medial to lateral thickness ratio, but the medial to lateral pressure ratio by geometry was not a significant factor at the significance level of α=0.05.
DISCUSSION
The first hypothesis on the relationship between the medial to lateral thickness ratio and the medial to lateral contact pressure ratio were not supported by the results. Individual variation in the medial to lateral thickness ratio was not predicted by contacting surface geometries; but all subjects had higher pressure in the lateral compartment and also had thicker cartilage in the lateral compartment. The second hypothesis on the relationship between the medial and lateral thickness ratio was supported by the results. The peak knee adduction moment could explain individual variation in the medial to lateral cartilage thickness ratio.
During normal walking, there is always a peak knee adduction moment; that is, dynamic load is higher in the medial than lateral compartments in the knee throughout the stance phase of walking (Andriacchi, 1994, Schipplein, 1991). The second result showed that individual differences in the relative thickness between the medial and lateral compartments can be explained by the individual differences in dynamic load. Although the dynamic load is higher in the medial compartment, articular cartilage is anatomically thicker in the lateral than medial compartment in both femur and tibia (Cicuttini, 2002, Eckstein, 2001, Jones, 2000, Li, 2005). The first result showed that the pressure is always higher in the lateral than medial compartments, and that may govern the cartilage thickness although it cannot explain individual differences.
In this study, it is assumed that cartilage thickness is influenced by local mechanical stress. The direct connection between local mechanical stress and cartilage thickness has not been reported in the literature, but computer simulation studies (Carter, 2001, Heegaard, 1999) and cell experimental studies (Smith, 1996, Smith, 2000, Smith, 2004) support these results. Heegaard et al. and Carter et al. suggested that cartilage growth and morphology is regulated by hydrostatic pressure and octahedral shear stress (Carter, 2001, Heegaard, 1999). Smith et al. showed that the chondrocyte metabolism varies according to the type of stresses and intermittent hydrostatic pressure increase type II collagen and aggrecan mRNA expression (Smith, 1996, Smith, 2000, Smith, 2004).
The results of this study suggest that the dynamics of walking is an important factor to describe individual differences in cartilage thickness for normal subjects. This is the first study, to our knowledge, that showed the in vivo functional loading during walking was more important than local contact geometries for predicting cartilage thickness in healthy cartilage. The observation is consistent with the association between in vivo dynamic knee loads and proximal tibial bone distribution shown in the literature (Hurwitz, 1998). These results also help explain why differences in the adduction moment could have a substantial influence on the variable rates of progression reported in patients with medial compartment knee osteoarthritis. The peak knee adduction moment during walking has been linked to the progression of knee osteoarthritis (Miyazaki, 2002) and the severity of the medial compartment osteoarthritis (Mündermann, 2004, Sharma, 1998).
The radii of the femoral medial surfaces were larger than the femoral lateral surface in the AP direction in this study. The maximum radius in the femoral lateral surface is actually larger than that in the femoral medial surface in AP direction (Kapandji, 1987). The radii vary along the contact surfaces, and the radii in this study were measured from local areas where cartilage contacts at near full knee extension.
Hertzian contact theory was adapted in this study to understand the effect of surface geometry on the mechanical stress in cartilage and the cartilage thickness. Hertzian contact theory simplifies contact problems with the assumptions that each body can be regarded as an elastic half-space, the contact region is relatively small and elliptical, and the contact surfaces are highly lubricated. Articular cartilage deformation can be regarded as a linear elastic deformation problem for the instantaneous contact during physiological motion such as walking (Carter, 2003). The deformation may not be large because the fluid inside cartilage may not move much during the high frequency motion. Articular cartilage has very low friction. As a first order approximation of the contact stress, Hertzian contact theory provides reasonable values. Nonetheless, there are still limitations in the Hertzian contact stress calculation. The tibiofemoral joint has complex rolling and sliding motion, and the contact regions may change throughout the stance phase of walking, which may require more complex mathematical formulation than Hertzian contact theory. We focused on the small regions on the medial and lateral compartments that undergo compression at near full knee extension, which also match well with the highest joint load during walking (Andriacchi, 1994).
Since the focus of the this study was to examine the relative influence local contact geometry vs dynamic variations in walking loads, the inclusion and exclusion criteria for subjects were designed to reduce the effects of confounding factors such as gender, age, BMI and biological difference in consideration of the small sample size. Also, to reduce the inter-subject variations in bone size and biological differences, the ratios of thicknesses, maximum pressures and joint forces between the medial and lateral compartments were used. Residual confounding also can arise from measurement errors such as cartilage thickness and curvature measurements in this study. So the regions of interest where the average cartilage thickness and cartilage curvatures were measured at were carefully chosen to focus on the weight bearing regions at heel strike. Further work will be required to validate extrapolating these results beyond the scope of the populations described in this study. However, the insight provided in this study is useful when considering the mechanical factors that influence the cartilage thickness.
In conclusion, for the population in this study the mechanical stress due to the geometries of the contact surfaces appears to influence the general thickness distribution in the medial and lateral compartments of the knee, and the individual differences in thickness distribution in the medial and lateral compartments seem to be influenced by individual differences in the dynamic loading of the knee during walking. These findings may help further identify the factors involved in maintenance of thick and healthy cartilage, and initiation and progression of osteoarthritis.
ACKNOWLEDGEMENTS
This study was funded by NIH R01 AR049792-04. We thank Chris Dyrby and John Kang for their help in data acquisition and processing.
Footnotes
Publisher's Disclaimer: This is a PDF file of an unedited manuscript that has been accepted for publication. As a service to our customers we are providing this early version of the manuscript. The manuscript will undergo copyediting, typesetting, and review of the resulting proof before it is published in its final citable form. Please note that during the production process errors may be discovered which could affect the content, and all legal disclaimers that apply to the journal pertain.
REFERENCES
- Andriacchi TP. Dynamics of knee malalignment. Orthopedic Clinics of North America. 1994;25:395–403. [PubMed] [Google Scholar]
- Andriacchi TP, Alexander EJ, Toney MK, Dyrby C, Sum J. A point cluster method for in vivo motion analysis: applied to a study of knee kinematics. Journal of Biomechanical Engineering. 1998;120:743–749. doi: 10.1115/1.2834888. [DOI] [PubMed] [Google Scholar]
- Andriacchi TP, Mündermann A, Smith RL, Alexander EJ, Dyrby CO, Koo S. A framework for the in vivo pathomechanics of osteoarthritis at the knee. Annals of Biomedical Engineering. 2004;32:447–457. doi: 10.1023/b:abme.0000017541.82498.37. [DOI] [PubMed] [Google Scholar]
- Carter DR, Orr TE, Fyhrie DP, Schurman DJ. Influences of mechanical stress on prenatal and postnatal skeletal development. Clinical Orthopaedics and Related Research. 1987;219:237–250. [PubMed] [Google Scholar]
- Carter DR, Wong M. The role of mechanical loading histories in the development of diarthrodial joints. Journal of Orthopaedic Research. 1988;6:804–816. doi: 10.1002/jor.1100060604. [DOI] [PubMed] [Google Scholar]
- Carter DR, Beaupre GS. Skeletal Function and Form. Cambridge University Press; 2001. [Google Scholar]
- Carter DR, Wong M. Modelling cartilage mechanobiology. Philosophical transactions of the Royal Society of London. Series B, Biological sciences. 2003;358:1461–1471. doi: 10.1098/rstb.2003.1346. [DOI] [PMC free article] [PubMed] [Google Scholar]
- Cicuttini FM, Wluka AE, Wang Y, Davis SR, Hankin J, Ebeling P. Compartment differences in knee cartilage volume in healthy adults. Journal of Rheumatology. 2002;29:554–556. [PubMed] [Google Scholar]
- Cicuttini FM, Wluka A, Bailey M, O'Sullivan R, Poon C, Yeung S, Ebeling PR. Factors affecting knee cartilage volume in healthy men. Rheumatology (Oxford) 2003;42:258–262. doi: 10.1093/rheumatology/keg073. [DOI] [PubMed] [Google Scholar]
- Disler DG, McCauley TR, Wirth CR, Fuchs MD. Detection of knee hyaline cartilage defects using fat-suppressed three-dimensional spoiled gradient-echo MR imaging: comparison with standard MR imaging and correlation with arthroscopy. American Journal of Roentgenology. 1995;165:377–382. doi: 10.2214/ajr.165.2.7618561. [DOI] [PubMed] [Google Scholar]
- Disler DG. Fat-suppressed three-dimensional spoiled gradient-recalled MR imaging: assessment of articular and physeal hyaline cartilage. American Journal of Roentgenology. 1997;169:1117–1123. doi: 10.2214/ajr.169.4.9308475. [DOI] [PubMed] [Google Scholar]
- Eckstein F, Winzheimer M, Westhoff J, Schnier M, Haubner M, Englmeier KH, Reiser M, Putz R. Quantitative relationships of normal cartilage volumes of the human knee joint--assessment by magnetic resonance imaging. Anatomy and Embryology. 197;197:383–390. doi: 10.1007/s004290050149. [DOI] [PubMed] [Google Scholar]
- Eckstein F, Winzheimer M, Hohe J, Englmeier KH, Reiser M. Interindividual variability and correlation among morphological parameters of knee joint cartilage plates: analysis with three-dimensional MR imaging. Osteoarthritis and Cartilage. 2001;9:101–111. doi: 10.1053/joca.2000.0365. [DOI] [PubMed] [Google Scholar]
- Hamrock BJ, Brewe D. Simplified solution for stresses and deformations. Transactions of the ASME. Journal of Lubrication Technology. 1983;105:171–177. [Google Scholar]
- Han SK, Federico S, Epstein M, Herzog W. An articular cartilage contact model based on real surface geometry. Journal of Biomechanics. 2005;38:179–184. doi: 10.1016/j.jbiomech.2004.03.010. [DOI] [PubMed] [Google Scholar]
- Heegaard JH, Beaupre GS, Carter DR. Mechanically modulated cartilage growth may regulate joint surface morphogenesis. Journal of Orthopaedic Research. 1999;17:509–517. doi: 10.1002/jor.1100170408. [DOI] [PubMed] [Google Scholar]
- Herzog W, Bending P. Mathematically indeterminate systems. In: Nigg BM, Herzog W, editors. Biomechanics of the Musculo-Skeletal System. John Wiley & Sons; 1999. pp. 533–545. [Google Scholar]
- Hudelmaier M, Glaser C, Englmeier KH, Reiser M, Putz R, Eckstein F. Correlation of knee-joint cartilage morphology with muscle cross-sectional areas vs. anthropometric variables. Anatomical Record Part A-Discoveries in Molecular Cellular and Evolutionary Biology. 2003;270A:175–184. doi: 10.1002/ar.a.10001. [DOI] [PubMed] [Google Scholar]
- Hurwitz DE, Sumner DR, Andriacchi TP, Sugar DA. Dynamic knee loads during gait predict proximal tibial bone distribution. Journal of Biomechanics. 1998;31:423–430. doi: 10.1016/s0021-9290(98)00028-1. [DOI] [PubMed] [Google Scholar]
- Johnson KL. Contact Mechanics. Cambridge University Press; 1985. [Google Scholar]
- Jones G, Glisson M, Hynes K, Cicuttini F. Sex and site differences in cartilage development: a possible explanation for variations in knee osteoarthritis in later life. Arthritis and Rheumatism. 2000;43:2543–2549. doi: 10.1002/1529-0131(200011)43:11<2543::AID-ANR23>3.0.CO;2-K. [DOI] [PubMed] [Google Scholar]
- Jones G, Ding C, Glisson M, Hynes K, Ma D, Cicuttini F. Knee articular cartilage development in children: a longitudinal study of the effect of sex, growth, body composition, and physical activity. Pediatric Research. 2003;54:230–236. doi: 10.1203/01.PDR.0000072781.93856.E6. [DOI] [PubMed] [Google Scholar]
- Kapandji IA. The Physiology of the Joints: Lower Limb, Volume 2 (Lower Limb) 5th ed. Churchill Livingstone; 1987. [Google Scholar]
- Koo S, Gold GE, Andriacchi TP. Considerations in measuring cartilage thickness using MRI: factors influencing reproducibility and accuracy. Osteoarthritis and Cartilage. 2005;13:782–789. doi: 10.1016/j.joca.2005.04.013. [DOI] [PubMed] [Google Scholar]
- Li G, Park SE, DeFrate LE, Schutzer ME, Ji L, Gill TJ, Rubash HE. The cartilage thickness distribution in the tibiofemoral joint and its correlation with cartilage-to-cartilage contact. Clinical Biomechanics. 2005;20:736–744. doi: 10.1016/j.clinbiomech.2005.04.001. [DOI] [PubMed] [Google Scholar]
- Miyazaki T, Wada M, Kawahara H, Sato M, Baba H, Shimada S. Dynamic load at baseline can predict radiographic disease progression in medial compartment knee osteoarthritis. Annals of the Rheumatic Diseases. 2002;61:617–622. doi: 10.1136/ard.61.7.617. [DOI] [PMC free article] [PubMed] [Google Scholar]
- Mündermann A, Dyrby CO, Hurwitz DE, Sharma L, Andriacchi TP. Potential strategies to reduce medial compartment loading in patients with knee osteoarthritis of varying severity: reduced walking speed. Arthritis and Rheumatism. 2004;50:1172–1178. doi: 10.1002/art.20132. [DOI] [PubMed] [Google Scholar]
- Schipplein OD, Andriacchi TP. Interaction between active and passive knee stabilizers during level walking. Journal of Orthopaedic Research. 1991;9:113–119. doi: 10.1002/jor.1100090114. [DOI] [PubMed] [Google Scholar]
- Sharma L, Hurwitz DE, Thonar EJ, Sum JA, Lenz ME, Dunlop DD, Schnitzer TJ, Kirwan-Mellis G, Andriacchi TP. Knee adduction moment, serum hyaluronan level, and disease severity in medial tibiofemoral osteoarthritis. Arthritis and Rheumatism. 1998;41:1233–1240. doi: 10.1002/1529-0131(199807)41:7<1233::AID-ART14>3.0.CO;2-L. [DOI] [PubMed] [Google Scholar]
- Sharma L, Kapoor D, Issa S. Epidemiology of osteoarthritis: an update. Current Opinion in Rheumatology. 2006;18:147–156. doi: 10.1097/01.bor.0000209426.84775.f8. [DOI] [PubMed] [Google Scholar]
- Smith RL, Rusk SF, Ellison BE, Wessells P, Tsuchiya K, Carter DR, Caler WE, Sandell LJ, Schurman DJ. In vitro stimulation of articular chondrocyte mRNA and extracellular matrix synthesis by hydrostatic pressure. Journal of Orthopaedic Research. 1996;14:53–60. doi: 10.1002/jor.1100140110. [DOI] [PubMed] [Google Scholar]
- Smith RL, Lin J, Trindade MCD, Shida J, Kajiyama G, Vu T, Hoffman AR, vanderMeulen MCH, Goodman SB, Schurman DJ, Carter DR. Time-dependent effects of intermittent hydrostatic pressure on articular chondrocyte type II collagen and aggrecan mRNA expression. Journal of Rehabilitation Research and Development. 2000;37:153–161. [PubMed] [Google Scholar]
- Stammberger T, Eckstein F, Englmeier KH, Reiser M. Determination of 3D cartilage thickness data from MR imaging: computational method and reproducibility in the living. Magnetic Resonance in Medicine. 1999;41:529–536. doi: 10.1002/(sici)1522-2594(199903)41:3<529::aid-mrm15>3.0.co;2-z. [DOI] [PubMed] [Google Scholar]
- Wong M, Carter DR. A theoretical model of endochondral ossification and bone architectural construction in long bone ontogeny. Anatomy and Embryology. 1990;181:523–532. doi: 10.1007/BF00174625. [DOI] [PubMed] [Google Scholar]
- Wong M, Carter DR. Articular cartilage functional histomorphology and mechanobiology: a research perspective. Bone. 2003;33:1–13. doi: 10.1016/s8756-3282(03)00083-8. [DOI] [PubMed] [Google Scholar]