

Abstract
Angiotensin II (Ang II)-induced renal injury is partly mediated by growth factors such as VEGF. We have previously shown that Ang II rapidly increases VEGF protein synthesis in proximal tubular epithelial (MCT) cells by augmenting mRNA translation, which is partly dependent on activation and binding of hnRNPK to 3′ untranslated region (UTR) of VEGF mRNA. Regulation of hnRNPK activation by PKCδ was studied in MCT cells. Transfection with a PKCδ siRNA inhibited hnRNPK Ser302 phosphorylation and activation, and reduced Ang II stimulation of VEGF synthesis. Inhibition of PKCδ with rottlerin also prevented binding of hnRNP K to VEGF mRNA and reduced the efficiency of VEGF mRNA translation. In db/db mice at 2 weeks of type 2 diabetes, VEGF expression was increased, which was due not to increase in transcription but to augmented translation of VEGF mRNA. Augmented VEGF expression was associated with increased binding of hnRNP K to VEGF mRNA. c-src and PKCδ activities and hnRNPK phosphorylation on Ser302 in renal cortex of db/db mice were increased compared to control mice. We conclude: Ang II induced VEGF mRNA translation is associated with activation of hnRNPK in MCT cells. In the signaling pathway leading to hnRNPK activation induced by Ang II, PKCδ is downstream of c-src. PKCδ-mediated phosphorylation of hnRNPK is required for Ang II stimulation of VEGF mRNA translation. In mice with type 2 diabetes, src and PKCδ activation and hnRNPK phosphorylation correlate with increased VEGF mRNA translation and kidney hypertrophy. 3′ UTR events are important in regulation of VEGF expression in models of renal injury.
Introduction
Angiotensin II is a mediator of renal injury in diabetic nephropathy and other chronic kidney diseases [1]. Treatment of proximal tubular epithelial cells (MCT cells) with 1 nM of angiotensin II (Ang II) stimulates synthesis of vascular endothelial growth factor (VEGF) through increased translation of its mRNA [2]. This was shown to be due to stimulation of cap-dependent translation initiation, which takes place at the 5′ untranslated region (UTR) of the mRNA [2]. Additional studies showed that VEGF mRNA translation was positively regulated by binding of heterogeneous ribonucleoprotein K (hnRNP K) to the 3′ UTR of the VEGF mRNA [3]. Activation of c-src by Ang II is critical to the binding of hnRNP K to VEGF mRNA, through phosphorylation of the latter on Ser302, which is a target of PKCδ [3].
There are six known tyrosine residues in hnRNP K that undergo phosphorylation by members of the c-src family [4]. Phosphorylation of hnRNP K on tyrosine residues by c-src is believed to generate several c-src homology domain 2 (SH2)-docking sites, which allow the protein to interact with various SH2-containing proteins, such as Lck and PKCδ. Although the tyrosine residues affected in hnRNP K lie outside the KH domains responsible for RNA binding, tyrosine phosphorylation of hnRNP K is generally considered to inhibit its binding to specific RNAs. For instance, Ostareck-Lederer et al. have shown that hnRNP K and the c-src kinase specifically interact with each other, leading to c-src-mediated tyrosine phosphorylation of hnRNP K in vivo and in vitro [4]. c-src-mediated phosphorylation reversibly inhibits the binding of hnRNP K to the differentiation control element (DICE) of the LOX mRNA 3′ untranslated region in vitro and specifically de-represses the translation of DICE-bearing mRNAs in vivo [4]. Similarly, Ostrowski et al have shown that hnRNP K protein is constitutively bound to many mRNAs in vivo, and that many hnRNP K-mRNA complexes are disrupted by tyrosine phosphorylation [5]. Interestingly, states of enhanced cell proliferation were associated with increased levels of hnRNP K tyrosine phosphorylation [6].
There are four serine residues in hnRNPK that undergo phosphorylation by extracellular signal-regulated kinase (ERK), c-Jun N terminal kinase (JNK), and members of the protein kinase C (PKC) family. It has been shown that serine phosphorylation of hnRNP K is RNA- and DNA-dependent, i.e., RNA- or DNA-bound hnRNP K is a preferred substrate for protein kinases [7]. Serine phosphorylation of hnRNP K is believed to alter its intracellular distribution, leading to cytoplasmic accumulation [8, 9]. Phosphorylation of hnRNP K by ERK also leads to inhibition of mRNA translation [8].
hnRNP K has been shown to act as a docking platform that allows Lck, a member of the c-src family, to interact with a member of another kinase cascade, PKCδ to control the activity of a translation eukaryotic elongation factor, eEF1A (EF-1α) [4, 5, 7, 10]. While bound to RNA, hnRNP K is prevented from direct interaction with PKCδ [10]. The binding of Lck to hnRNP K enhances its activity resulting in phosphorylation of hnRNP K on additional tyrosine residues, causing dissociation of hnRNP K protein from RNA [4, 5] and allowing the recruitment of PKCδ [10]. Following binding, the DAG-primed PKCδ is further induced through tyrosine phosphorylation by the activated Lck docked next to it [10]. Activated PKCδ not only targets Ser302 on hnRNP K [10] but also phosphorylates effectors either bound to K protein or present in its microenvironment through imposed proximity. EF-1α binds hnRNP K [11] and is a substrate of PKCδ [12]. Therefore, PKCδ-mediated phosphorylation of EF-1α could occur in the context of hnRNP K, and contribute to the activation of the translational machine.
Although the importance of hnRNP K phosphorylation by PKCδ has been established [3, 10], the functional consequences of phosphorylation of hnRNP K by PKCδ are not known. Also unknown is whether similar association between hnRNP K and PKCdelta occurs in vivo in the kidney in a disease state. In this study, we sought to investigate the role of PKCδ-mediated phosphorylation of hnRNP K in the regulation of VEGF mRNA translation by Ang II in MCT cells and assess the association between the two proteins in vivo in the kidney tissue of mice with type 2 diabetes.
Materials & Methods
Cell Culture
SV40-immortalized murine proximal tubular epithelial cells (MCT) were provided by Dr. Eric Neilson, Vanderbilt University, Nashville, TN. MCT cells in culture express in vivo characteristics of proximal tubular epithelial cells. [13]. The cells were grown in Dulbecco’s minimal essential medium (DMEM) containing 5 mM glucose and 10% FBS [2, 3]. Confluent monolayers of cells were serum-deprived in DMEM for 18 h before treatment.
Animal experiments
C57BLKsJ lepr−/− db/db mice and their lean littermate controls (db/m) were purchased from Jackson Lab (Bar Harbor, ME). The db/db mice develop kidney disease related to type 2 diabetes resembling human disease, i.e., hypertrophy, extracellular matrix accumulation and albuminuria [14, 15]. Experiments were initiated at 2 weeks following the appearance of hyperglycemia in db/db mice, when the mice are approximately 8–10 weeks old. Blood glucose was measured by an Accucheck instrument (Bayer Diagnostics, NY). Kidney weight and blood glucose levels were measured at the time of sacrifice. The Institutional Animal Care and Use Committee of the University of Texas Health Science Center at San Antonio approved these studies.
Transfection experiments were carried out using Superfect transfection reagent (Qiagen, Valencia, CA), according to the manufacturer’s instructions using 100 nM siRNA per well in 6-well plates. PKCδ and c-src siRNAs were purchased from Santa Cruz Biotechnologies (Santa Cruz, CA).
Immunoblotting experiments were performed as previously described [3]. MCT cells or kidney cortices were homogenized in lysis buffer (50 mM Tris.HCl, pH 7.4, 150 mM KCl, 1 mM EDTA, 50 mM β-glycerophosphate, 0.1 mM sodium orthovanadate, 1 mM EGTA, 0.5% Nonidet P40, and protease inhibitor mix [Sigma, St Louis, MO]). Protein concentration was measured and indicated amounts of homogenates were separated on SDS-PAGE, transferred to nitro-cellulose membranes and probed with various primary antibodies, and IRDye800- or IRDye700-coupled secondary antibodies were used for detection using Odyssey Infrared Imaging System (LiCor Biosciences, Lincoln, NE).
Immunoprecipitation experiments were carried out as previously described [3] on cell lysates or kidney homogenates to which relevant antibodies were added overnight at 4°C with rotation. Protein A/G agarose slurry was added for 1 h at 4°C with rotation. Agarose beads were pelleted and washed 3 times with lysis buffer and twice with PBS, and suspended in Laemmli sample buffer and boiled for 5 min.
Pull-down assays were performed as described in [3]. Polycytidylic acid-immobilized on cross-linked 4% beaded agarose (poly(C)-agarose [Sigma, St Louis, MO]) was added to an equal amount (500 μg protein) of cell lysates. After a 2-h incubation at 4°C with constant rotation, the agarose beads were extensively washed and suspended in Laemmli sample buffer and boiled for 5 min.
Association hnRNP K with VEGF mRNA
MCT cells or kidney cortices were homogenized in resuspension buffer containing: 10 mM Tris (pH 7.5), 250 mM KCl, and 2 mM MgCl2. After 5 min incubation on ice, 60 μl of a 10% Tween 80–5% deoxycholate mix was added to the lysate. Lysates were kept on ice for 15 min and centrifuged for 10 min at 14,000 rpm. The supernatants were used for immunoprecipitation using anti hnRNP K antibody as described above. RNA was extracted from pellets using TRIzol (Invitrogen, Carls-bad, CA). RT-PCR amplification of VEGF or GAPDH transcript was performed using the Superscript One-Step RT-PCR kit from Invitrogen (Carlsbad, CA) and employing the specific primers described in [2]. PCR products were analyzed by electrophoresis on agarose gel.
Polysome assay was performed as described in [3]. Samples (MCT cells or kidney cortices) were prepared as described above. The supernatants were laid on top of 15–40% sucrose gradient, and centrifuged for 90 min at 200,000 × g. After centrifugation, the gradients were separated into 4 fractions, from which RNA was extracted and used for RT-PCR, as described above. PCR products were analyzed by electrophoresis on agarose gel.
In-vitro kinase assays
PKCδ and c-src were immunoprecipitated from cell or kidney lysates as described above. Pelleted agarose beads were resuspended in kinase buffer containing 25 mM Tris.HCl (pH 7.4), 10 mM MgCl2, 25 mM β-glycerophosphate, 2 mM dithiotreitol, 0.1 mM sodium orthovanadate, 50 μM ATP and 5 μg myelin basic protein (MBP) for PKCδ. For c-src kinase assay, no exogenous substrate was added, as the kinase activity was assessed by c-src autophosphorylation. Reactions were carried out in the presence of 1 μCi of γ[32P]-ATP for 20 min at 30 °C, and stopped by the addition of Laemmli buffer and boiling for 5 min. An aliquot of reaction mixture was separated by electrophoresis. Radioactivity incorporated in MBP (for PKCδ) or in c-src was detected by autoradiography and quantified by densitometry.
Immunofluorescence microscopy
MCT cells were seeded in 4-well chamber slides. Semiconfluent cells were serum-starved for 18 h and treated with Ang II (1 nM) for the indicated times. Cells were washed with phosphate-buffered saline, fixed, and incubated with rabbit anti-PKCδ and mouse anti-hnRNPK antibody followed by staining with FLUOR-conjugated donkey anti-rabbit and Cy3-conjugated donkey anti-mouse secondary antibody (Chemicon International, Temecula, CA), respectively. The slides were visualized with a confocal laser microscopy system (Olympus Fluoview 500)
Statistics
Data from a minimum of three experiments were expressed as mean ± SEM and analyzed by ANOVA for comparison among multiple groups using Bonferroni post-test analysis (GraphPad Prizm®) and t-test for comparison between two groups; p < 0.05 was considered significant.
Results
Ang II stimulates PKCδ activity in MCT cells with a time-course corresponding to that of increased VEGF synthesis [3]. Phosphorylation of hnRNP K on Ser302, a known target of PKCδ [10], positively correlated with its binding to VEGF mRNA, and knockdown of hnRNP K expression by RNA interference significantly reduced Ang II stimulation of VEGF synthesis [3]. However, the requirement for PKCδ for either hnRNPK phosphorylation on Ser302 or for Ang II-induction of VEGF synthesis has not been explored. We investigated the role of PKCδ in Ang II stimulation of VEGF synthesis by RNA interference. MCT cells were transfected with control or PKCδ-specific siRNA 48 h before treatment with Ang II for 30 min. Figure 1 shows that Ang II stimulated VEGF synthesis in control siRNA-transfected cells (293 ± 37%, p < 0.001 vs con by ANOVA). This stimulation was attenuated in PKCδ-specific siRNA-transfected cells (194 ± 21%, p < 0.01 vs Ang II-control siRNA by ANOVA), but still significantly higher than in control cells transfected with control siRNA and not treated with Ang II (p < 0.01 by ANOVA). These data show that PKCδ contributes to Ang II stimulation of VEGF synthesis. Because we have previously shown that c-src is also required for VEGF synthesis, PKCδ activation and hnRNP K activation, hnRNP K could serve as a scaffold to bring together c-src and PKCδ.
Figure 1. Effect of PKCδ siRNA on Ang II stimulation of VEGF synthesis.

Immunoblots for VEGF, PKCδ and actin were carried out on lysates from MCT cells transfected with siRNA (control or specific for PKCδ, 100 nM each) for 48 h, and incubated with or without Ang II (1 nM) for 30 min. PKCδ immunoreactivity was measured to assess efficiency of RNA interference. The lower panel represents quantitation of 3 independent experiments, expressed as percent (mean ± se) of cells transfected with control siRNA and untreated. ** p < 0.01, *** p < 0.001 by ANOVA.
To study this possibility, we treated MCT cells with Ang II for up to 15 min, immunoprecipitated hnRNP K and measured presence of c-src and PKCδ in the immunoprecipitates. Figure 2A (top panel) shows that c-src association with hnRNP K was maximum after 1 min of treatment with Ang II (205.0 ± 10% of control, p < 0.001 by ANOVA) and decreased thereafter. Figure 2A (middle panel) shows that PKCδ association with hnRNP K was evident after 2 min and was sustained for at least 15 min (161.0 ± 13.1% of control, p < 0.001 by ANOVA). These data suggest that hnRNP K serves as a scaffold that brings together c-src and PKCδ as they are activated by Ang II. Association between c-src and PKCδ could not be detected by immunoprecipitation/immunoblot experiment (data not shown), indicating that either this association is weak and disrupted by cell homogenization or that they interact only indirectly through hnRNP K or some other protein in the macromolecular complex containing hnRNPK.
Figure 2. c-src is required for PKCδ activation and association with hnRNP K.


A. c-src and PKCδ associate with hnRNP K. PKCδ and c-src immunoreactivity was measured in hnRNP K immunoprecipitates from MCT cells treated with Ang II for the indicated times. Note the presence of the immunoglobulin heavy chain (IgG-H) in the c-src immunoblot. The figure presents blots representative of 3 independent experiments. The lower panel represents quantitation of 3 independent experiments, expressed as percent (mean ± se) of total VEGF mRNA (in all 4 fractions). * p < 0.05, ** p < 0.01, *** p < 0.001 by ANOVA.
B. c-src inhibition prevents PKCδ association with hnRNP K. PKCδ immunopreactivity was measured in hnRNP K immunoprecipitates from MCT cells preincubated with PP2 for 30 min before treatment with Ang II (1 nM) for 5 and 15 min. The figure presents blots representative of 3 independent experiments. The lower panel represents quantitation of 3 independent experiments, expressed as percent (mean ± se) of total VEGF mRNA (in all 4 fractions). * p < 0.05, ** p < 0.01 by ANOVA.
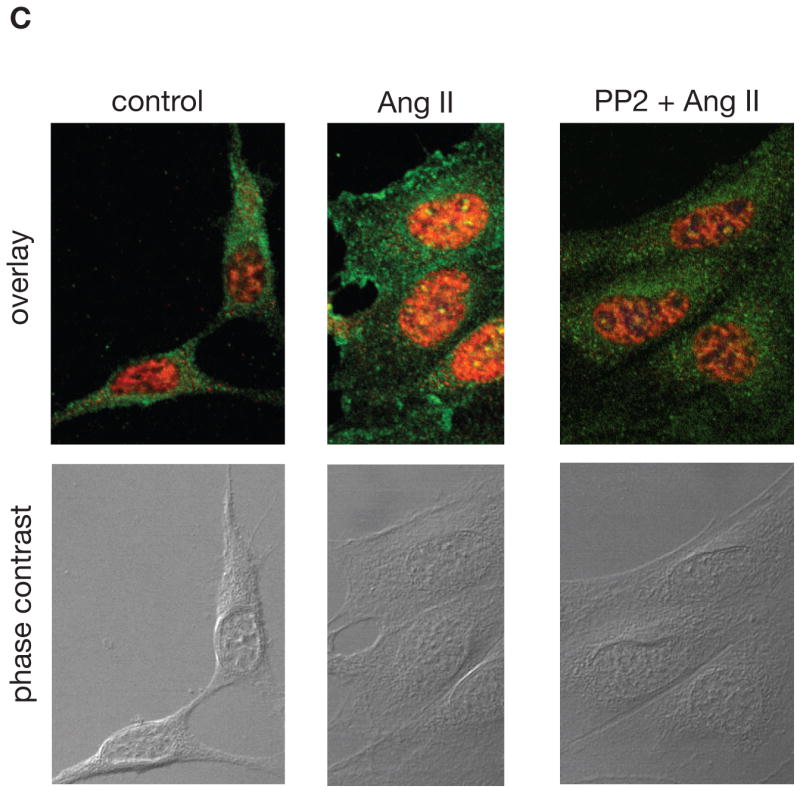
C. hnRNP K and PKCδ colocalize in the nucleus of MCT cells treated with Ang II. MCT cells were seeded in 4-well chamber slides. Quiescent cells were treated with 1 nM Ang II for 15 min in the absence or presence of PP2. PKCδ was detected with FLUOR-conjugated antibody (green) and hnRNPK with Cy3-conjugated antibody (red). Orange and yellow colors represent weak and strong co-localization, respectively. Phase contrast was used to visualize the cells. Shown are pictures representative from two independent experiments.
D. c-src inhibition prevents PKCδ tyrosine phosphorylation. Immunoblots for phospho-Tyr311-PKCδ, PKCδ and actin were carried out on lysates from MCT cells transfected with siRNA (control or specific for c-src) for 24 h, and incubated with or without Ang II (1 nM) for 15 min. C-src immunoreactivity was measured to assess efficiency of RNA interference. The lower panel represents quantitation of 3 independent experiments, expressed as percent (mean ± se) of cells transfected with control siRNA and untreated. ** p < 0.01, ns - not significant by ANOVA.
As we have previously shown that c-src is required for PKCδ activation by Ang II in MCT cells [3], we investigated the possibility that c-src activity is required for PKCδ forming a macro-molecular complex with hnRNP K. Quiescent MCT cells were pre-treated with 5 μM PP2, a specific inhibitor of c-src, before treatment with Ang II for 5 and 15 min. Association of PKCδ and hnRNP K was evaluated by tandem immunoprecipitation and immunoblot assays. Figure 2B shows that Ang II-induced hnRNP K/PKCδ complex formation was prevented by PP2, indicating that c-src activity is required for PKCδ association to hnRNP K in Ang II-treated cells.
We next examined the subcellular localization of hnRNP K and PKCδ in MCT cells by immunofluorescence. Figure 2C shows that in untreated cells, hnRNP K (red signal) is present in the nucleus and in discrete spots in the cytoplasm, and PKCδ (green signal) is cytoplasmic. After a 15 minute incubation with 1 nM Ang II, a fraction of PKCδ translocates to the plasma membrane and into the nucleus where it colocalizes with hnRNP K (orange signal). A strong colocalization is observed in discrete spots inside the nucleus (yellow signal). Pre-incubation with PP2 prevented both the membrane and the nuclear translocation of PKCδ and its colocalization with hnRNP K. Together, these data indicate that the interaction between hnRNP K and PKCδ occurs in the nucleus.
We investigated the mechanism of PKCδ activation by c-src. Previous studies have shown that Tyr311, located near the hinge region of PKCδ, is a target of members of the c-src family of tyrosine kinases and that phosphorylation of this site leads to activation of PKCδ [16, 17]. Figure 2D shows that Ang II stimulated phosphorylation of PKCδ on Tyr311 at 15 minutes in cells transfected with a control siRNA but failed to do so in cells transfected with a siRNA specific for c-src, in which c-src expression was reduced by 65%. These data show that c-src phosphorylates PKCδ on Tyr311 and activates it.
Having explored the role of c-src, we next evaluated that of PKCδ in Ang II-induction of VEGF synthesis by RNA interference. MCT cells were transfected with siRNA (control or specific for PKCδ) 48 h before a 15 min treatment with 1 nM Ang II. hnRNP K activation was measured by its binding to poly(C)-agarose. Transfection of MCT cells with a siRNA specific for PKCδ, but not a control siRNA, reduced its expression by ~80% (Fig. 3A, third panel, lanes 3–4 vs 1–2). Ang II activated hnRNP K (245% of control, p < 0.01 by ANOVA) in cells transfected with a control siRNA but not in cells transfected with a siRNA specific for PKCδ (107% of control, ns by ANOVA). We next determined whether PKCδ, which is required for hnRNP K activation, plays a role in recruitment of hnRNP K to VEGF mRNA. Quiescent MCT cells were pretreated with 5 μM röttlerin, a specific inhibitor of PKCδ [18], before treatment with Ang II for 30 min. RNA was extracted from hnRNP K immunoprecipitates and used for RT-PCR using primers specific for murine VEGF and GAPDH mRNAs. Figure 3B shows that Ang II increased recruitment of hnRNP K to VEGF mRNA, that was prevented by röttlerin. Together, these data show that PKCδ is required for hnRNP K activation and binding to VEGF mRNA.
Figure 3. PKCδ is required for hnRNP K activation and binding to VEGF mRNA and regulates VEGF mRNA translation.


A. PKCδ and hnRNP K activation. Poly(C)-agarose pull-down assay was carried out on lysates from MCT cells transfected with siRNA (control or specific for PKCδ) for 24 h, and incubated with or without Ang II (1 nM) for 30 min. PKCδ and hnRNP K immunoreactivity was measured in cell lysates to assess efficiency of RNA interference and total amount of hnRNP K, respectively. The lower panel represents quantitation of 3 independent experiments, expressed as percent (mean ± se) of cells transfected with control siRNA and untreated. ** p < 0.01, ns - not significant by ANOVA. B. hnRNP K binding to VEGF mRNA. Presence of VEGF mRNA in hnRNP K immunoprecipitates from MCT cells pre-treated with röttlerin (10 μM, 30 min) before treatment with Ang II (1 nM) for 30 min was assessed by RT-PCR. The lower panel represents quantitation of 3 independent experiments, expressed as percent (mean ± se) of untreated cells. ** p < 0.01 by ANOVA. C. PKCδ and VEGF mRNA translation. Polysome assay was performed on lysates from MCT cells treated with Ang II with or without pre-incubation with röttlerin. The lower panel represents quantitation of 3 independent experiments, expressed as percent (mean ± se) of total VEGF mRNA (in all 4 fractions). ** p < 0.01 by ANOVA.
Binding of hnRNP K to VEGF mRNA plays a regulatory role in the stimulation of VEGF mRNA translation by Ang II [3]. Since PKCδ is required for recruitment of hnRNP K to VEGF mRNA, we studied the role of PKCδ in VEGF mRNA translation. Polysome assay was performed on MCT cells treated with Ang II for 30 min, with or without pre-incubation with 5 μM röttlerin. Figure 3C shows that in untreated cells, VEGF mRNA is present throughout the sucrose gradient and that treatment with Ang II provoked a shift in the distribution of VEGF mRNA toward the heaviest sucrose fractions (#3–4) that contain the polysomes. Pre-treatment with röttlerin induced a partial reversal of that shift. These data indicate that inhibition of PKCδ decreases the efficiency of VEGF mRNA translation, but does not totally inhibit it.
We next sought confirmation of in vitro studies in a rodent model of type 2 diabetes, because Ang II is a prime mediator of kidney injury in diabetes [19]. We studied the db/db mice, a commonly employed animal model of type 2 diabetes [14, 15], at 2 weeks after onset of hyperglycemia. These mice demonstrated severe hyperglycemia and significant kidney hypertrophy, accompanied with increased VEGF expression [20]. We measured VEGF expression at the protein level by immunoblot and at the mRNA level by RT-PCR. Figure 4A shows that VEGF protein expression is significantly increased in the kidney cortex from db/db mice (188 ± 18% of db/m, p < 0.01 by t-test); however, VEGF mRNA level was unchanged in these kidney cortices (108 ± 5% of db/m, not significant by t-test). These data show that at this time point in evolution of type 2 diabetes in db/db mice the increase in VEGF expression is not due to increased transcription of the vegf gene but could be due to increased translation of its mRNA. To test this hypothesis, we performed polysome assay on kidney cortex from db/m and db/db mice. Figure 4B shows that in kidney cortex from db/m mice, VEGF mRNA is equally distributed in all sucrose fractions (~25% of total in each fraction), but in the kidney cortex from db/db mice, VEGF mRNA is present only in the heaviest sucrose fractions that contain the polysomes (~50% of total in fractions # 3–4). In contrast, the distribution of GAPDH mRNA was not changed in kidney cortex from db/db mice as compared to the control db/m mice. These data provide strong evidence for increased translation of VEGF mRNA in kidney cortex in early phase of type 2 diabetes. Next, we examined recruitment of hnRNP K to VEGF mRNA, because it participates in VEGF mRNA translation in MCT cells [3]. hnRNP K was immunoprecipitated from the same amount of kidney cortex of db/m and db/db mice. RNA was extracted from these immunoprecipitates and used for RT-PCR using primers specific for murine VEGF and GAPDH. Figure 4C shows that hnRNP K binds to VEGF mRNA in non-diabetic db/m animals, and that this binding significantly increased in the kidney cortex from db/db mice (295 ± 40% of db/m, p < 0.05 by t-test). Together, these data suggest that hnRNP K binding to VEGF mRNA could participate in increased translation in diabetic kidney cortices.
Figure 4. VEGF synthesis in diabetic kidneys.


A. VEGF expression. VEGF protein expression was measured by immunoblot on kidney cortex homogenates, and VEGF mRNA expression was measured by RT-PCR on RNA extracted from kidney cortex from control (db/m) and diabetic (db/db) mice. The lower panel represents quantitation of data obtained on kidney cortices from 5 individual mice, expressed as percent (mean ± se) of db/m mice. ** p < 0.01 by t-test. B. VEGF mRNA translation. Polysome assay was performed on homogenates of kidney cortex from control (db/m) and diabetic (db/db) mice. The lower panel represents quantitation of 3 independent experiments, expressed as percent (mean ± se) of total VEGF mRNA (in all 4 fractions). ** p < 0.01 by ANOVA. C. hnRNP K binding to VEGF mRNA. Presence of VEGF mRNA in hnRNP K immunoprecipitates from kidney cortex from control (db/m) and diabetic (db/db) mice was assessed by RT-PCR. The lower panel represents quantitation of data obtained on 5 individual mice, expressed as percent (mean ± se) of db/m mice. * p < 0.05 by t-test.
As hnRNP K is activated by c-src and PKCδ, we measured their activity by immunokinase assay in kidney cortices. PKCδ and c-src were sequentially immunoprecipitated from the same kidney cortex homogenates. PKCδ activity was measured using MBP as an exogenous substrate and c-src activity was measured using autophoshorylation of the kinase. Figure 5A shows that PKCδ activity was significantly higher in kidney cortex from diabetic mice (175 ± 4% of db/m, p < 0.01 by t-test). Figure 5B shows that c-src activity was higher in the kidney cortex from db/db mice (178 ± 9% of db/m, p < 0.01 by t-test).
Figure 5. signaling pathway leading to hnRNP K activation in diabetic kidneys.


The lower panels represent quantitation of data obtained on 5 individual mice for each group, expressed as percent (mean ± se) of db/m mice. * p < 0.05, ** p < 0.01 by t-test. A. PKCδ activity was measured by an in vitro kinase assay, using MBP as a substrate in kidney cortex homogenates. Total PKCδ in the corresponding lysates was measured by immunoblot. Incorporation of [32P]-ATP into MBP was measured by autoradiography and quantitated by densitometry. B. c-src activity was measured by an in vitro kinase assay in the same kidney cortex homogenates used in Fig. 5A. Total c-src in the corresponding lysates was measured by immunoblot. c-src autophosphorylation was measured by autoradiography and quantitated by densitometry. C. Phosphorylation of PKCδ on Tyr311 was assessed by immunoprecipitation of PKCδ followed by immunoblot using an antibody specific for phospho-Tyr311. D. Association of PKCδ with hnRNP K was assessed by immunoprecipitation of PKCδ from kidney cortex homogenates followed by immunoblot for hnRNP K. E. Phosphorylation of hnRNP K on Ser302 was assessed by immunoprecipitation of hnRNP K from kidney cortex homogenates followed by immunoblot with an antibody specific for phospho-Ser302.
We next examined phosphorylation of PKCδ on Tyr311 in kidney cortices by immunoprecipitation of PKCδ followed by immunoblot with an antibody specific for PKCδ phosphorylated on Tyr311. Figure 5C shows that phosphorylation of this residue was weak in control kidney and was markedly increased in diabetic kidneys (198 ± 5% of db/m, p < 0.01 by t-test). This suggests that increased PKCδ activity in diabetic renal cortex is due to c-src-dependent phosphorylation of Tyr311.
Recruitment of PKCδ to hnRNP K was assessed by immunoprecipitation of PKCδ follwed by immunoblot for hnRNP K. Figure 5D shows that PKCδ was associated with hnRNP K in control kidneys and that this association was significantly increased in diabetic kidneys (160 ± 14% of db/m, p < 0.05 by t-test). Finally, we assessed PKCδ-dependent phosphorylation of hnRNP K in renal cortex by measuring the amount of phosphorylated Ser302 in hnRNP K immunoprecipitates. Figure 5E shows that hnRNP K was basally phosphorylated on Ser302 in control kidneys and that this phosphorylation was significantly increased in diabetic kidneys (185 ± 14% of db/m, p < 0.01 by t-test). Together, these data suggest that the c-src-PKCδ-hnRNP K signaling pathway is activated in the kidney cortex from db/db mice 2 weeks after onset of hyperglycemia.
Discussion
Our data demonstrate the following: (1) Inhibition of PKCδ expression reduces Ang II stimulation of VEGF synthesis, similar to inhibition of hnRNP K expression. (2) hnRNP K recruits both c-src and PKCδ activated by Ang II that allows phosphorylation and activation of PKCδ by c-src. (3) PKCδ, in turn, phosphorylates and activates hnRNP K, allowing its binding to VEGF mRNA (4) Following Ang II stimulation, both hnRNP K binding to VEGF mRNA and its translation are PKCδ dependent. (5) In kidney cortex from mice at 2 weeks type 2 diabetes, VEGF synthesis is increased, due to increased translation of its mRNA, that is paralleled by increased binding of hnRNP K to VEGF mRNA. (6) c-src and PKCδ activities are increased in diabetic kidneys, leading to phosphorylation of hnRNP K. Our data demonstrate that PKCδ positively regulates VEGF mRNA translation through activation of hnRNP K.
Activation of PKCδ by Ang II
The involvement of PKCδ in Ang II signaling is complex. In vascular smooth muscle cells, PKCδ contributes positively to Ang II signaling. Through AT1 receptor Ang II activates PKCδ which in turns activates JAK2 [21], PKD [22], PAK1 [23] and the Rho-ROCK axis [24], all of which are involved in vascular remodeling. In hepatic C9 cells, Ang II activation of ERK is dependent on c-src and PKCδ [25]. However, role of PKCδ in Ang II signaling is cell-specific. For instance, in cardiomyocytes and myocardium, however, PKCδ exerts a negative effect on Ang II signaling: in these cells and tissue, Ang II stimulates production of CTGF through activation of PKCα, PKCε and PKCζ whereas PKCδ exerts a tonic inhibition of this effect, keeping connective tissue growth factor (CTGF) expression moderate [26]. In neurons in culture, the effect of PKCδ in Ang II signaling depends on the physiologic status: in normoxic conditions, Ang II activates PKCδ which does not induce DNA fragmentation; however, treatment of hypoxic neurons with Ang II results in activation and limited proteolysis of PKCδ which then induces DNA fragmentation [27]. To our knowledge, this is the first report of activation of PKCδ by Ang II in renal epithelial cells.
Mechanisms of PKCδ activation
PKCδ is unique among PKC isoforms in that it can be activated by tyrosine phosphorylation in the absence of diacylglycerol (DAG) production [16]. Phosphorylation of Tyr311 located in the hinge region of PKCδ is mediated by members of the c-src family [16], and induces a conformational change in the enzyme similar to the one induced by DAG binding. In hydrogen peroxide-treated cardio-myocytes, PKCδ phosphorylated on Tyr311 accumulates in both soluble and particulate fraction [16] and exhibits lipid-independent kinase activity [28]. In this instance, PKCδ can be activated in the absence of membrane translocation. As Ang II can activate other PKC isoforms (such as PKCβ) through increased DAG production [29], and PKCδ can be activated by DAG [30], it appears that Ang II could activate PKCδ in two independent ways: through increased DAG production which would lead to membrane translocation and through phosphorylation of Tyr311, without membrane translocation. As subcellular localization of activated PKCδ is very important in determining its substrate specificity [28], this could lead to PKCδ phosphorylating two different sets of substrates after activation by Ang II.
Activation of PKCδ in diabetes and hyperglycemic conditions
Activation of PKCδ, measured by translocation into membrane fraction, is significantly increased in diabetic glomeruli, that is prevented by the antioxidant taurine [31], suggesting that oxidative stress is an activator of PKCδ in vivo in diabetic kidneys.
The role of different PKC isoforms in diabetic nephropathy has been studied using specific knockout mice. Study of PKCα-null mice showed that this isoform plays a role in up-regulation of VEGF and its receptor in diabetic glomeruli, as well as later development of albuminuria [32]. Study of PKCβII-null mice has shown that this isoform is involved in renal fibrosis in diabetic kidneys, as increased expression of TGF-β1 and CTGF, as well as extracellular matrix proteins induced by diabetes were significantly reduced in the glomeruli of these mice as compared with their wild-type littermates. This was due to reduced oxidative stress [33]. In addition, the administration of a specific and selective PKCβ inhibitor, ruboxistaurin was able to prevent both mesangial expansion and basement membrane thickening in diabetic db/db mice [34]. Ruboxistaurin has also been shown to ameliorate diabetic nephropathy in human subjects [35]. PKCδ knockout mice have been generated and are viable; they exhibit an expansion of the B-lymphocyte population with formation of numerous germinal centers but no obvious kidney abnormalities have been reported [36]. However, studies have suggested that PKCδ may be important in diabetic nephropathy. In mesangial cells exposed to high glucose for 24 hours, total PKCδ expression is significantly increased [37], accompanied by increased activity [38]. In glomeruli from db/db mice studied after 2 weeks of hyperglycemia, there was a significant translocation of PKCδ in the membrane fraction, which was interpreted to reflect its activation [39]. In kidney cortices, made of both glomeruli and tubules, from db/db mice after 2 weeks of hyperglycemia, we did not detect increase in total amount of PKCδ but its activity was significantly increased as compared to kidney cortices from db/m mice (Figure 5A). We also found that PKCδ activation was paralleled by its phosphorylation on Tyr311, a residue targeted by c-src [3], but we haven’t ascertained that this phosphorylation activates PKCδ in vivo, as it does in MCT cells [3]).
Our data indicate that hnRNP K acts as a scaffold protein that binds both c-src and PKCd. c-src phosphorylates PKCδ on Tyr311 and activates it; activated PKCδ phosphorylates hnRNP K on Ser302, which promotes binding of hnRNP K to VEGF mRNA and stimulates its translation (Fig. 6).
Figure 6. sequential phosphorylation by c-src and PKCδ leads to hnRNP K activation.

basal state: minimal association of hnRNP K with c-src and PKCδ. 5 min treatment with Ang II: c-src binds hnRNP K and phosphorylates it; 15–30 min of stimulation: PKCδ binds to hnRNP K and is phosphorylated by c-src on Tyr311; activated PKCδ phosphorylates hnRNP K on Ser302, which promotes binding of hnRNP K to VEGF mRNA and stimulates its translation.
Together, these studies suggest that PKCδ could play a role in the pathogenesis of diabetic nephropathy. Our data show that such a role could be the regulation of VEGF synthesis, an important pathogenic factor in the development of long-term renal changes in type 2 diabetes [40].
Footnotes
Publisher's Disclaimer: This is a PDF file of an unedited manuscript that has been accepted for publication. As a service to our customers we are providing this early version of the manuscript. The manuscript will undergo copyediting, typesetting, and review of the resulting proof before it is published in its final citable form. Please note that during the production process errors may be discovered which could affect the content, and all legal disclaimers that apply to the journal pertain.
References
- 1.Rincon-Choles H, Kasinath BS, Gorin Y, Abboud HE. Kidney Int Suppl. 2002:8–11. doi: 10.1046/j.1523-1755.62.s82.3.x. [DOI] [PubMed] [Google Scholar]
- 2.Feliers D, Duraisamy S, Barnes JL, Ghosh-Choudhury G, Kasinath BS. Am J Physiol Renal Physiol. 2005;288:F521–529. doi: 10.1152/ajprenal.00271.2004. [DOI] [PubMed] [Google Scholar]
- 3.Feliers D, Lee MJ, Ghosh-Choudhury G, Bomsztyk K, Kasinath BS. Am J Physiol Renal Physiol. 2007;293:F607–615. doi: 10.1152/ajprenal.00497.2006. [DOI] [PubMed] [Google Scholar]
- 4.Ostareck-Lederer A, Ostareck DH, Cans C, Neubauer G, Bomsztyk K, Superti-Furga G, Hentze MW. Mol Cell Biol. 2002;22:4535–4543. doi: 10.1128/MCB.22.13.4535-4543.2002. [DOI] [PMC free article] [PubMed] [Google Scholar]
- 5.Ostrowski J, Schullery DS, Denisenko ON, Higaki Y, Watts J, Aebersold R, Stempka L, Gschwendt M, Bomsztyk K. J Biol Chem. 2000;275:3619–3628. doi: 10.1074/jbc.275.5.3619. [DOI] [PubMed] [Google Scholar]
- 6.Ostrowski J, Bomsztyk K. Br J Cancer. 2003;89:1493–1501. doi: 10.1038/sj.bjc.6601250. [DOI] [PMC free article] [PubMed] [Google Scholar]
- 7.Van Seuningen I, Ostrowski J, Bomsztyk K. Biochemistry. 1995;34:5644–5650. doi: 10.1021/bi00016a040. [DOI] [PubMed] [Google Scholar]
- 8.Habelhah H, Shah K, Huang L, Ostareck-Lederer A, Burlingame AL, Shokat KM, Hentze MW, Ronai Z. Nat Cell Biol. 2001;3:325–330. doi: 10.1038/35060131. [DOI] [PubMed] [Google Scholar]
- 9.Koffa MD, Kean J, Zachos G, Rice SA, Clements JB. J Virol. 2003;77:4315–4325. doi: 10.1128/JVI.77.7.4315-4325.2003. [DOI] [PMC free article] [PubMed] [Google Scholar]
- 10.Schullery DS, Ostrowski J, Denisenko ON, Stempka L, Shnyreva M, Suzuki H, Gschwendt M, Bomsztyk K. J Biol Chem. 1999;274:15101–15109. doi: 10.1074/jbc.274.21.15101. [DOI] [PubMed] [Google Scholar]
- 11.Bomsztyk K, Van Seuningen I, Suzuki H, Denisenko O, Ostrowski J. FEBS Lett. 1997;403:113–115. doi: 10.1016/s0014-5793(97)00041-0. [DOI] [PubMed] [Google Scholar]
- 12.Kielbassa K, Muller HJ, Meyer HE, Marks F, Gschwendt M. J Biol Chem. 1995;270:6156–6162. doi: 10.1074/jbc.270.11.6156. [DOI] [PubMed] [Google Scholar]
- 13.Haverty TP, Kelly CJ, Hines WH, Amenta PS, Watanabe M, Harper RA, Kefalides NA, Neilson EG. J Cell Biol. 1988;107:1359–1368. doi: 10.1083/jcb.107.4.1359. [DOI] [PMC free article] [PubMed] [Google Scholar]
- 14.Ha TS, Barnes JL, Stewart JL, Ko CW, Miner JH, Abrahamson DR, Sanes JR, Kasinath BS. J Am Soc Nephrol. 1999;10:1931–1939. doi: 10.1681/ASN.V1091931. [DOI] [PubMed] [Google Scholar]
- 15.Sharma K, McCue P, Dunn SR. Am J Physiol Renal Physiol. 2003;284:F1138–1144. doi: 10.1152/ajprenal.00315.2002. [DOI] [PubMed] [Google Scholar]
- 16.Konishi H, Yamauchi E, Taniguchi H, Yamamoto T, Matsuzaki H, Takemura Y, Ohmae K, Kikkawa U, Nishizuka Y. Proc Natl Acad Sci U S A. 2001;98:6587–6592. doi: 10.1073/pnas.111158798. [DOI] [PMC free article] [PubMed] [Google Scholar]
- 17.Lu W, Finnis S, Xiang C, Lee HK, Markowitz Y, Okhrimenko H, Brodie C. Biochem Biophys Res Commun. 2007;352:431–436. doi: 10.1016/j.bbrc.2006.11.028. [DOI] [PMC free article] [PubMed] [Google Scholar]
- 18.Gschwendt M, Muller HJ, Kielbassa K, Zang R, Kittstein W, Rincke G, Marks F. Biochem Biophys Res Commun. 1994;199:93–98. doi: 10.1006/bbrc.1994.1199. [DOI] [PubMed] [Google Scholar]
- 19.Brenner BM, Cooper ME, de Zeeuw D, Keane WF, Mitch WE, Parving HH, Remuzzi G, Snapinn SM, Zhang Z, Shahinfar S. N Engl J Med. 2001;345:861–869. doi: 10.1056/NEJMoa011161. [DOI] [PubMed] [Google Scholar]
- 20.Senthil D, Choudhury GG, McLaurin C, Kasinath BS. Kidney Int. 2003;64:468–479. doi: 10.1046/j.1523-1755.2003.00135.x. [DOI] [PubMed] [Google Scholar]
- 21.Frank GD, Saito S, Motley ED, Sasaki T, Ohba M, Kuroki T, Inagami T, Eguchi S. Mol Endocrinol. 2002;16:367–377. doi: 10.1210/mend.16.2.0768. [DOI] [PubMed] [Google Scholar]
- 22.Tan M, Xu X, Ohba M, Cui MZ. Arterioscler Thromb Vasc Biol. 2004;24:2271–2276. doi: 10.1161/01.ATV.0000148449.92035.3a. [DOI] [PubMed] [Google Scholar]
- 23.Ohtsu H, Mifune M, Frank GD, Saito S, Inagami T, Kim-Mitsuyama S, Takuwa Y, Sasaki T, Rothstein JD, Suzuki H, Nakashima H, Woolfolk EA, Motley ED, Eguchi S. Arterioscler Thromb Vasc Biol. 2005;25:1831–1836. doi: 10.1161/01.ATV.0000175749.41799.9b. [DOI] [PubMed] [Google Scholar]
- 24.Woolfolk EA, Eguchi S, Ohtsu H, Nakashima H, Ueno H, Gerthoffer WT, Motley ED. Am J Physiol Cell Physiol. 2005;289:C1286–1294. doi: 10.1152/ajpcell.00448.2004. [DOI] [PubMed] [Google Scholar]
- 25.Shah BH, Catt KJ. Mol Pharmacol. 2002;61:343–351. doi: 10.1124/mol.61.2.343. [DOI] [PubMed] [Google Scholar]
- 26.He Z, Way KJ, Arikawa E, Chou E, Opland DM, Clermont A, Isshiki K, Ma RC, Scott JA, Schoen FJ, Feener EP, King GL. J Biol Chem. 2005;280:15719–15726. doi: 10.1074/jbc.M413493200. [DOI] [PubMed] [Google Scholar]
- 27.Utsugisawa K, Nagane Y, Utsugisawa T, Obara D, Terayama Y. Brain Res Mol Brain Res. 2005;135:134–140. doi: 10.1016/j.molbrainres.2004.12.004. [DOI] [PubMed] [Google Scholar]
- 28.Steinberg SF. Biochem J. 2004;384:449–459. doi: 10.1042/BJ20040704. [DOI] [PMC free article] [PubMed] [Google Scholar]
- 29.Policha A, Daneshtalab N, Chen L, Dale LB, Altier C, Khosravani H, Thomas WG, Zamponi GW, Ferguson SS. J Biol Chem. 2006;281:26340–26349. doi: 10.1074/jbc.M605437200. [DOI] [PubMed] [Google Scholar]
- 30.Giorgione JR, Lin JH, McCammon JA, Newton AC. J Biol Chem. 2006;281:1660–1669. doi: 10.1074/jbc.M510251200. [DOI] [PMC free article] [PubMed] [Google Scholar]
- 31.Ha H, Yu MR, Choi YJ, Lee HB. Am J Kidney Dis. 2001;38:S204–207. doi: 10.1053/ajkd.2001.27446. [DOI] [PubMed] [Google Scholar]
- 32.Menne J, Park JK, Boehne M, Elger M, Lindschau C, Kirsch T, Meier M, Gueler F, Fiebeler A, Bahlmann FH, Leitges M, Haller H. Diabetes. 2004;53:2101–2109. doi: 10.2337/diabetes.53.8.2101. [DOI] [PubMed] [Google Scholar]
- 33.Ohshiro Y, Ma RC, Yasuda Y, Hiraoka-Yamamoto J, Clermont AC, Isshiki K, Yagi K, Arikawa E, Kern TS, King GL. Diabetes. 2006;55:3112–3120. doi: 10.2337/db06-0895. [DOI] [PubMed] [Google Scholar]
- 34.Koya D, Haneda M, Nakagawa H, Isshiki K, Sato H, Maeda S, Sugimoto T, Yasuda H, Kashiwagi A, Ways DK, King GL, Kikkawa R. Faseb J. 2000;14:439–447. doi: 10.1096/fasebj.14.3.439. [DOI] [PubMed] [Google Scholar]
- 35.Tuttle KR, Bakris GL, Toto RD, McGill JB, Hu K, Anderson PW. Diabetes Care. 2005;28:2686–2690. doi: 10.2337/diacare.28.11.2686. [DOI] [PubMed] [Google Scholar]
- 36.Miyamoto A, Nakayama K, Imaki H, Hirose S, Jiang Y, Abe M, Tsukiyama T, Nagahama H, Ohno S, Hatakeyama S, Nakayama KI. Nature. 2002;416:865–869. doi: 10.1038/416865a. [DOI] [PubMed] [Google Scholar]
- 37.Dlugosz JA, Munk S, Ispanovic E, Goldberg HJ, Whiteside CI. Am J Physiol Renal Physiol. 2002;282:F151–163. doi: 10.1152/ajprenal.0055.2001. [DOI] [PubMed] [Google Scholar]
- 38.Whiteside CI, Dlugosz JA. Am J Physiol Renal Physiol. 2002;282:F975–980. doi: 10.1152/ajprenal.00014.2002. [DOI] [PubMed] [Google Scholar]
- 39.Babazono T, Kapor-Drezgic J, Dlugosz JA, Whiteside C. Diabetes. 1998;47:668–676. doi: 10.2337/diabetes.47.4.668. [DOI] [PubMed] [Google Scholar]
- 40.Flyvbjerg A, Dagnaes-Hansen F, De Vriese AS, Schrijvers BF, Tilton RG, Rasch R. Diabetes. 2002;51:3090–3094. doi: 10.2337/diabetes.51.10.3090. [DOI] [PubMed] [Google Scholar]