Abstract
Renal tubule epithelial cells express the insulin receptor (IR); however, their value has not been firmly established. We generated mice with renal epithelial cell-specific knockout of the IR by Cre-recombinase-loxP recombination using a kidney-specific (Ksp) cadherin promoter. KO mice expressed significantly lower levels of IR mRNA and protein in kidney cortex (49–56% of the WT) and medulla (32–47%) homogenates. Immunofluorescence showed the greatest relative reduction in the thick ascending limb and collecting duct cell types. Body weight, kidney weight, and food and water intakes were not different from WT littermates. However, KO mice had significantly increased basal systolic blood pressure (BP, 15 mm Hg higher) as measured by radiotelemetry. In response to a volume load by gavage (20 ml/kg of body weight, 0.9% NaCl, 15% dextrose), KO mice had impaired natriuresis (37 ± 10 versus 99 ± 9 mmol of Na+ per 2 h in WT). Furthermore, volume load led to a sustained increase in BP in KO mice only. In contrast, insulin administration i.p. (0.5 units/kg of body weight) resulted in a significant fall in BP in WT, but not in KO mice. To test the role of reduced renal nitric oxide (NO) production in these responses, basal urinary nitrates plus nitrites excretion (UNOx) was measured and found to be 61% lower in KO vs. WT mice. Furthermore, acute insulin increased UNOx by 202% in the WT, relative to a significantly blunted rise (67%) in KO animals. These results illuminate a previously uncharacterized role for renal IR to reduce BP and facilitate sodium and water excretion, possibly via NO production.
Keywords: diabetes, metabolic syndrome, natriuresis, volume expansion
The incidence of insulin resistance is increasing worldwide in parallel with the rate of obesity. Insulin resistance, per se, is often subclinical, and defined by inefficient insulin receptor (IR) signaling in major metabolic tissues including, liver, muscle, and adipose (1, 2), resulting in impaired cellular glucose uptake. The kidney also expresses insulin receptors; however, whether or not “resistance” develops in this organ in the same manner as organs and tissues primarily involved in energy metabolism is debatable.
The IR belongs to the family of tyrosine kinase receptors and is composed of two subunits, α and β. The α-subunit is primarily extracellular and contains the ligand-binding domain, whereas the β-subunit is intrinsic to the lipid bilayer and contains the tyrosine kinase signaling domain, which catalyzes the transfer of the γ phosphate of ATP to tyrosine residues on protein substrates (3). The two subunits, α and β, are held together by disulfide bonds.
In the kidney, the IR has been localized along the entire length of the renal tubule from the proximal tubule through the collecting duct (4, 5). Insulin can act in the kidney in multiple ways, some which may have opposing effects on blood pressure. The hormone is clearly antinatriuretic and increases sodium reabsorption in the proximal tubule (6), thick ascending limb (7, 8), and collecting duct (9). Insulin infusion also has been demonstrated to increase blood pressure in rats (10, 11) and in humans (12). Nonetheless, insulin also has been demonstrated to have clear vasodilatory actions, likely through its ability induce nitric oxide (NO) (13). Its infusion into some species, such as dogs, is associated with no change or even a fall in blood pressure (BP), despite some sodium retention (14–16). NO could reduce BP not only via its vasodilatory actions, but it may also directly reduce sodium reabsorption in the thick ascending limb and collecting duct (17, 18). As a result, IR resistance, rather than increased insulin signaling, at the level of the kidney, may be more important in determining the net rise in blood pressure in most mammalian species with chronically high circulating levels of insulin (19, 20). Insulin-resistant humans and animals are characterized by impaired sodium homeostasis (21).
On the other hand, previous studies by Sechi and colleagues (22–24) suggest that the kidney does not develop insulin resistance in the same manner as the muscle or liver and propose that high circulating insulin (during insulin resistance) results in inappropriate sodium retention by the kidney, which produces an increase in BP. These studies were based on mRNA expression of the renal IR and radiolabeled ligand binding. On the contrary, our recent work (25) has demonstrated decreased renal expression of IR protein and phosphorylated IR, the first step in insulin signaling, in the obese Zucker rat, an animal model of obesity-associated insulin resistance. We have also shown reduced IR protein in streptozotocin-induced, type I diabetic rats. Furthermore, type 1 diabetic rats have been demonstrated to have blunted natriuresis in response to volume expansion (26). Thus, the role of IR in the kidney in affecting BP and volume status warrants further study.
To further explore these relationships, in the present study, using a standard Cre-loxP approach, we generated mice with tissue-specific knockout of the IR from renal epithelial cells to determine the role of renal IR in BP control and sodium handling. To achieve renal tubule specificity, the Cre recombinase gene was driven by a kidney-specific (Ksp) cadherin promoter (27). Ksp-cadherin, a member of the cadherin family of calcium-dependent cell adhesion molecules, is expressed exclusively in the renal epithelium (28, 29). Its predominant site of expression, however, is in the distal portion of the renal tubule, i.e., thick ascending limb through collecting duct (30, 31), the site most critical for day-to-day regulation of sodium reabsorption. These mice were crossed with mice homozygous for the “floxed” IR gene, i.e., transgenic mice with exon 4 of the IR gene flanked by loxP sites (32–35). Resulting renal epithelial cell knockout mice (IR KO) had significantly increased systolic BP, reduced sodium excretion in response to an oral saline load, and reduced urinary NO excretion relative to WT mice. These results uncover a role for renal IR in the maintenance of normal BP and natriuresis in response to volume expansion.
Results
Validation and Characterization of Renal Epithelial-Specific Insulin Receptor KO Mice.
KO mice had no gross abnormalities in their growth or in basic physiological parameters (Table 1). There were no significant differences in body weight, kidney weights, or blood glucose in KO mice relative to their WT littermates. Twenty-four-hour metabolic data demonstrated no significant differences in food or water intake or urinary excretion of sodium, potassium, and creatinine. Basal urine osmolality was also not significantly different.
Table 1.
Physiologic and metabolic data in KO mice and their WT littermates under normal dietary conditions (≈6 months of age)
| Parameters | WT | KO |
|---|---|---|
| Body weight, g | 31.9 ± 1.6 | 34.7 ± 1.4 |
| Plasma glucose, mg/dl | 101 ± 5 | 107 ± 5 |
| Urine volume, ml/day | 1.0 ± 0.1 | 0.8 ± 0.2 |
| Urine sodium, mmol/day | 0.17 ± 0.02 | 0.12 ± 0.03 |
| Urine potassium, mmol/day | 0.25 ± 0.03 | 0.22 ± 0.06 |
| Urine osmolality, mmol/kg·H2O | 2,072 ± 155 | 2,374 ± 253 |
| Urine creatinine, mg/day | 0.63 ± 0.04 | 0.54 ± 0.09 |
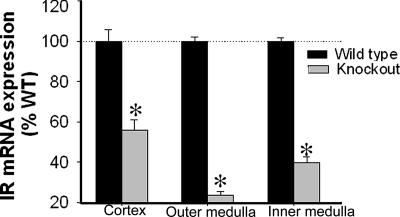
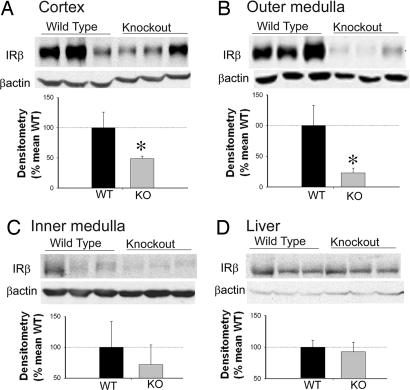
Real-time RT-PCR showed a significantly reduced abundance of IR mRNA in the three regions of the kidney [cortex (CTX), inner stripe of the outer medulla (OM), and inner medulla (IM)] in KO mice relative to their WT littermates (Fig. 1). Furthermore, immunoblotting revealed significantly reduced IR protein expression in the CTX and OM, with a trend toward reduction in the IM (P = 0.07) in KO mice kidneys (Fig. 2 A–C). However, IR-β protein in the liver was not significantly different between the genotypes, demonstrating the tissue specificity of the Cre-mediated recombination (Fig. 2D).
Fig. 1.
Insulin receptor mRNA in three kidney regions. mRNA (mean ± SEM, n = 5 per genotype) expression in the kidney regions of KO mice relative to WT mice, as measured by real-time quantitative RT-PCR with SYBR green. Relative quantitation for the IR gene was calculated by using the formula 2 − (ΔCT1 − ΔCT0). The ΔCT1 and ΔCT0 are the differences between the CT of the IR gene and that of the calibrator gene, GAPDH in KO and WT, respectively (ΔCT = CTIR − CTGAPDH). ΔCT values for KO and WT were compared by unpaired t test. *, significant (P < 0.05) difference between the genotypes.
Fig. 2.
Insulin receptor protein in kidney and liver. Representative lanes are shown from immunoblots of homogenates prepared from cortex (A), outer medulla (B), inner medulla (C), and liver (D), probed with the IR (β-subunit) polyclonal antibody and then reprobed for β-actin. Summary of IR band densities, normalized by β-actin (n = 10 per genotype), is shown below blots. For immunoblotting, each lane was loaded with an equal amount of total protein. Each lane represents a sample from an individual mouse. KO mice had significantly reduced IR-β protein expression in the cortical and outer medullary homogenates, relative to WT littermates. *, a significant (P < 0.05) difference between the two genotypes by unpaired t test.
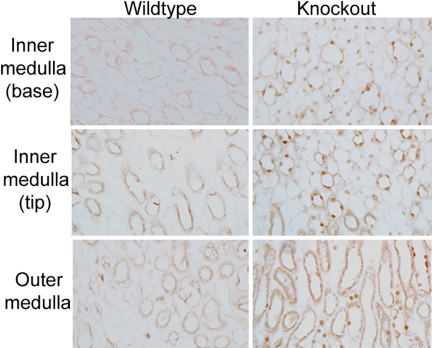
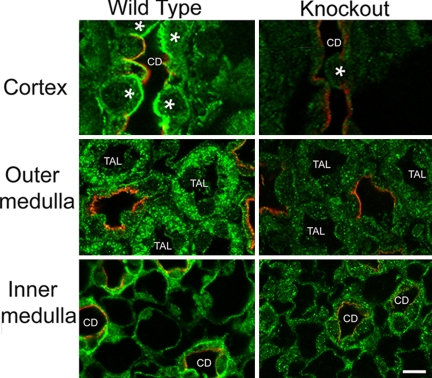
Immunohistochemical analysis showed that the recombination was specific for renal tubule epithelial cells. We first determined that Cre-recombinase (Cre) was expressed in the expected epithelial cells in KO mice (which were all heterozygous for Cre). Immunoperoxidase-based labeling using a Cre-specific antibody was performed. As shown (Fig. 3), Cre was detected in the nucleus of epithelial cells, including thick ascending limb (TAL) and collecting duct (CD), in KO mice, but not in WT mice. Proximal tubule cell detection of Cre in the KO mice was limited (data not shown). In agreement with Cre expression, KO mice had reduced IR-β fluorescence in CD and TAL cells relative to WT mice (Fig. 4). No apparent differences in IR-β expression were observed in proximal tubule cells (data not shown).
Fig. 3.
Localization and expression of Cre-recombinase (Cre) in medulla. Immunohistochemistry using a Cre-specific antibody demonstrated the expression of Cre in the nucleus of thick ascending limb (TAL) and collecting duct (CD) cells of the renal tubule epithelium in the KO mouse. Staining was absent in the WT mouse. (Total magnification, ×400.)
Fig. 4.
Immunofluorescent localization of IR-β. Dual labeling of IR-β (green) and aquaporin-2 (AQP2, red), marker for collecting duct principal cells in the three regions of the kidney in WT and KO mice. IR immunofluorescence was markedly diminished in the cortex (Top) collecting duct (CD) cells, both principal cells (labeled red with AQP2 antibody) and intercalated cells (indicated with an asterisk). In the outer medulla (Middle), IR immunofluorescence was also diminished in the thick ascending limb cells (TAL). In the inner medulla (Bottom), IR was strongly reduced in the inner medullary collecting duct cells (CD). (Total magnification, ×1,000.)
Higher Systolic BP in KO Mice.
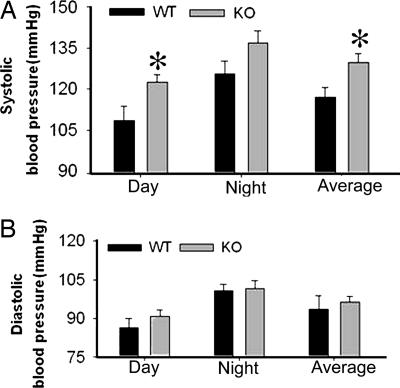
BP was measured by radiotelemetry over the course of several 24-hour periods, at 10-min intervals. BP showed normal diurnal rhythming in KO mice, with higher BP at night relative to the day, as in the WT mice (Fig. 5). Systolic BP was elevated in KO versus WT mice, by 15 mm Hg (Fig. 5A). Diastolic BPs were not significantly different (Fig. 5B).
Fig. 5.
Basal blood pressure of KO and WT mice. Day time (light period), night time (dark period) and 24-hour average systolic (A) and diastolic (B) blood pressure in mice (n = 6 per genotype). BP showed normal diurnal pattern in both genotypes. KO mice had significantly higher systolic blood pressure. *, a mean is significantly different (P < 0.05) from that of the WT by unpaired t test.
Altered Natriuresis in KO Mice.
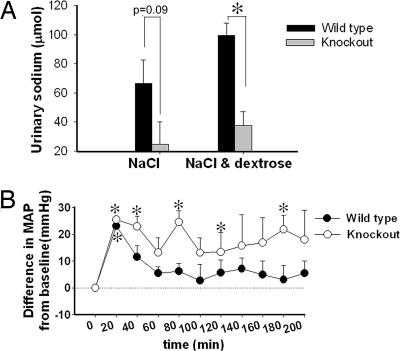
To test whether KO mice had impaired natriuresis in response to volume expansion, we administered an oral saline load (1 ml of 0.9% saline via gavage) and collected urine to analyze sodium excretion. A decreased urinary sodium excretion was found in the KO mice relative to WT littermates, but the difference was not statistically significant (Fig. 6A, left bars). In a second test we administered 15% dextrose in the same volume of saline to stimulate insulin secretion (Fig. 6A, right bars). Under these conditions, urine sodium excretion was significantly decreased in KO mice relative to WT mice. BP was also measured during the saline plus dextrose experiment (Fig. 6B). Data are plotted as the difference in mean arterial blood pressure (MAP) (ΔMAP) from baseline before the gavage. After the administration of saline and dextrose, ΔMAP was significantly positive in mice of both genotypes. This increase, however, disappeared in WT mice after 30 min, whereas in KO mice it remained significantly positive at 40, 80, 120, and 180 min.
Fig. 6.
Altered natriuresis in KO mice. (A) Urinary sodium excretion (absolute) in response to gavaged NaCl (0.9%) with and without dextrose in 4 h, μmol per 4 h (n = 6 per genotype). *, a significant (P < 0.05) difference between the groups. (B) ΔMAP in response to gavaged NaCl plus dextrose in mice (n = 4 per genotype). *, a significant elevation (P < 0.05) from baseline.
KO Mice Had Reduced Urinary Nitrate and Nitrite (UNOx) Excretion.
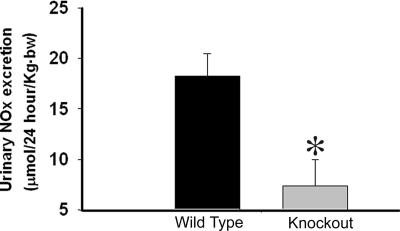
To determine whether the increase in systolic blood pressure and the impaired natriuresis in the KO mice might be related to a defect in nitric oxide (NO) metabolism, we measured 24-hour urinary NOx excretion under basal conditions. KO mice showed significantly reduced UNOx excretion relative to WT littermates (Fig. 7).
Fig. 7.
Urinary nitrate and nitrite (UNOx) excretion. Twenty-four-hour UNOx excretion (mean ± SEM, n = 5 per genotype). *, a significant (P < 0.05) difference from WT.
KO Mice Had Reduced Sensitivity to Insulin with Regard to UNOx Excretion and BP.
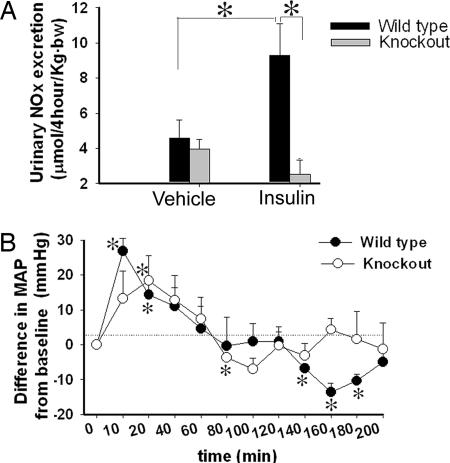
Insulin has been shown to induce NO production in the kidney and thereby increase UNOx excretion (13). To determine whether KO of the renal epithelial IR altered this production, we examined the response of mice to acute insulin administration by i.p. injection. Insulin caused a significant increase in UNOx in WT, but not in KO mice (Fig. 8A). To determine whether acute insulin administration affected MAP differentially between the genotypes, we used radiotelemetry (Fig. 8B). Data are plotted as the ΔMAP from baseline. In the short term, MAP was significantly increased by insulin in both genotypes (significant at 10, 20, and 30 min in the WT and at 20 min in the KO). Blood pressure then began to fall in both genotypes. MAP was significantly reduced in KO mice at only one time point (80 min), but in the WT mice, MAP was significantly reduced (relative to baseline) at 140, 160, and 180 min.
Fig. 8.
Urinary nitrate and nitrite (UNOx) excretion and BP in response to acute insulin administration. (A) UNOx excretion, in response to i.p. insulin or vehicle administration, in urine collected at 4 h after injection (mean ± SEM, n = 6 per genotype). *, a significant (P < 0.05) difference between the groups. (B) ΔMAP in response to acute insulin (mean ± SEM, n = 5 per genotype) in KO and WT mice. *, a significant (P < 0.05) difference from baseline.
Discussion
In this study, we found that mice with substantially reduced expression of the IR in renal tubules, as the result of renal epithelial cell-specific knockout, had significantly elevated systolic BP in the basal state and after dextrose/saline gavage, and impaired natriuresis. Furthermore, the urinary excretion of nitrates plus nitrites (UNOx), which reflects renal NO levels, was significantly reduced in the basal state and in response to acute insulin. The reduced UNOx excretion was associated with a blunted fall in BP in response to insulin. These findings demonstrate a clear physiological role for renal epithelial IR in the maintenance of normal BP and volume-expansion-associated natriuresis. Thus, down-regulation of renal IR expression and signaling, as we have demonstrated in insulin-resistant rodents (25), may be a critical, yet underappreciated determinant of the BP elevation observed in the metabolic syndrome.
Transgenic mice carrying a “floxed” IR gene flanked by two loxP sites allows for deletion of the IR gene in cells that express Cre recombinase. This line of IRloxP mice has been used to selectively delete IR from a variety of primarily metabolic tissues including liver (36), muscle (34), brown adipose tissue (35), and brain (33). To target our knockout to renal epithelial cells, we crossed the IRloxP mice with mice expressing Cre recombinase driven by the Ksp-cadherin promoter. The promoter region of the Ksp-cadherin gene has been found to contain binding sites for nuclear proteins that are specifically expressed in renal epithelial cells (27, 30). We found that this promoter was able to achieve IR knockout most efficiently in the distal portion of the renal tubule, including the CD and TAL. IR expression in the proximal tubule was not substantially different between the two genotypes. These results are consistent with other reports demonstrating predominant expression of Ksp-cadherin in the distal portion of the kidney tubule (30, 31). Therefore, we propose that our phenotype arose mainly from the lack of IR signaling in the TAL through the CD, major sites of regulated NaCl reabsorption.
Altered NO metabolism could play a role in increased BP and impaired natriuretic response in IR KO mice. Renal NO has been suggested to play important roles in long-term BP regulation by its autocrine and paracrine actions, particularly in the medullary CD and TAL (37, 38). In fact, the CD may be the largest source of renal NO (39). NO produced in the kidney could contribute to reduced BP by at least two mechanisms. Perhaps the most important of these is that NO acts as a potent vasodilator by means of its ability to activate guanylyl cyclase, leading to the production of cGMP and reduced vascular tone. Reduced peripheral and renal vasoconstriction can alter renal hemodynamics and reduce BP by both renal and nonrenal actions. We found that acute insulin resulted in a delayed (after 2–3 h) fall in BP below baseline in the WT mice, perhaps because of NO-mediated vasodilation. This decline was not observed in the KO mice, which also excreted significantly less NO in response to insulin. Second, evidence exists (mainly ex vivo and in vitro) that NO can inhibit sodium reabsorption in renal epithelium, specifically in the TAL and CD (17, 18, 40).
On the other hand, strong evidence exists, including some from our own laboratory, that insulin can raise BP and cause sodium retention under certain situations. Insulin infusion has been demonstrated to be antinatriuretic in both humans (41) and animals (42, 43). This effect is likely due to the capacity of insulin to directly increase the activity of various sodium transporters and channels such as ENaC (11, 43–45). In previous work, we have shown that insulin increased the localization of ENaC subunits in the apical membrane versus in subcellular locations in rats and mice. We were also able to block the antinatriuresis in mice due to insulin by pretreatment with an ENaC antagonist, benzamil (43). In addition, we (11) and others (10, 46) have also demonstrated elevations in BP in response to insulin infusion in rats. Thus, our current findings of increased BP and impaired natriuresis in the IR KO mice were somewhat of a surprise and may suggest that, at least in young mice, the effects of insulin to produce NO may be a more determining factor, with regard to BP and regulation of volume after expansion, than the antinatriuretic effects.
These data support our overall hypothesis that reduced numbers or efficiency of signaling of existing IR in the renal epithelial TAL through CD, may have a role in the BP rises observed in the metabolic syndrome. We have recently reported a marked reduction in the renal expression of IR protein, and the phosphorylated form of this protein (particularly in the CD) in the obese Zucker rat (25), a model for the metabolic syndrome. Moreover, we (25) and others (21, 47, 48) have reported impaired renal NO-generating ability in these rats. However, whether reductions in IR in the obese Zucker rat are causative or simply associated with impaired NO generation is not clear.
Furthermore, the mechanisms underlying the decreased expression of renal IR in the metabolic syndrome are not known. We showed that when treated with candesartan, an AT1 receptor (AT1R) antagonist, or the PPAR-γ (peroxisome proliferator-activated receptor subtype γ) agonist, rosiglitazone, renal IR levels were increased in obese Zucker rats (25). In those studies, candesartan was particularly efficacious with regard to increasing renal protein levels of IR, and even led to an increase in the levels in the kidneys of lean rats. Thus, one possible mechanism underlying down-regulation of renal IR in insulin resistance could be elevated renal AT1R activity.
Nonetheless, whether or not there is reduced renal IR signaling in the metabolic syndrome, is not entirely agreed upon. Sechi and colleagues (22, 24, 49) have conducted a number of studies using the fructose-fed rat as a model for insulin resistance/metabolic syndrome. They have shown high-fructose diets increased insulin resistance of peripheral tissues including muscle, but did not affect insulin sensitivity of the renal IR, as determined by I-125-labeled insulin binding and mRNA expression of the IR in kidney. However, neither protein levels of IR nor signaling beyond the level of binding was evaluated. Thus, they concluded that high circulating levels of insulin during insulin resistance increase renal IR signaling, NaCl retention, and BP in this manner. Another possibility is that in the metabolic syndrome, the renal IR signaling cascade is altered so that less NO is produced by Akt and eNOS, with greater NaCl retention, by ENaC. Additional studies are warranted. Our IR KO mouse model will allow us to evaluate separately the effects of reduced renal IR on BP, NaCl handling, and NO metabolism, without the confounding influence of an altered metabolic milieu.
Overall, our studies reveal a role for renal epithelial IR in the normal control of BP and volume expansion-associated natriuresis in mice. Reduced or altered renal epithelial IR signaling may be particularly relevant for hypertension associated with insulin resistance in the metabolic syndrome.
Materials and Methods
Mice Breeding.
All mice were maintained under protocols approved by the Georgetown University Animal Care and Use Committee (GUACUC) in our facility, which is fully accredited with AAALAC (Association for Assessment and Accreditation of Laboratory Animal Care International). Mice with renal epithelial cell-selective knockout of the IR were generated by crossing mice that were homozygous for floxed IR gene(obtained from C. Ronald Kahn, Joslin Diabetes Center) (34), in which loxP sites flanked exon 4 of the IR gene, with mice carrying cre recombinase driven by the kidney-specific, ksp-cadherin promoter (ksp-Cre mice, obtained from Peter Igarashi, University of Texas Southwestern Medical Center, Dallas) (27). Female, heterozygous ksp-Cre mice were mated with homozygous, male floxed IR mice. Female offspring (F1) heterozygous for both ksp-Cre and floxed IR were bred back to the homozygous floxed IR males. The offspring (F2 generation) that were homozygous for floxed IR and heterozygous for the ksp-Cre gene were considered KOs, and their littermates that did not carry the ksp-cadherin-driven Cre-recombinase insert were WT.
Genotyping.
For genotyping, tail DNA was prepared by using DirectPCR Lysis Reagents (Viagen Biotech). The primers used for the amplification of the Cre-recombinase gene (235-bp product) were: forward 5′-AGG TTC GTT CAC TCA TGG A-3′, and reverse 5′-TCG ACC AGT TTA GTT ACC C-3′. Mice heterozygous for Cre have this band; WT mice do not. The primers used to amplify the region in the targeted allele spanning the loxP sites were: forward 5′-TGC ACC CCA TGT CTG GGA CCC-3′ and reverse 5′-GCC TCC TGA ATA GCT GAG ACC-3′. The band size of the nonrecombined allele is 280 bp, whereas the recombined allele yields a 300-bp product.
Quantitative Gene Expression Analysis.
Real-time quantitative (q)RT-PCR was performed to compare the IR gene expression between the genotypes. The right and left kidneys, as well as a small piece of liver, were removed from anesthetized male mice, WT and KO (n = 5 per genotype). Kidneys were dissected into three regions: (i) CTX: brown-red, primarily proximal tubules; (ii) OM: deep red, primarily TAL; and (iii) IM: white, primarily collecting ducts. Total RNA was extracted by a standard guanidium thiocyanate method using the RNAqueous-4PCR kit (Ambion). Total RNA (500 ng) was reverse-transcribed by using SuperScript III (Invitrogen), and qRT-PCR was then carried out with the resulting cDNA in an ABI PRISM 7700 Sequence Detection System (Applied Biosystems) using SYBR-green PCR Master Mix (Applied Biosystems). Insulin receptor primers used for qRT-PCR were: forward 5′-GTG CTG CTC ATG TCC TAA GA-3′, and reverse 5′-AAT GGT CTG TGC TCT TCG TG-3′. The transcription level of the GAPDH gene was also analyzed as a control (calibrator) by using specific primers (Clontech). The comparative cycle threshold (CT) method was used to analyze the data (Applied Biosystems software) by generating relative values of the amount of target cDNA. Relative quantitation for IR was calculated after determination of the difference between CT of the IR gene and that of the calibrator gene, GAPDH in KO (ΔCT1 = CTIR − CTGAPDH) and WT mice (ΔCT0 = CTIR − CTGAPDH) by using the 2 − ΔΔCT formula, where ΔΔCT = ΔCT1 − ΔCT0. CT values are means of triplicate measurements. Experiments were repeated three times. ΔCT values for KO and WT mice were compared by unpaired t test.
Western Blot Analysis.
To determine whether the reduced mRNA resulted in a reduction in IR protein, we performed Western blot analysis on kidney CTX, OM, and IM samples obtained from the right kidney of another set of male mice (n = 10 per genotype). Whole-cell homogenates were prepared according to published protocols (50). Protein was measured, and immunoblotting was performed by using rabbit anti-IR-β antibody (Santa Cruz Biotechnology) as described (51, 52). The blots were stripped and reprobed with a mouse monoclonal anti-β-actin (Sigma).
Immunohistochemistry.
To demonstrate the expression of KSP-cre in the target cells and to determine which renal cell types were most affected in the KO mice, immunohistochemistry was performed. Male KO and WT littermates (n = 10 per genotype) were anesthetized, and the left kidney was perfusion-fixed (43, 53). Kidneys were harvested, sectioned, and stained by using standard methods (25, 43, 53). Rabbit anti-Cre-specific antibody (Covance), rabbit anti-IR-β antibody, chicken anti-aquaporin-2, and goat anti-rabbit Alexa Fluor 488 (Invitrogen) antibodies were used.
Metabolic Data.
Six-month-old male mice (n = 8 per genotype) were acclimatized for 1 week in metabolic cages (Hatteras Instruments) before 24-hour urine collection. Mice had free access to a rodent chow diet (Purina 5001; Purina Mills) and water. Food and water intakes were also measured.
BP Measurement.
BP was measured by using radiotransmitters (Data Sciences). Mice were anesthetized with pentobarbital, and a ventral incision was made near the sternum. The pressure-sensitive tip of the catheter attached to the transmitter was inserted and secured in the carotid artery, whereas the transmitter body was placed in a s.c. pocket. Mice were housed singly, and the cages were placed on top of radioreceivers. After a recovery time of 7 days, BP was recorded every 3–10 min by using Data Sciences Acquisition Software (Data Sciences) as described (11, 54).
Electrolyte and Metabolite Measurements.
Urinary sodium and potassium were determined by ion-selective electrodes (ELISE Electrolyte System; Beckman Instruments). Urinary creatinine was measured by using the Jaffe rate method (Beckmann Creatinine Analyzer 2, Beckman Instruments). Urinary nitrates and nitrites were determined by colorimetric kit (Griess Reaction; R & D Systems).
Acute Responses to Oral Saline Load and i.p. Insulin.
To evaluate whether the KO mice had altered pressure natriuresis, male mice (n = 6 per genotype) were given 0.9% saline (20 ml/kg of body weight) by gavage, and urine was collected for 4 h and urine sodium measured. Two weeks later, the same set of mice were gavaged with 0.9% saline containing 15% dextrose (25 ml/kg of body weight), to stimulate endogenous insulin secretion. Urine was again collected for 4 h. BP was measured by radiotelemetry during this experiment.
To evaluate the acute responses to insulin, male mice (n = 6 per genotype) were injected with insulin (0.5 units/kg of body weight in 0.6 ml of 10% dextrose solution in water, i.p.). Urine was collected for 4 h and urine sodium measured. BP was monitored during this test. Two days later, mice of the same set as above were injected with 0.6 ml of water (i.p.) as above, and urine was again collected for 2 h.
Statistical Analysis.
Data were evaluated by using Sigma Stat software. Data are presented as mean ± SEM. Unpaired t test was used to determine significant differences between pairs of means when animals were different between the two treatments. Paired t test was used to determine differences between means when the same animals were studied under two conditions. P < 0.05 was considered significant for all analyses.
Acknowledgments.
This work was supported by National Heart, Lung, and Blood Institute Grants HL073193, HL074142, and DK064872 (to C.M.A.E.) and University of Texas Southwestern O'Brien Kidney Research Core Center (P3ODKO79328) for ksp-Cre mice.
Footnotes
The authors declare no conflict of interest.
This article is a PNAS Direct Submission.
References
- 1.Boden G, et al. Insulin receptor down-regulation and impaired antilipolytic action of insulin in diabetic patients after pancreas/kidney transplantation. J Clin Endocrinol Metab. 1994;78:657–663. doi: 10.1210/jcem.78.3.8126138. [DOI] [PubMed] [Google Scholar]
- 2.Capeau J. Insulin signaling: Mechanisms altered in insulin resistance. Med Sci. 2005;21:34–39. Spec No. [PubMed] [Google Scholar]
- 3.De Meyts P. Insulin and its receptor: Structure, function and evolution. BioEssays. 2004;26:1351–1362. doi: 10.1002/bies.20151. [DOI] [PubMed] [Google Scholar]
- 4.Butlen D, Vadrot S, Roseau S, Morel F. Insulin receptors along the rat nephron: [125I] insulin binding in microdissected glomeruli and tubules. Pflugers Arch. 1988;412:604–612. doi: 10.1007/BF00583761. [DOI] [PubMed] [Google Scholar]
- 5.Sechi LA, De Carli S, Bartoli E. In situ characterization of renal insulin receptors in the rat. J Recept Res. 1994;14:347–356. doi: 10.3109/10799899409101509. [DOI] [PubMed] [Google Scholar]
- 6.Baum M. Insulin stimulates volume absorption in the rabbit proximal convoluted tubule. J Clin Invest. 1987;79:1104–1109. doi: 10.1172/JCI112925. [DOI] [PMC free article] [PubMed] [Google Scholar]
- 7.Mandon B, et al. Insulin stimulates Na+, Cl−, Ca2+, and Mg2+ transports in TAL of mouse nephron: Cross-potentiation with AVP. Am J Physiol. 1993;265:F361–F369. doi: 10.1152/ajprenal.1993.265.3.F361. [DOI] [PubMed] [Google Scholar]
- 8.Ito O, et al. Insulin stimulates NaCl transport in isolated perfused MTAL of Henle's loop of rabbit kidney. Am J Physiol. 1994;267:F265–F270. doi: 10.1152/ajprenal.1994.267.2.F265. [DOI] [PubMed] [Google Scholar]
- 9.Takahashi N, Ito O, Abe K. Tubular effects of insulin. Hypertens Res. 1996;1(19) Suppl:S41–S45. doi: 10.1291/hypres.19.supplementi_s41. [DOI] [PubMed] [Google Scholar]
- 10.Brands MW, Hildebrandt DA, Mizelle HL, Hall JE. Sustained hyperinsulinemia increases arterial pressure in conscious rats. Am J Physiol. 1991;260:R764–R768. doi: 10.1152/ajpregu.1991.260.4.R764. [DOI] [PubMed] [Google Scholar]
- 11.Song J, et al. Regulation of blood pressure, the epithelial sodium channel (ENaC), and other key renal sodium transporters by chronic insulin infusion in rats. Am J Physiol. 2006;290:F1055–F1064. doi: 10.1152/ajprenal.00108.2005. [DOI] [PubMed] [Google Scholar]
- 12.Gans RO, et al. Renal and cardiovascular effects of exogenous insulin in healthy volunteers. Clin Sci. 1991;80:219–225. doi: 10.1042/cs0800219. [DOI] [PubMed] [Google Scholar]
- 13.Hayashi K, et al. Effects of insulin on rat renal microvessels: Studies in the isolated perfused hydronephrotic kidney. Kidney Int. 1977;51:1507–1513. doi: 10.1038/ki.1997.207. [DOI] [PubMed] [Google Scholar]
- 14.Brands MW, Mizelle HL, Gaillard CA, Hildebrandt DA, Hall JE. The hemodynamic response to chronic hyperinsulinemia in conscious dogs. Am J Hypertens. 1991;4:164–168. doi: 10.1093/ajh/4.2.164. [DOI] [PubMed] [Google Scholar]
- 15.Hall JE, Brands MW, Mizelle HL, Gaillard CA, Hildebrandt DA. Chronic intrarenal hyperinsulinemia does not cause hypertension. Am J Physiol. 1991;260:F663–F669. doi: 10.1152/ajprenal.1991.260.5.F663. [DOI] [PubMed] [Google Scholar]
- 16.Hall JE, Brands MW, Zappe DH, Alonso-Galicia M. Cardiovascular actions of insulin: Are they important in long-term blood pressure regulation? Clin Exp Pharmacol Physiol. 1995;22:689–700. doi: 10.1111/j.1440-1681.1995.tb01922.x. [DOI] [PubMed] [Google Scholar]
- 17.Ortiz PA, Hong NJ, Garvin JL. NO decreases thick ascending limb chloride absorption by reducing Na(+)-K(+)-2Cl(−) cotransporter activity. Am J Physiol. 2001;281:F819–F825. doi: 10.1152/ajprenal.2001.281.5.F819. [DOI] [PubMed] [Google Scholar]
- 18.Stoos BA, Garcia NH, Garvin JL. Nitric oxide inhibits sodium reabsorption in the isolated perfused cortical collecting duct. J Am Soc Nephrol. 1995;6:89–94. doi: 10.1681/ASN.V6189. [DOI] [PubMed] [Google Scholar]
- 19.Sowers JR, Sowers PS, Peuler JD. Role of insulin resistance and hyperinsulinemia in development of hypertension and atherosclerosis. J Lab Clin Med. 1994;123:647–652. [PubMed] [Google Scholar]
- 20.Meigs JB. Epidemiology of the insulin resistance syndrome. Curr Diab Rep. 2003;3:73–79. doi: 10.1007/s11892-003-0057-2. [DOI] [PubMed] [Google Scholar]
- 21.Fujiwara K, et al. Altered pressure-natriuresis in obese Zucker rats. Hypertension. 1999;33:1470–1475. doi: 10.1161/01.hyp.33.6.1470. [DOI] [PubMed] [Google Scholar]
- 22.Catena C, Cavarape A, Novello M, Giacchetti G, Sechi LA. Insulin receptors and renal sodium handling in hypertensive fructose-fed rats. Kidney Int. 2003;64:2163–2171. doi: 10.1046/j.1523-1755.2003.00313.x. [DOI] [PubMed] [Google Scholar]
- 23.Sechi LA, et al. Abnormalities of insulin receptors in spontaneously hypertensive rats. Hypertension. 1996;27:955–961. doi: 10.1161/01.hyp.27.4.955. [DOI] [PubMed] [Google Scholar]
- 24.Sechi LA, Griffin CA, Schambelan M. Effect of dietary sodium chloride on insulin receptor number and mRNA levels in rat kidney. Am J Physiol. 1994;266:F31–F38. doi: 10.1152/ajprenal.1994.266.1.F31. [DOI] [PubMed] [Google Scholar]
- 25.Tiwari S, Halagappa VK, Riazi S, Hu X, Ecelbarger CA. Reduced expression of insulin receptors in the kidneys of insulin-resistant rats. J Am Soc Nephrol. 2007;18:2661–2671. doi: 10.1681/ASN.2006121410. [DOI] [PubMed] [Google Scholar]
- 26.Patel KP, Zhang PL. Reduced renal responses to volume expansion in streptozotocin-induced diabetic rats. Am J Physiol. 1989;257:R672–R679. doi: 10.1152/ajpregu.1989.257.3.R672. [DOI] [PubMed] [Google Scholar]
- 27.Whyte DA, et al. Ksp-cadherin gene promoter. I. Characterization and renal epithelial cell-specific activity. Am J Physiol. 1999;277:F587–F598. doi: 10.1152/ajprenal.1999.277.4.F587. [DOI] [PubMed] [Google Scholar]
- 28.Igarashi P, et al. Ksp-cadherin gene promoter. II. Kidney-specific activity in transgenic mice. Am J Physiol. 1999;277:F599–F610. doi: 10.1152/ajprenal.1999.277.4.F599. [DOI] [PubMed] [Google Scholar]
- 29.Thomson RB, Aronson PS. Immunolocalization of Ksp-cadherin in the adult and developing rabbit kidney. Am J Physiol. 1999;277:F146–F156. doi: 10.1152/ajprenal.1999.277.1.F146. [DOI] [PubMed] [Google Scholar]
- 30.Shen SS, Krishna B, Chirala R, Amato RJ, Truong LD. Kidney-specific cadherin, a specific marker for the distal portion of the nephron and related renal neoplasms. Mod Pathol. 2005;18:933–940. doi: 10.1038/modpathol.3800373. [DOI] [PubMed] [Google Scholar]
- 31.Mazal PR, et al. Expression of kidney-specific cadherin distinguishes chromophobe renal cell carcinoma from renal oncocytoma. Hum Pathol. 2005;36:22–28. doi: 10.1016/j.humpath.2004.09.011. [DOI] [PubMed] [Google Scholar]
- 32.Abel ED, et al. Cardiac hypertrophy with preserved contractile function after selective deletion of GLUT4 from the heart. J Clin Invest. 1999;104:1703–1714. doi: 10.1172/JCI7605. [DOI] [PMC free article] [PubMed] [Google Scholar]
- 33.Bruning JC, et al. Role of brain insulin receptor in control of body weight and reproduction. Science. 2000;289:2122–2212. doi: 10.1126/science.289.5487.2122. [DOI] [PubMed] [Google Scholar]
- 34.Bruning JC, et al. A muscle-specific insulin receptor knockout exhibits features of the metabolic syndrome of NIDDM without altering glucose tolerance. Mol Cell. 1998;2:559–569. doi: 10.1016/s1097-2765(00)80155-0. [DOI] [PubMed] [Google Scholar]
- 35.Guerra C, et al. Brown adipose tissue-specific insulin receptor knockout shows diabetic phenotype without insulin resistance. J Clin Invest. 2001;108:1205–1213. doi: 10.1172/JCI13103. [DOI] [PMC free article] [PubMed] [Google Scholar]
- 36.Michael MD, et al. Loss of insulin signaling in hepatocytes leads to severe insulin resistance and progressive hepatic dysfunction. Mol Cell. 2000;6:87–97. [PubMed] [Google Scholar]
- 37.Cowley AW, Jr, Mattson DL, Lu S, Roman RJ. The renal medulla and hypertension. Hypertension. 1995;25:663–673. doi: 10.1161/01.hyp.25.4.663. [DOI] [PubMed] [Google Scholar]
- 38.Cowley AW, Jr, Mori T, Mattson D, Zou AP. Role of renal NO production in the regulation of medullary blood flow. Am J Physiol. 2003;284:R1355–R1369. doi: 10.1152/ajpregu.00701.2002. [DOI] [PubMed] [Google Scholar]
- 39.Wu F, Park F, Cowley AW, Jr, Mattson DL. Quantification of nitric oxide synthase activity in microdissected segments of the rat kidney. Am J Physiol. 1999;276:F874–F881. doi: 10.1152/ajprenal.1999.276.6.F874. [DOI] [PubMed] [Google Scholar]
- 40.Stoos BA, Carretero OA, Garvin JL. Endothelial-derived nitric oxide inhibits sodium transport by affecting apical membrane channels in cultured collecting duct cells. J Am Soc Nephrol. 1994;4:1855–1860. doi: 10.1681/ASN.V4111855. [DOI] [PubMed] [Google Scholar]
- 41.DeFronzo RA, Cooke CR, Andres R, Faloona GR, Davis PJ. The effect of insulin on renal handling of sodium, potassium, calcium, and phosphate in man. J Clin Invest. 1975;55:845–855. doi: 10.1172/JCI107996. [DOI] [PMC free article] [PubMed] [Google Scholar]
- 42.DeFronzo RA, Goldberg M, Agus ZS. The effects of glucose and insulin on renal electrolyte transport. J Clin Invest. 1976;58:83–90. doi: 10.1172/JCI108463. [DOI] [PMC free article] [PubMed] [Google Scholar]
- 43.Tiwari S, Nordquist L, Halagappa VK, Ecelbarger CA. Trafficking of ENaC subunits in response to acute insulin in mouse kidney. Am J Physiol. 2007;293:F178–F185. doi: 10.1152/ajprenal.00447.2006. [DOI] [PubMed] [Google Scholar]
- 44.Wang J, et al. SGK integrates insulin and mineralocorticoid regulation of epithelial sodium transport. Am J Physiol. 2001;280:F303–313. doi: 10.1152/ajprenal.2001.280.2.F303. [DOI] [PubMed] [Google Scholar]
- 45.Blazer-Yost BL, Liu X, Helman SI. Hormonal regulation of ENaCs: Insulin and aldosterone. Am J Physiol. 1998;274:C1373–C1379. doi: 10.1152/ajpcell.1998.274.5.C1373. [DOI] [PubMed] [Google Scholar]
- 46.Juan CC, et al. Exogenous hyperinsulinemia causes insulin resistance, hyperendothelinemia, and subsequent hypertension in rats. Metabolism. 48:465–471. doi: 10.1016/s0026-0495(99)90105-1. [DOI] [PubMed] [Google Scholar]
- 47.Frisbee JC, Stepp DW. Impaired NO-dependent dilation of skeletal muscle arterioles in hypertensive diabetic obese Zucker rats. Am J Physiol. 2001;281:H1304–H1311. doi: 10.1152/ajpheart.2001.281.3.H1304. [DOI] [PubMed] [Google Scholar]
- 48.Morley JE, Mattammal MB. Nitric oxide synthase levels in obese Zucker rats. Neurosci Lett. 1996;209:137–139. doi: 10.1016/0304-3940(96)12622-7. [DOI] [PubMed] [Google Scholar]
- 49.Sechi LA, Bartoli E. Molecular mechanisms of insulin resistance in arterial hypertension Blood Press Suppl. 1996;1:47–54. [PubMed] [Google Scholar]
- 50.Ecelbarger CA, et al. Vasopressin-mediated regulation of epithelial sodium channel abundance in rat kidney. Am J Physiol. 2000;279:F46–F53. doi: 10.1152/ajprenal.2000.279.1.F46. [DOI] [PubMed] [Google Scholar]
- 51.Ecelbarger CA, Knepper MA, Verbalis JG. Increased abundance of distal sodium transporters in rat kidney during vasopressin escape. J Am Soc Nephrol. 2001;12:207–217. doi: 10.1681/ASN.V122207. [DOI] [PubMed] [Google Scholar]
- 52.Tiwari S, et al. Increased renal alpha-ENaC and NCC abundance and elevated blood pressure are independent of hyperaldosteronism in vasopressin escape. Am J Physiol. 2006;291:F49–F57. doi: 10.1152/ajprenal.00390.2005. [DOI] [PubMed] [Google Scholar]
- 53.Wade JB, et al. Localization and interaction of NHERF isoforms in the renal proximal tubule of the mouse. Am J Physiol. 285:C1494–C1503. doi: 10.1152/ajpcell.00092.2003. [DOI] [PubMed] [Google Scholar]
- 54.Song J, et al. Increased blood pressure, aldosterone activity, and regional differences in renal ENaC protein during vasopressin escape. Am J Physiol. 287:F1076–F1083. doi: 10.1152/ajprenal.00075.2004. [DOI] [PubMed] [Google Scholar]


