

Abstract
Proteomics has grown significantly with the aid of new technologies that consistently are becoming more streamlined. While processing of proteins from a whole cell lysate is typically done in a bottom-up fashion utilizing MS/MS of peptides from enzymatically digested proteins, top-down proteomics is becoming a viable alternative that until recently has been limited largely to offline analysis by tandem mass spectrometry. Here we describe a method for high-resolution tandem mass spectrometery of intact proteins on a chromatographic time scale. In a single liquid chromatography–tandem mass spectrometry (LC–MS/MS) run, we have identified 22 yeast proteins with molecular weights from 14 to 35 kDa. Using anion exchange chromatography to fractionate a whole cell lysate before online LC–MS/MS, we have detected 231 metabolically labeled (14N/15N) protein pairs from Saccharomyces cerevisiae. Thirty-nine additional proteins were identified and characterized from LC–MS/MS of selected anion exchange fractions. Automated localization of multiple acetylations on Histone H4 was also accomplished on an LC time scale from a complex protein mixture. To our knowledge, this is the first demonstration of top-down proteomics (i.e., many identifications) on linear ion trap Fourier transform (LTQ FT) systems using high-resolution MS/MS data obtained on a chromatographic time scale.
Proteomics has found a wide number of applications in fields from food science1 to the medical industry.2 Since its beginnings, mass spectrometry-based proteomics has been carried out in a bottom-up fashion. These experiments begin with two-dimensional gel electrophoresis (2DE) where proteins are separated on the basis of their isoelectric point and molecular weight, respectively.3 Protein spots are then excised to perform digests typically using trypsin. While a proven technology, 2DE is labor intensive and has been shown to preferentially visualize the most abundant proteins in a whole cell lysate while leaving proteins with low copy number and extremes in hydrophobicity or pI unresolved.4,5 Because of these difficulties, many proteomic efforts have looked to column-based separations to alleviate mixture complexity before MS analysis. Substantial strides have been made for bottom-up using the multidimensional protein identification technology (MuDPIT) approach.6 In this technique, ion-exchange and reversed-phase resins are packed within the confines of an electrospray tip for a two-dimensional online analysis of peptide mixtures. With the use of this front-end separation, well over 1000 proteins from Saccharomyces cerevisiae can be identified.6,7 While bottom-up analyses tend to be easier to implement, the ability to identify diverse modifications and their combinations can be difficult within a whole cell lysate. By fragmenting intact protein ions in the gas phase, top-down proteomics seeks to eliminate this weakness.
Top-down proteomics interrogates protein structure through measurement of an intact mass followed by direct ion dissociation in the gas phase.8 Studies using this approach have several advantages over peptide-driven studies, including high sequence coverage for the protein,9 the ability to study post-translational modifications (PTMs) as they occur in combination, and the ability to discern between gene products with a high degree of sequence identity.10,11 Although top-down studies are primarily performed offline, steps have been taken to minimize user intervention required for data acquisition while reducing the volume of uninformative spectra. For example, Forbes et al. were able to identify 80 proteins with 100% sequence coverage using semiautomated data acquisition of direct infusion samples.9 Patrie and co-workers were able to identify 101 proteins from the methane producing archaeon Methanosarcina acetivorans by conducting octopole collisionally activated dissociation (OCAD) on precursor species before sending fragment ions to the cell for high-resolution mass measurement.12 In the area of relative quantitation, it is possible to measure changes in PTMs by looking at the native form of a protein rather than after digestion. Du et al. have also introduced correction factors that allow (14N/15N) expression ratios to be calculated from protein mass spectra with low S/N (signal-to-noise).13,14
New advances in MS hardware are providing opportunities for accelerated progress, including a few on-line examples of protein detection4,15,16 or targeted top-down analysis.17–20 By combining electron-transfer dissociation (ETD) with the venerable approach of charge stripping fragment ions to mostly singly charged species,21 the Hunt lab was able to show proof-of-concept for top-down characterization utilizing a benchtop ion trap mass spectrometer.22 While very promising, this technique is currently limited to low resolution instrumentation and has been demonstrated using proteins isolated from purified Escherichia coli ribosomes.23 Emphasizing work with FTICR for protein profiling, Sharma et. al. have been able to identify 81 intact proteins from Shewanella oneidensis using databases from bottom-up work previously performed.24 From 714 protein forms, 81 identifications were inferred in this experiment using the “intact mass tag” concept.25 Other groups have combined the benefits of top-down and bottom-up strategies to accomplish large numbers of identifications in bacterial systems like S. oneidensis strain MR-1.26 With improving instrumentation and software widely available,27–29 the long-standing challenge for top-down of presenting the mass spectrometer with compatible samples at appropriate rates now comes into focus. This “front end” problem is less of an issue with bottom-up techniques because one or a few peptides from a diversity of proteins often make their way through existing work flows.30 While there is no single separation able to accommodate all proteins regardless of their hydrophobic character, Whitelegge and co-workers have implemented several solutions specifically geared toward intact membrane proteins.15
In this paper, we advance approaches for top-down proteomic analysis in both profiling and MS/MS modes from a whole cell lysate of S. cerevisiae using offline weak anion exchange chromatography (WAX) and online liquid chromatography–tandem mass spectrometry (LC–MS/MS). Mass spectrometric analyses were carried out using a linear ion trap Fourier transform (LTQ FT) mass spectrometer operating at 7 and 12 T. To maintain analysis speed, collisionally induced dissociation (CID) was used to produce fragment ions in the linear ion trap before transmission to the ICR cell. This method allows for a survey of protein expression from a metabolic labeling experiment where the incorporation of nitrogen isotopes (14N vs 15N) allows for the determination of protein expression ratios.13,31 Using this method, we have been able to identify proteins with molecular weights up to 35 kDa without the user intervention typical of top-down experiments. In addition, we also show the ability to localize PTMs using this online platform.
METHODS
Cell Preparation and Lysis
15N-labeled aerobic and 14N-labeled anaerobic cultures of S. cerevisiae strain JM43 (MATαleu2-3,112 his4-580 trp1-289 ura3-52 [ρ+]) were grown in a New Brunswick BioFlo III fermentor in minimal growth media as described previously13 using air or 2.5% CO2 in O2-free nitrogen as the sparge gas, respectively. Efficient 15N-labeling of aerobically expressed proteins was achieved using (15NH4)2SO4 (Sigma, St. Louis, MO) and 15N-labeled histidine, leucine, and tryptophan (Spectra Stable Isotopes, Columbia, MD) after ten generations of growth.13 During harvesting, the cells were quick-chilled to ~4 °C by passage through several feet of coiled copper tubing immersed in a salt–water ice bath, pelleted by centrifugation (5000g for 15 min at 4 °C), washed once with ice-cold Milli-Q water, flash-frozen in liquid N2, and stored at −80 °C. The flash frozen cells (~0.35 g) were lysed using glass beads after treatment with protease and phosphatase inhibitors. All samples were lysed in the presence of 50 mM Tris-HCl (pH 8). DTT was added to a final concentration of 100 mM after dilutions were prepared for protein assays using the bicinchoninic acid (BCA) method. DTT, urea and Tris-HCl were purchased from Fisher Scientific (Hanover Park, IL).
First Dimension Separation
Chromatography was performed offline using a 250 mm × 4.6 mm WAX column (Agilent, Palo Alto, CA) to separate 15 mg of total protein from a yeast whole cell lysate. For the purposes of relative quantitation, the 14N- and 15N-enriched lysates were mixed at a ratio of 1:1 prior to chromatography. A 95 min gradient run at 600 μL/min was used to elute proteins into a 96 well plate starting with an initial mobile phase of 50 mM Tris-HCl (pH 8). Ionic strength was increased linearly throughout the run using NaCl to a final concentration of 750 mM. Forty-five 1.2 mL fractions were stored at 4 °C for no more than 2 days before online analysis using a standard 7 T LTQ FT or a 12 T LTQ FT Ultra. Samples for the 12 T instrument were infused using a TriVersa nanomate from Advion Biosystems (Ithaca, NY) operating in a mode where fractions were collected in addition to infusion of the LC effluent directly into the mass spectrometer. Those for the 7 T instrument were infused using the ionmax source provided.
Y-PER Lysate from Yeast Cells
For the data of Figures 5 and 6, approximately 0.35 g of yeast cells were lysed using the protein extraction reagent Y-PER from Pierce (Rockford, MA). Three parallel Y-PER reactions were performed with the cell pellet at room temperature for 2 h using 1 mL of reagent to maximize the protein yield for LC–MS/MS analysis. After each reaction, the supernatant was removed and stored for subsequent purification. After all reactions were complete, the extraction reagent was removed from the combined supernatant using C4 SPE (solid-phase extraction) columns from J. T. Baker (Phillipsburg, NJ). After SPE, protein solutions were lyophilized and stored at −80 °C until needed for analysis. Lyophilized samples were resuspended in 50 mM Tris-HCl (pH 8) to a total volume of 500 μL. One hundred microliters of the sample was used for the LC–MS/MS run.
Figure 5.
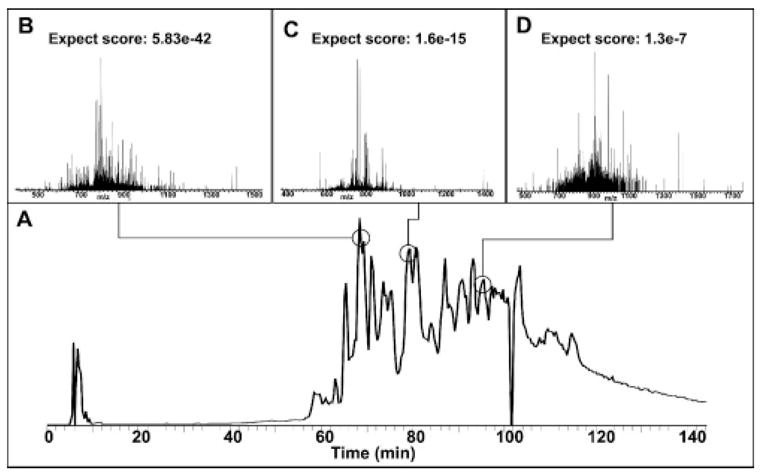
TIC and representative identifications from top-down mass spectral analysis of a Y-PER extract on a 12 T LTQ FT. Notice that even late in the run confident identifications could still be made (D). The anomaly at 100 min comes from loss of spray current.
Figure 6.
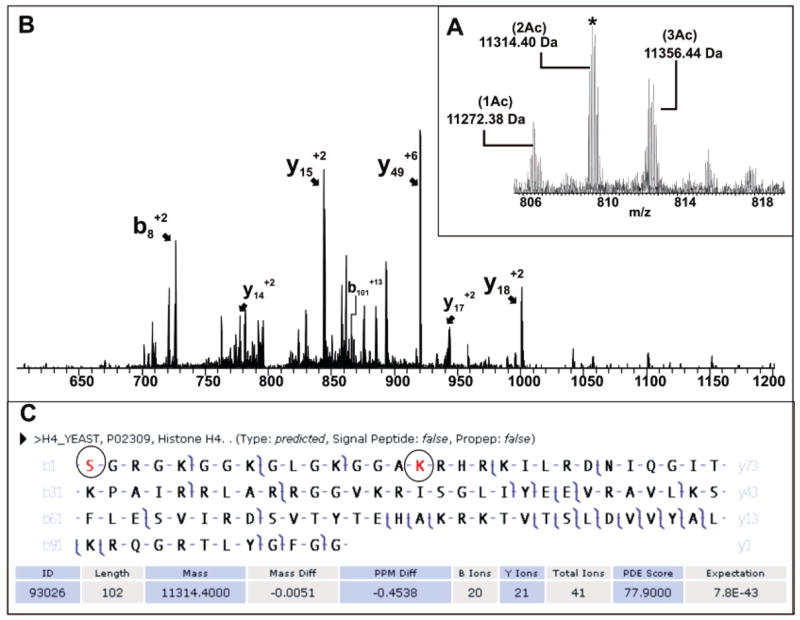
Yeast histone H4 analyzed by single-scan LC–MS/MS using an LTQ FT operating at 12 T. The diacetylated species at 809 m/z was isolated (A,*) and fragmented to give the MS/MS spectrum (B), with acetylation localized to the N-terminus and Lys16 (C).
Online LC–MS
Unless otherwise stated, all solvents were purchased from Fisher Scientific (Hanover Park, IL). All RPLC separations were accomplished using a Jupiter C5 column from Phenomenex (Torrence, CA), with an inner diameter of 1 mm and length of 150 mm. Initial conditions for the 95 min run were set at 95/5 (v/v) DDI water (solvent A) and 90/10 (v/v) acetonitrile and 2-propanol. Ion pairing reagents were 0.2% formic acid and 0.1% trifluoroacetic acid in both mobile phases. The column was kept at a temperature of 55 °C to enhance mass transfer during the separation. To minimize adduction of salts and ion-pairing reagents, a setting of 29 V was used for mild ion activation in the ESI source. The chromatographic gradient held initial conditions for 10 min followed by a ramp to 30% B over 10 min; 100% B was reached at 80 min and held for an additional 10 min before re-equilibrating to initial conditions.
The LTQ FT method consisted of four scan events. The initial event performed a full scan in the ion trap (profile mode). The second segment was used for a broadband high-resolution scan in the ICR cell. The final two events of the experiment were allotted for data dependent MS/MS scans. An isolation width of 7 m/z was used. The resolution setting for the last three scan events were kept at 100K. Tandem mass spectrometry settings used a normalized collision energy (NCE) value of 41% with a duration of 400 ms. The q-factor for all experiments was set at 0.5, and four microscans were used per each full scan taken in all modes. Charge state rejection was used to exclude precursors with 1, 2, or 3 charges. Dynamic exclusion was used for a duration of 1 min per precursor to avoid redundant fragmentation datasets.
Data Analysis
All data files (*.raw) were processed to group MS/MS data from different precursors of the same protein into one experiment for simultaneous analysis using an algorithm produced in house (cRAWler). Within this program, molecular weights of precursor and product ions were also determined using a highly modified THRASH algorithm.28 A compilation of this information (*.puf) was saved for batch digest searching using ProSightPC. Files that warranted manual interrogation were searched using ProSight PTM v1.029 after making the necessary intact protein mass file (*.prl) and associated MS/MS fragment file (*.pkl). In the manual route, Xtract (Thermo) was used to calculate monoisotopic masses of the protein and all fragment ions. The details for data analysis are briefly summarized in Figure 1. Initial searches (absolute mass) were performed searching the entire database. Identifications that could not be assigned unambiguously were validated using single protein mode to account for errors in determination of a protein’s monoisotopic mass. Identification cutoffs were set at an expectation value (“P-score”) of less than 0.001 for all identifications.27 Fragment ions for all MS/MS scans were required to have a S/N ratio of 5:1 or greater to be considered in database searching. The mass tolerance for fragment ions was ±5 ppm.
Figure 1.
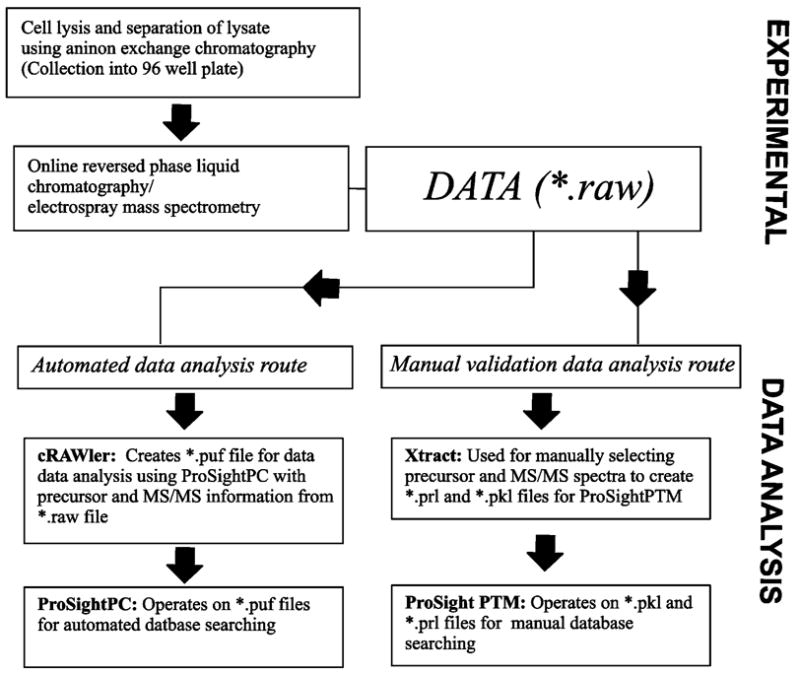
Workflow for LC–MS data summarizing steps taken for automated (bottom left) and manual (bottom right) data processing of LC–MS/MS data.
RESULTS AND DISCUSSION
Online MS/MS Using an LTQ FT at 7 T
Metabolic labeling using 15N has been established for relative quantitation in many bottom-up31,32 and a few top-down studies as well.13,20 The coelution of the “heavy” and “light” forms of the same protein from an HPLC column makes relative quantitation straightforward. For our experiments, 14N/15N metabolic labeling produced the mass spectrum shown in Figure 2a,b of an 8.6 kDa protein pair as it elutes from the column in an LC–MS/MS experiment. Note in Figure 2b the shift toward higher m/z for the 15N-containing member of the pair. This mass difference is 104 Da which is within 1 Da of the 105 nitrogen atoms in the molecule.13 Figure 2c,d illustrates the single scan MS/MS spectra from CID fragment ions and the corresponding graphical fragment map. With a total of 55 ions matched and 13 complementary ion pairs, the expectation score of 1 × 10−73 signifies an extremely confident identification of yeast ubiquitin. Results of this type illustrate a reduced amount of user intervention needed for offline top-down proteomics work. While the ability to gain MS/MS-based identifications on a protein in an automated fashion is a main goal, a secondary goal is to use this platform for protein profiling. When the samples are mixed in a 1:1 ratio, a whole cell lysate was separated using weak anion exchange chromatography followed by LC–MS/MS.
Figure 2.
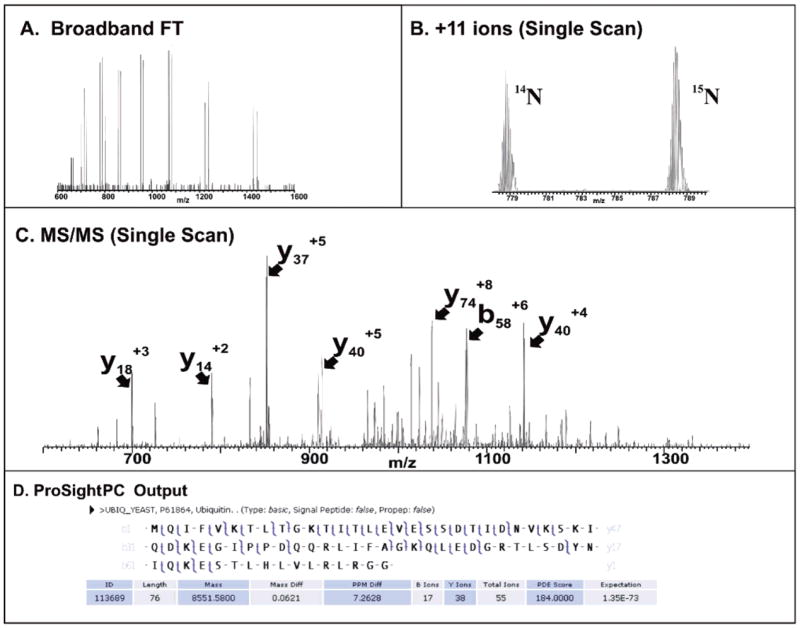
(A) Broadband FT mass spectrum and (B) 11+ protein charge state pair acquired at 7 T. (C) Single scan CID MS/MS data and (D) graphical fragment map showing fully automated identification of yeast ubiquitin.
Two-Dimensional Separation of Metabolically Labeled Proteins
From online analyses of 30 anion exchange fractions by LC–MS/MS, 231 unique protein pairs and 300 different protein forms were detected. Protein molecular weight ranges spanned 7.7–44.6 kDa. Thirty-nine protein identifications resulted from data-dependent CID and are shown in Table 1. When the labeled lysates are mixed in a 1:1 ratio, it is possible that the mass spectrometer may fragment the 15N-enriched species of a protein pair producing spectra that were not able to be automatically searched at the time of this study. Adaptation of our algorithms will enable identification of 15N-labeled protein forms. During automated experiments, precursors are selected based upon relative intensity during the ion trap full scan. Because of this, the instrument often fragmented two charge states from the same protein before seeking other candidates. As a solution to this problem during future experiments, knowledge of protein mass during acquisition33 will form exclusion lists of highly abundant known proteins to increase the number of identifications from automated LC–MS/MS experiments.
Table 1.
Thirty-Eight Protein Identifications from a Two-Dimensional Separation of Metabolically Labeled Lysates (14N-Anaerobic, 15N-Aerobic) Run on a 7 T LTQ FTa
| Accession | ORF | Standard name | product description | Intact mass (Da) | Expect score | ratios |
|---|---|---|---|---|---|---|
| P22943 | YFL014W | HSP12 | heat shock protein 12 | 11 693.1 | 2 × 10⁻²⁰ | 1.00 |
| P22803 | YGR209C | TRX2 | thioredoxin 2 | 11 204.0 | 2 × 10⁻¹⁸ | 0.89 |
| P22217 | YLR043C | TRX1 | thioredoxin 1 | 11 235.0 | 4 × 10⁻¹⁵ | 0.90 |
| P38804 | YHR087W | - | YHR087 | 12 000.0 | 8 × 10⁻⁹ | 0.93 |
| P61864 | YLL039C | UB14 | Unbiquitin | 8 552.5 | 4 × 10⁻²⁷ | 0.95 |
| P01094 | YMR174C | PAI3 | inhibitor of proteinase Pep4p | 7 744.8 | 3 × 10⁻¹⁰ | 0.94 |
| P01095 | YNL015W | PBI2 | proteinase inhibitor B | 8 590.1 | 9 × 10⁻⁸ | 0.95 |
| P31787 | YGR037C | ACB1 | Acyl-CoA binding protein | 9 929.3 | 3 × 10⁻⁶ | >200:1 |
| Q3E754 | YJL136C | RPS21B | ribosomal protein S21B | 9 760.2 | 6 × 10⁻⁹ | 0.90 |
| P48606 | YOR265W | RBL2 | tubulin folding cofactor A | 12 379.9 | 3 × 10⁻⁸ | 0.99 |
| Q12306 | YDR510W | SMT3 | SUMO protein | 11 597.0 | 3 × 10⁻⁷ | 0.99 |
| Q04401 | YDR511W | ACN9 | acetate nonutilizing protein 9 | 15 783.0 | 5 × 10⁻⁶ | 0.98 |
| Q03048 | YLL050C | COF1 | Cofilin | 15 901.0 | 1 × 10⁻¹² | 0.98 |
| P14832 | YDR155C | CPR1 | Cyclophilin | 17 391.3 | 2 × 10⁻⁷ | 0.89 |
| P40202 | YMR038C | CCS1 | copper chaperone | 15 713.0 | 7 × 10⁻⁵ | 0.90 |
| P00942 | YDR050C | TPI1 | triosphosphate isomerase | 26 794.0 | 8 × 10⁻⁷ | 0.92 |
| P07170 | YDR226W | ADK1 | adenylate kinase | 24 254.0 | 3 × 10⁻¹⁰ | 0.99 |
| P25373 | YCL035C | GRX1 | Glultaredoxin | 12 380.0 | 8 × 10⁻¹⁰ | 0.99 |
| P53141 | YGL106W | MLC1 | myosin Myo2p light chain | 16 444.0 | 2 × 10⁻¹⁸ | 0.99 |
| P33331 | YER009W | NTF2 | nuclear transporter factor | 14 453.7 | 5 × 10⁻⁹ | 0.99 |
| P38706 | YDR471W | RPL27B | 60S ribosomal protein L27B | 15 505.7 | 9 × 10⁻⁹ | 0.99 |
| P04649 | YDL075 | RPL31A | ribosomal protein L31A | 12 953.3 | 7 × 10⁻⁷ | 0.95 |
| P40525 | YIL052C | RPL34B | ribosomal protein L34B | 13 641.3 | 4 × 10⁻¹⁹ | 0.92 |
| P26781 | YDR025W | RPS11A | ribosomal protein S11A | 17 749.0 | 1 × 10⁻⁹ | 0.93 |
| P53143 | YGL102C | - | hypothetical 16 kDa protein | 16 176.0 | 3 × 10⁻⁵ | 0.96 |
| Q12344 | YPL249C | GYP5 | GTPase activating protein | 11 135.8 | 8 × 10⁻⁹ | 0.98 |
| P39741 | YDL191W | RPL35A | 60S ribosomal protein L35A | 13 909.0 | 1 × 10−72 | 0.97 |
| P02406 | YGL103W | RPL28 | 60S ribosomal protein L28 | 16 577.0 | 3 × 10⁻³³ | 0.95 |
| P26782 | YER074W | RPS24A | 60S ribosomal protein S24A | 15 329.0 | 6 × 10⁻¹⁶ | 0.95 |
| P47913 | YOR312C | RPL20B | 60S ribosomal protein L20B | 20 713.0 | 2 × 10⁻¹⁰ | 0.99 |
| P02407 | YML024W | RPS17A | 40S ribosomal protein S17A | 15 788.0 | 3 × 10⁻⁷ | 0.99 |
| P40213 | YDL083C | RPS16B | 40S ribosomal protein 16B | 15 847.2 | 1 × 10⁻¹⁴ | 0.99 |
| Q01855 | YOL040C | RPS15 | 40S ribosomal protein S15 | 15 902.5 | 5 × 10⁻⁷ | 0.99 |
| P05756 | YDR064W | RPS13 | 40S ribosomal protein S13 (S27A) | 17 029.3 | 2 × 10⁻⁶ | 0.97 |
| Q08745 | YOR293W | RPS10A | 40S ribosomal protein S10A | 12 739.1 | 1 × 10⁻¹¹ | 0.92 |
| P29453 | YLL045C | RPL8B | 60S ribosomal protein L8B | 28 111.5 | 1 × 10⁻⁹ | 0.93 |
| P39990 | YEL026W | SNU13 | U3 SnoRNP Protein | 13 569.4 | 2 × 10⁻¹⁷ | 0.96 |
| P05318 | YDL081C | RPP1A | acidic ribosomal protein P1A | 10 908.1 | 4 × 10⁻⁹ | 0.96 |
The 14N/15N ratio for Acb1p (acyl-CoA binding protein) could not be accurately determined due to low expression of the 15N enriched form.
The average ratio for all protein pairs identified was 0.96.
Protein and PTM Relative Expression
In an offline manner, metabolic labeling on the protein level has been proven with detection of four “non 1:1” ratios out of fifty such measurements from yeast grown in aerobic versus anaerobic conditions.13 Of the 231 pairs observed from online studies, only ~1% had ratios deviating from 1:1, with the most extreme difference shown as a 10 kDa protein singlet in Figure 3a. The fragmentation data of Figure 3b (produced after isolation of the most intense charge state) identified acyl-CoA binding protein with 11 out of 16 possible fragment ions matching for a P-score of 3 × 10⁻⁶. This protein is up-regulated under anaerobic growth at least 200-fold.
Figure 3.
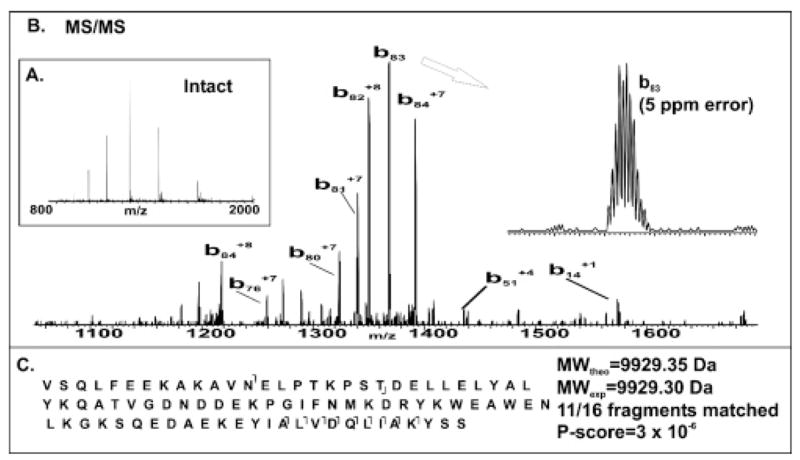
Identification of Acb1p (Acyl-CoA binding protein; YGR037C) where expression of the 15N-labeled component was undetectable. (A) Intact FT mass spectrum and (B) fragmentation data are also shown (7 T). (C) The graphical fragmentation map and database search results.
Protein Pair Complexity at Higher Molecular Weight
Figure 4 shows the full scan mass spectra taken in the ion trap for three proteins with molecular weights of 35.4, 17.3, and 44.6 kDa. A hydrophobic 44 kDa protein pair is clearly visible and would be missed if full scan ion trap spectra were not taken. Although it is difficult to attain high-resolution spectra of larger proteins in an LC–MS/MS experiment, the use of ion trap data from hybrid instruments can yield information useful for offline sample analysis so that protein pairs with molecular weights beyond 35 kDa can be measured. With simultaneous fraction collection during the online run, we project that offline analysis of large proteins at high resolution will be viable with automated data acquisition.
Figure 4.
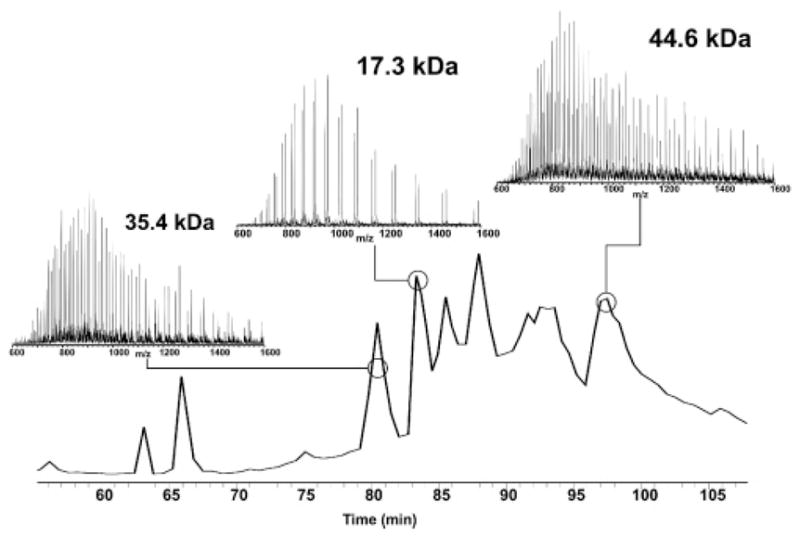
TIC from full scan ion trap spectra obtained on a 7 T LTQ FT. Although not identified, high MW protein pairs are shown up to 44.6 kDa. Molecular weights were calculated via manual deconvolution.
Online Top-Down Proteomics
To test platform stability and the ability to perform MS/MS on an LC time scale, a complex mixture obtained from Y-PER extraction was subjected to LC–MS/MS without additional fractionation. Table 2 shows 22 identified proteins from a single automated 12 T run. Molecular weights for the proteins identified range from 14 to 35 kDa. While 19 of the identifications were made with a standard absolute mass search in ProSight PC, 3 out of the 22 required manual validation of the protein’s intact mass and were verified in single protein mode with fragmentation data from their associated files. In this experiment, 46 additional protein forms were observed but not fragmented with molecular weights ranging from 17 to 40 kDa. As protein hydrophobicity increases (i.e., those with late RPLC elution times), it becomes difficult to obtain rich fragmentation data on an LC time scale that uniquely identifies the parent protein. Figure 5b–d reflect this fact with lower quality expectation scores that are still able to automatically identify several proteins late into the LC run.
Table 2.
List of 22 Identifications from a 12T LTQ FT LC–MS/MS Experiment of Soluble Yeast Proteins
| accession | ORF | standard name | protein description | PTM location | Expect score | intact mass (Da) | fragments matched |
|---|---|---|---|---|---|---|---|
| P38706 | YDR471W | RPL27B | 60S ribosomal protein L27B | None | 2 × 10−38 | 15 505.3 | 34 |
| P00359 | YGR192C | TDH3 | glyceraldehyde-3-phosphate dehydrogenase | None | 3 × 10⁻⁹ | 35 740.3 | 6 |
| P36105 | YKL006W | RPL14A | 60S ribosomal protein L14A | acetylation, S1 | 6 × 10⁻⁹ | 15 168.6 | 7 |
| P53030 | YPL220W | RPL1A | 60S ribosomal protein L1 | acetylation, S1 | 3 × 10⁻⁵ | 24 487.0 | 14 |
| P07279 | YOL120C | RP28A | 60S ribosomal protein L18A (RP28) | None | 9 × 10⁻¹¹ | 20 562.0 | 41 |
| P05755 | YBR189W | RPS9B | 40S ribosomal protein S9B | None | 7 × 10⁻⁸ | 22 296.3 | 20 |
| P24000 | YGR148C | RPL24B | 60S ribosomal protein L24B | acetylation, M1 | 9 × 10⁻⁷ | 17 547.6 | 11 |
| P05743 | YLR344W | RPL26A | 60S ribosomal protein L26A | None | 2 × 10⁻²⁷ | 14 234.0 | 29 |
| Q01855 | YOL040C | RPS15 | 40S ribosomal protein S15 | acetylation, S1 | 2 × 10⁻¹⁵ | 15 992.5 | 19 |
| P26782 | YER074W | RPS24A | 40S ribosomal protein S24 | acetylation, S1 | 2 × 10⁻³³ | 15 329.4 | 34 |
| O14455 | YPL249C-A | RPL36B | 60S ribosomal protein L36B | none, Met-off | 3 × 10⁻²⁶ | 11 135.2 | 25 |
| P04449 | YGL031C | RPL24A | 60S ribosomal protein L24A | None | 7 × 10⁻⁶ | 17 612.9 | 10 |
| Q3E7Y0 | YMR242C | RPL20A | 60S ribosomal protein L20A | acetylation, P1 | 1 × 10⁻⁴ | 21 133.3 | 10 |
| P05739 | YLR448W | RPL6B | 60S ribosomal protein L6B | None | 1 × 10⁻⁸ | 19 843.1 | 12 |
| P05754 | YBL072C | RPS8A | 40S ribosomal protein S8A | absolute mass | 5 × 10⁻⁴ | 22 344.9 | 10 |
| P05740 | YKL180W | RPL17A | 60S ribosomal protein L17A | None | 1 × 10⁻¹² | 20 549.2 | 19 |
| P32827 | YGR118W | RPS23A | 40S ribosomal protein S23A | None | 3 × 10⁻²⁴ | 15 896.8 | 26 |
| Q02326 | YML073C | RPL6A | 60S ribosomal protein L6A | acetylation, S1 | 4 × 10⁻⁹ | 19 960.1 | 13 |
| P05737 | YGL076C | RPL7A | 60S ribosomal protein L7A | None | 1 × 10⁻⁷ | 27 636.2 | 11 |
| P04456 | YOL127W | RPL25 | 60S ribosomal protein L25 | None | 3 × 10⁻⁷ | 15 757.0 | 12 |
| Q6B1U3 | YBR010W | HHT1 | histone H3 | None | 2 × 10⁻⁶ | 15 356.6 | 8 |
| P38701 | YHL015W | RPS20 | 40S ribosomal protein S20 | acetylation, S1 | 1 × 10⁻⁶ | 13 907.2 | 9 |
Online Experiments with Highly Modified Proteins
Figure 6 shows the spectra of a protein with a combined intact mass of 11 314.40 Da and 41 fragment ions, which was unambiguously identified with an expectation score of 8 × 10−43 as histone H4 (Hhf1p). Putative mono-, di- and triacetylated species can be seen in the broadband mass spectrum (Figure 6a) at 11 272.38, 11 314.40, and 11 356.44 Da, respectively. However, only the diacetylated species was selected to be fragmented during the run. Histone H4 was identified with localization of two modification sites. Specifically, the diacetylated form of this protein was fragmented to localize the modifications to the N-terminus and Lys16. For the selected precursor, an identification has been made in addition to PTM localization in a single LC–MS/MS scan. Full characterization of all modifications of this protein (i.e., mono and triacetylated species) can be carried out in targeted offline analysis.
Top-Down Experiments with Respect to Database Size and Mass Accuracy
Current literature has shown that top-down experiments can be carried out using low resolution instruments.23,34 Using the scoring algorithm published previously,27 we consider all possible expectation values for 50 observed fragment ions at the mass tolerances of ±5 Da, ±1 Da, and ±5 ppm (Supporting Information Figure 1). For the S. cerevisiae database using typical mass accuracy values for searching ion trap data, Supporting Information Figure 1a shows that greater than 17 out of 50 total fragment ions need to match for confident identification of a protein with the same scoring cutoff of 0.001 used in this paper. With a 5 ppm mass tolerance for fragment ions, seven or more fragment ions are needed before a protein form can be uniquely identified. At a mass accuracy of 5 Da, greater than 32 matching fragment ions are needed to identify a protein. With the use of collisional dissociation with subsequent charge reduction of the fragment ions to their singularly charged forms,35 a fragment tolerance of 10 Da was allowed. Considering human top- down databases with greater than one million protein forms, very similar numbers as yeast are obtained because expectation values scale only linearly with database size (Supporting Information Figure 1b). At present, it seems that ion trap mass spectrometers detect more fragment ions on a chromatographic time scale while Fourier transform instruments yield better confidence in matches from fewer matching fragment ions. In either case, it is clear that implementation of top-down in higher eukarya benefits from having the correct protein form in the database. Thus, the strategy of “shotgun annotation” implemented in the ProSight database architecture provides the basis for maximizing the number of fragment ions that match during a search. Technological improvements in FTMS36 will increase the number of fragment ions detected in high resolution top-down experiments in the coming years owing to more efficient ion transfer between the ion trap and the analyzer. At present, it is reasonable to say that low- and high-resolution instruments (and hybrids of both) will have significant impact for top-down LC–MS/MS experiments needed to assay interesting proteins that are expressed at low copy numbers.
CONCLUSIONS
In this paper, 22 proteins were identified from a single LC–MS/MS run using online top-down proteomics on a yeast whole-cell lysate. When this experiment was extended to metabolically labeled proteins mixed at a ratio of 1:1, 231 protein pairs were readily detectable of which 38 proteins were unambiguously identified from high-resolution MS/MS data. The diacetylated form of histone H4 was also fully characterized in an automated LC–MS/MS experiment. Future prospects for this platform at molecular weights higher than 35 kDa have also been shown by utilizing ion trap full scan mass spectra. Until now, top-down proteomics with high-resolution MS/MS fragmentation has been limited mainly to offline data acquisition. We have demonstrated proof-of-concept for high throughput top-down proteomics with identifications made from the measurement of high-resolution MS/MS fragment ions in an online fashion. In later stages of this work, efforts will be made to reduce the duty cycle of the experiment by using other fragmentation techniques or tandem MSn schemes.19,29 With this work and contributors from other laboratories, diverse types of mass analysis, including orbitraps,36 time-of-flight, and benchtop ion traps, will all be combined to increase the throughput for routine top-down interrogation of complex protein mixtures.
Acknowledgments
The authors gratefully acknowledge the National Institutes of Health (Grant GM067193-04 to N.L.K. and Grant GM59826 to K.E.K.), the Packard Foundation, the Research Corporation (Cottrell Teacher Scholar Award), and the Sloan Foundation for generous support. We also thank Michael Senko, Vlad Zabrouskov, George Stafford, Reinhold Pesch, Andreas Wieghaus, Steven Horning, Olver Lange, and Iain Mylchreest for support of the 12 T LTQ FT and Dr. Richard LeDuc for assistance with Supporting Information Figure 1. Funding has also been provided from the UIUC Center of Cell–Cell Signaling and Neuroproteomics (Grant P30DAO18310-02). P.M.T. was supported by the NIH under Ruth L. Kirschstein NRSA 5 T32 GM070421 from the National Institute of General Medical Sciences. We also thank Dr. Chris Hendrickson for his expertise and advice during the construction of the 12 T LTQ FT.
Footnotes
SUPPORTING INFORMATION AVAILABLE
Additional information as noted in text. This material is available free of charge via the Internet at http://pubs.acs.org.
References
- 1.Wang J, Li D, Dangott LJ, Wu G. J Nutr. 2006;136:1759–1762. doi: 10.1093/jn/136.7.1759. [DOI] [PubMed] [Google Scholar]
- 2.Schulenborg T, Schmidt O, van Hall A, Meyer HE, Hamacher M, Marcus K. J Neural Transm. 2006;113:1055–1073. doi: 10.1007/s00702-006-0512-8. [DOI] [PubMed] [Google Scholar]
- 3.O’Farrel PHO. J Biol Chem. 1975;250:4007. [PMC free article] [PubMed] [Google Scholar]
- 4.Gorg A, Obermaier C, Boguth G, Harder A, Scheibe B, Wildgruber R, Weiss W. Electrophoresis. 2000;21:1037–1053. doi: 10.1002/(SICI)1522-2683(20000401)21:6<1037::AID-ELPS1037>3.0.CO;2-V. [DOI] [PubMed] [Google Scholar]
- 5.Rabilloud T. Proteomics. 2002;2:3–10. [PubMed] [Google Scholar]
- 6.Wolters DA, Washburn MP, Yates JR. Anal Chem. 2001;73:5683–5690. doi: 10.1021/ac010617e. [DOI] [PubMed] [Google Scholar]
- 7.de Godoy LMF, Olsen JV, de Souza GA, Li G, Mortensen P, Mann M. GenomeBiol. 2007;7:R50. doi: 10.1186/gb-2006-7-6-r50. [DOI] [PMC free article] [PubMed] [Google Scholar]
- 8.Kelleher NL. Anal Chem. 2004;76:196A–203A. [PubMed] [Google Scholar]
- 9.Forbes AJ, Patrie SM, Taylor GK, Kim YB, Jiang L, Kelleher NL. Proc Natl Acad Sci USA. 2004;101:2678–2683. doi: 10.1073/pnas.0306575101. [DOI] [PMC free article] [PubMed] [Google Scholar]
- 10.Boyne MT, II, Pesavento JJ, Mizzen CA, Kelleher NL. J Proteome Res. 2006;5:248–253. doi: 10.1021/pr050269n. [DOI] [PubMed] [Google Scholar]
- 11.Siuti N, Roth MJ, Mizzen CA, Kelleher NL, Pesavento JJ. J Proteome Res. 2006;5:233–239. doi: 10.1021/pr050268v. [DOI] [PubMed] [Google Scholar]
- 12.Patrie SM, Ferguson JT, Robinson DE, Whipple D, Rother M, Metcalf WW, Kelleher NL. Mol Cell Proteomics. 2006;5:14–25. doi: 10.1074/mcp.M500219-MCP200. [DOI] [PubMed] [Google Scholar]
- 13.Du Y, Parks BA, Sohn S, Kwast KE, Kelleher NL. Anal Chem. 2006;78:686–694. doi: 10.1021/ac050993p. [DOI] [PubMed] [Google Scholar]
- 14.Pesavento JJ, Mizzen CA, Kelleher NL. Anal Chem. 2006;78:4271–4280. doi: 10.1021/ac0600050. [DOI] [PubMed] [Google Scholar]
- 15.Whitelegge J, Laganowsky A, Nishio J, Souda P, Zhang H, Cramer W. J Exp Bot. 2006;57:1515–1522. doi: 10.1093/jxb/erj163. [DOI] [PubMed] [Google Scholar]
- 16.Qiu Y, Kathariou S, Lubman DM. Proteomics. 2006;6:5221–5233. doi: 10.1002/pmic.200600071. [DOI] [PubMed] [Google Scholar]
- 17.Valaskovic GA, Kelleher NL, McLafferty FW. Science. 1996;273:1199–1202. doi: 10.1126/science.273.5279.1199. [DOI] [PubMed] [Google Scholar]
- 18.Wu SL, Jardine I, Hancock WS, Karger BL. Rapid Commun Mass Spectrom. 2004;18:2201–2207. doi: 10.1002/rcm.1609. [DOI] [PubMed] [Google Scholar]
- 19.Zubrouskov V, Senko MW, Du Y, LeDuc RD, Kelleher NL. J Am Soc Mass Spectrom. 2005;16:2027–2038. doi: 10.1016/j.jasms.2005.08.004. [DOI] [PMC free article] [PubMed] [Google Scholar]
- 20.Conrads TP, Alving K, Veenstra TD, Belov ME, Anderson GA, Anderson DJ, Lipton MS, Pasa-Tolic L, Udseth HR, Chrisler WB, Thrall BD, Smith RD. Anal Chem. 2001;73:2132–2139. doi: 10.1021/ac001487x. [DOI] [PubMed] [Google Scholar]
- 21.Reid GE, McLuckey SA. J Mass Spectrom. 2002;37:663–675. doi: 10.1002/jms.346. [DOI] [PubMed] [Google Scholar]
- 22.Coon JJ, Ueberheide B, Syka JEP, Dryhurst DD, Ausio J, Shabanowitz J, Hunt DF. Proc Natl Acad Sci USA. 2005;102:9463–9468. doi: 10.1073/pnas.0503189102. [DOI] [PMC free article] [PubMed] [Google Scholar]
- 23.Chi A, Bai DL, Geer LY, Shabanowitz J, Hunt DF. Int J Mass Spectrom Ion Processes. 2007;259:197–203. doi: 10.1016/j.ijms.2006.09.030. [DOI] [PMC free article] [PubMed] [Google Scholar]
- 24.Sharma S, Simpson DC, Tolic N, Jaitly N, Mayampurath AM, Smith RD, Pasa-Tolic L. J Proteome Res. 2006;6:602–610. doi: 10.1021/pr060354a. [DOI] [PubMed] [Google Scholar]
- 25.Whitelegge JP. Plant Physiol Biochem. 2004;42:919–927. doi: 10.1016/j.plaphy.2004.11.005. [DOI] [PubMed] [Google Scholar]
- 26.VerBerkmoes NC, Bundy JL, Hauser L, Asano KG, Razumovskaya J, Larimer F, Hettich RL, Stephenson JL. J Proteome Res. 2002;1:239–252. doi: 10.1021/pr025508a. [DOI] [PubMed] [Google Scholar]
- 27.Meng F, Cargile BJ, Miller LM, Forges AJ, Johnson JR, Kelleher NL. Proc Natl Acad Sci USA. 2001;19:952–957. doi: 10.1038/nbt1001-952. [DOI] [PubMed] [Google Scholar]
- 28.Horn D, Zubarev R, McLafferty F. J Am Soc Mass Spectrom. 2000;11:320–332. doi: 10.1016/s1044-0305(99)00157-9. [DOI] [PubMed] [Google Scholar]
- 29.Taylor GK, Kim YB, Forbes AJ, Meng F, McCarthy R, Kelleher NL. Anal Chem. 2003;75:4081–4086. doi: 10.1021/ac0341721. [DOI] [PubMed] [Google Scholar]
- 30.Steen H, Mann M. Nat Rev Mol Cell Biol. 2004;5:699–711. doi: 10.1038/nrm1468. [DOI] [PubMed] [Google Scholar]
- 31.Oda Y, Huang K, Cross FR, Cowburn C, Chait BT. Proc Natl Acad Sci USA. 1999;96:6591–6596. doi: 10.1073/pnas.96.12.6591. [DOI] [PMC free article] [PubMed] [Google Scholar]
- 32.Grunenfelder B, Rummel G, Vohradsky J, Roder D, Langen H, Jenal U. Proc Natl Acad Sci USA. 2001;98:4681–4686. doi: 10.1073/pnas.071538098. [DOI] [PMC free article] [PubMed] [Google Scholar]
- 33.Johnson JR, Meng F, Forbes AJ, Cargile BJ, Kelleher NL. Electrophoresis. 2002;23:3217–3223. doi: 10.1002/1522-2683(200209)23:18<3217::AID-ELPS3217>3.0.CO;2-K. [DOI] [PubMed] [Google Scholar]
- 34.Chi A, Huttenhower C, Geer LY, Coon JJ, Syka JEP, Bai DL, Shabanowitz J, Burke DJ, Troyanskaya OG, Hunt DF. Proc Natl Acad Sci USA. 2007;104:2193–2198. doi: 10.1073/pnas.0607084104. [DOI] [PMC free article] [PubMed] [Google Scholar]
- 35.Amunugama R, Hogan JM, Newton KA, McLuckey SA. Anal Chem. 2004;76:720–727. doi: 10.1021/ac034900k. [DOI] [PubMed] [Google Scholar]
- 36.Scigelova M, Makarov A. Proteomics. 2006;6(Suppl S2):16–21. doi: 10.1002/pmic.200600528. [DOI] [PubMed] [Google Scholar]