Abstract
Integral membrane proteins are notoriously difficult to identify and analyze by mass spectrometry because of their low abundance and limited number of trypsin cleavage sites. Our strategy to address this problem is based on a novel technology for MALDI-MS peptide sample preparation that increases the success rate of membrane protein identification by increasing the sensitivity of the MALDI-TOF system. For this, we used sample plates with predeposited matrix spots of CHCA crystals prepared by vacuum sublimation onto an extremely low wettable (ultraphobic) surface. In experiments using standard peptides, an up to 10-fold gain of sensitivity was found for on-chip preparations compared with classical dried-droplet preparations on a steel target. In order to assess the performance of the chips with membrane proteins, three model proteins (bacteriorhodopsin, subunit IV(a) of ATP synthase, and the cp47 subunit from photosystem II) were analyzed. To mimic realistic analysis conditions, purified proteins were separated by SDS-PAGE and digested with trypsin. The digest MALDI samples were prepared either by dried-droplet technique on steel plates using CHCA as matrix, or applied directly onto the matrix spots of the chip surface. Significantly higher signal-to-noise ratios were observed for all of the spectra resulting from on-chip preparations of different peptides.
In a second series of experiments, the membrane proteome of Rhodococcus jostii RHA1 was investigated by AIEC/SDS-PAGE in combination with MALDI-TOF MS/MS. As in the first experiments, Coomassie-stained SDS-PAGE bands were digested and the two different preparation methods were compared. For preparations on the Mass·Spec·Turbo Chip, 43 of 60 proteins were identified, whereas only 30 proteins were reliably identified after classical sample preparation. Comparison of the obtained Mascot scores, which reflect the confidence level of the protein identifications, revealed that for 70% of the identified proteins, higher scores were obtained by on-chip sample preparation. Typically, this gain was a consequence of higher sequence coverage due to increased sensitivity.
Keywords: MALDI, sample preparation, chip, membrane proteomics
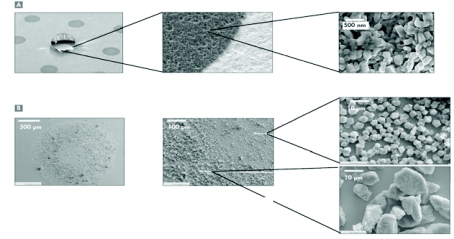
Due to their low abundance and limited number of trypsin cleavage sites, integral membrane proteins are difficult to identify and analyze by mass spectrometry (MS).1 Our approach to tackle this problem is based on increasing the sensitivity of matrix-assisted laser desorption/ionization–time of flight MS (MALDI-MS) analysis by a specially designed chip. This chip features a MALDI target plate with predeposited matrix spots of α-cyano-4-hydroxycinnamic acid (CHCA) crystals prepared by vacuum sublimation onto an ultra-phobic surface (Mass Spec Turbo Chips; Qiagen, Hilden, Germany). The vacuum sublimation procedure with contact masks positioned above the surface results in an extremely pure layer of submicronsize CHCA crystals forming precisely defined matrix spots with respect to size, shape, and location (Figure 1A). Basically, the sample application on these matrix spots resembles the thin layer sample preparation technique2 and allows the concentration of peptides in the top layers of the matrix, thereby providing high MS sensitivity. Additionally, the steep wettability gradient between the ultraphobic surrounding and the hydrophilic matrix spot provides optimal guidance for automated sample deposition, which is particularly important for automated workflows, such as high-throughput gel-based systems and liquid chromatography (LC)-MALDI approaches.
FIGURE 1.
A: Scanning electron micrograph of chip with sublimated α-cyano-4-hydroxycinnamic acid matrix surrounded by ultraphobic self-assembled monolayer surface. B: Scanning electron micrograph of classical dried-droplet α-cyano-4-hydroxycinnamic acid preparation on a stainless steel target.
The performance of this chip approach in membrane proteomics procedures was first tested using three model proteins; bacteriorhodopsin, subunit IV(a) of ATP synthase, and the cp47 subunit from photosystem II. In addition, the chip performance was tested with a complex membrane proteome sample from the bacterium Rhodococcus jostii RHA1, a soil actinomycete that catabolizes a wide range of compounds and represents a genus of considerable industrial interest. R. jostii RHA1 is probably best known for its potent ability to transform polychlorinated biphenyls (PCBs), although it can use a remarkably broad range of organic compounds as growth substrates.3,4 In this work, the recently developed membrane proteome separation technology based on ion-exchange chromatography and SDS-PAGE5 was applied to separate the membrane proteins prior to identification by MALDI-TOF MS/MS. Depending on the MALDI sample preparation, up to 43 different proteins (integral membrane proteins and membrane-associated proteins as well as cytoplasmic contaminants) were identified. Our results showed that compared with dried-droplet preparations on stainless steel plates, more integral membrane proteins were identified with higher confidence using the chip approach.
METHODS
Strains and Media
R. jostii RHA1 was grown at 30°C in W medium4 supplemented with 20 mM pyruvate. The strain was precultured in 50 mL medium (250 mL flasks) to mid-log phase (determined by optical density at 600 nm), used to inoculate 1 L fresh medium in 2-L flasks, further cultured to late log phase (1.8 OD at 600 nm), and harvested.
AIEC/SDS-PAGE
For details see Schluesener et al.5 Briefly, cells were disrupted by French press passage and membranes washed with 2.5 M NaBr to remove membrane-associated proteins. The resulting membrane fraction was solubilized in buffer containing 2% (w/v) amidosulfobetaine 14 (ASB-14) and 1.2 mg protein was applied to an anion exchange column (Poros20 HQ material; Applied Biosystems, Darmstadt, Germany). After rinsing the column with 1.5 column volumes of starting buffer (20 mM Tris/HCl, pH 8.0, 0.03% w/v ASB-14), the concentration of NaCl was increased from 0.24 M to 0.6 M NaCl over 38 column volumes. Fractions were precipitated by trichloroacetic acid, and SDS-PAGE was performed according to Laemmli.6 Protein bands were then visualized by Coomassie Brilliant Blue staining.
Analysis Of Model Membrane Proteins
Bacteriorhodopsin (0.1 μg) was purified from Halobacterium salinarum, 12.5 μg ATP synthase (~0.5 μg subunit IV) was purified from Spinacia oleracea, and 1.5 μg photosystem II (~0.3 μg CP47) was purified from Thermosynechococcus elongatus SP-1. The proteins were loaded on SDS-PAGE gels, separated according to Laemmli,6 and stained as described above.
MALDI-MS(/MS)
After visualization, protein bands were excised from the SDS-polyacrylamide gel and completely destained with 100 μL 25 mM ammonium hydrogen carbonate and 50% (v/v) acetonitrile (according to the protocol of Hellman et al7). Subsequently, the gel pieces were completely dried in a speedvac. Tryptic digest was started by the addition of 10 μL of a 12.5-ng/μL trypsin solution (sequencing grade; Promega, Madison, WI) in 25 mM ammonium bicarbonate, pH 8.0; and the protein was digested overnight at 37°C. To elute the peptides, 10 μL of 50% (v/v) acetonitrile, 0.5% trifluoroacetic acid (TFA), was added to the samples which were then sonicated for 5 minutes. The model membrane protein digests were subsequently dried and resuspended in 20% acetonitrile, 0.1% TFA prior to MS analysis.
For dried-droplet preparations, aliquots of 1 μL were applied onto the steel target plate and immediately mixed with an equal volume of α-cyano-hydroxy-cinnamic acid in 60% (v/v) acetonitrile, 1% (v/v) TFA. In the case of the MALDI chips (Mass Spec Turbo Chips; Qiagen), the sample aliquots up to 1 μL were applied directly onto the matrix spots and washed once with 1 μL finishing solution supplied with the chips.
Spectra of model protein digests were acquired on a Voyager DE-Pro (Applied Biosystems), whereas Rhodoccocus protein spectra were recorded on a 4800 MALDI-TOF/TOF instrument (Applied Biosystems). Prior to sample spectra acquisition, optimal laser fluence tuning and other instrumental parameters (number of shots per subspectrum, number of subspectra) were determined for both sample preparation types. Detector sensitivity adjustment was the same for both runs. Further data analysis was carried out using the Data Explorer software (Applied Biosystems), applying the same peak detection and annotation parameters for both preparations. Protein identification was performed by searching extracted peak lists generated with one defined set of filter parameters against the NCBInr database (species restricted to Actinobacteria) using the Mascot (Matrix Science, London, UK) search engine (MS/MS ion search, 1 miscleavage, precursor tolerance: 100 ppm, MS/MS tolerance: 0.5 Da).
The subcellular location of proteins was predicted as follows: Integral membrane proteins were identified with the software TMHMM v2.08 and proteins were considered as peripheral membrane proteins, if this was obvious from their function or homology (e.g., subunits of ABC transporters). Otherwise proteins were considered to be cytosolic.
RESULTS AND DISCUSSION
In this paper we describe our strategy for improved identification of membrane proteins by general gain in sensitivity facilitated by improved MALDI sample preparation. For this, a sample plate covered with an ultraphobic surface and sublimated CHCA hydrophilic matrix spots was employed. This design allows analyte concentration in the top layers of the nanostructured matrix spots by simple deposition and drying down of a sample droplet followed by a washing step. Another important feature of the chip is the morphology of the sublimated CHCA in comparison with dried-droplet CHCA crystals prepared from solutions. Figure 1 shows scanning electron micrographs of the different crystal sizes resulting from classical dried-droplet preparations on a stainless steel target and the sublimated matrix on the chip. The crystals of sublimated matrix on the chip have diameters in the submicrometer range, whereas in standard dried-droplet preparations, two different areas—an inner ring and outer ring structure with different crystal sizes—can be observed. However, both crystal types possess a coarser structure than that of the sublimated matrix on the chip. Thus, a higher total matrix surface is provided, possibly allowing a better adsorption and/or incorporation of the sample peptides resulting in an overall sensitivity gain. Furthermore, Jaskolla et al.9,10 demonstrated that, compared with liquid matrix preparations, sublimation of matrix molecules on a target substrate provides different crystal structures and different characteristics (initial velocity, internal energy) of the ions formed during the MALDI process. In these studies it was shown that the ions formed after preparation on sublimated matrices generally possessed a lower internal energy presumably due to collisional cooling effects. As a consequence of the lower energy level, a higher survival yield resulting in increased sensitivity was proposed.
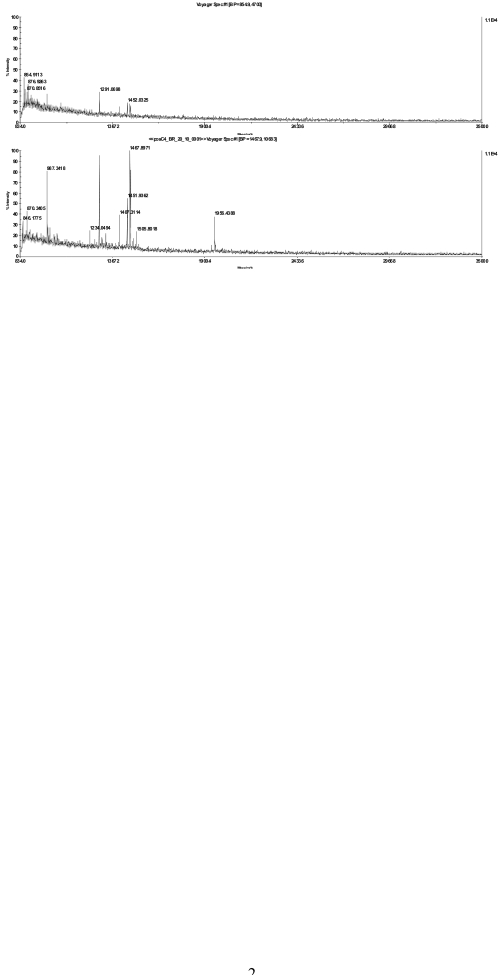
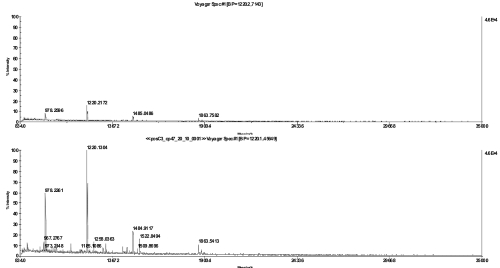
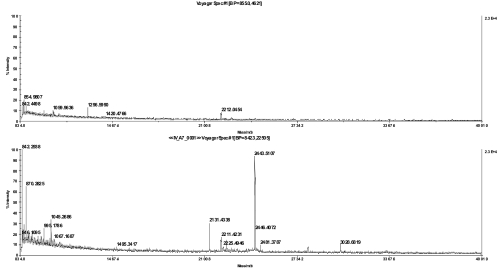
To assess the benefits of this chip-based approach in practical applications, we analyzed three model membrane proteins: bacteriorhodopsin from Halobacterium salinarum (Figure 2), CP47 from Thermosynechococcus elongatus SP-1 (Figure 3), and ATP synthase subunit IV(a) from spinach (Figure 4). The ATP synthase subunit contains four transmembrane domains and has a size of 27 kDa; bacteriorhodopsin contains seven transmembrane domains and has a size of approximately 27 kDa; and CP47 from spinach, which is localized in thylakoid membranes and possesses six transmembrane domains having a size of 47 kDa. To mimic real experimental conditions for the downstream analysis of membrane proteins, all three proteins were separated by SDS-PAGE and after digestion were analyzed by their peptide mass fingerprint. Figures 2 4 show the direct comparison between the spectra recorded after dried-droplet and chip-based sample preparation, respectively. Each pair of spectra was normalized to its base peak regarding both types of sample preparation. In all three cases, sample preparation on the sublimated matrix chip yielded higher signal intensities or more peptides, respectively, when compared with preparations of the same digest on stainless steel targets. The ATPase subunit, which does not run as a well-focused band in SDS-PAGE gels,11 gave very weak signals using a classical sample preparation, but yielded clear signals after applying the sample to the chip. Detailed analysis of CP47 spectra revealed significantly higher signal-to-noise ratios for all investigated peaks using the chip-based approach (Table 1) and supported conclusions drawn by simple visual inspection of spectra.
FIGURE 2.
MS spectra of a bacteriorhodopsin in-gel digest, diluted 1:10 with 20% acetonitrile and spotted together with α-cyano-4-hydroxycinnamic acid matrix on a stainless steel plate (top) or directly applied on the chip (bottom).
FIGURE 3.
MS spectra of a cp47 in-gel digest, diluted 1:20 with 20% acetonitrile and spotted together with α-cyano-4-hydroxycinnamic acid matrix on a stainless steel plate (top) or directly applied on the chip (bottom).
FIGURE 4.
MS spectra of an ATPase subunit IV (a) in-gel digest in 20% acetonitrile with 0.1% trifluoroacetic acid and spotted together with α-cyano-4-hydroxycinnamic acid matrix on a stainless steel plate (top) or directly applied on the chip (bottom).
TABLE 1.
Signal-to-Noise Ratios for CP47 MS Analyses Using Chip and Stainless Steel Targets
| Peak (m/z) | 987 | 1290 | 1407 | 1452 | 1467 | 1955 |
| S/N Ratio: Chip | 159 | 214 | 53 | 117 | 232 | 68 |
| S/N Ratio: Steel | 36 | 54 | 21 | 39 | 36 | na |
S/N, signal to noise ratio.
In order to assess the analytical performance of the method for a more complex proteomics system, proteins of membranes prepared from R. jostii RHA1 were separated by a technology established by Schluesener et al.5 This separation strategy comprised the solubilization of membrane proteins with the help of a zwitterionic detergent, anion exchange LC in the first dimension and SDS-PAGE as an orthogonal second-dimension technique. The resolving power and suitability of this technique for membrane proteomic applications was compared with 16-BAC/SDS-PAGE using membrane preparations of Corynebacterium glutamicum,12 where it was clearly demonstrated that the protein separation power influencing the protein identification rate was superior using the anion exchange chromatography (AIEC)/SDS-PAGE technology than the modified 2D-gel approach.
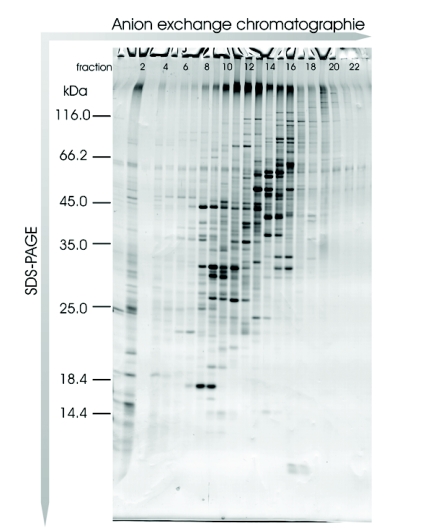
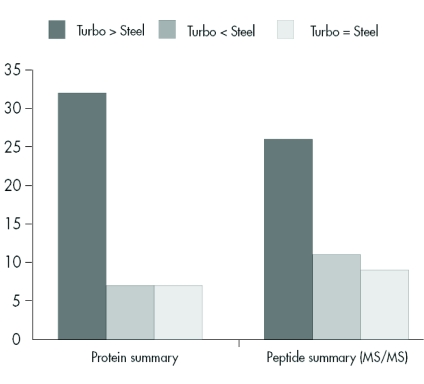
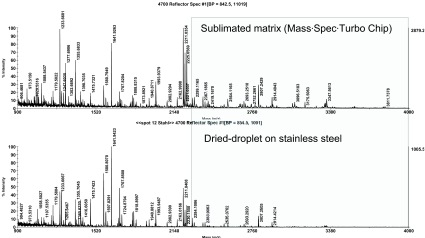
We assumed that these results could be transferred to a similar prokaryotic organism, and so we applied this methodology to analysis of R. jostii RHA1 membranes and separated the solubilized proteins into 38 fractions using anion exchange chromatography. Of these fractions, the 22 containing protein were precipitated with trichloroacetic acid and prepared for SDS-PAGE analysis. After protein separation on a linear SDS gel, protein bands were visualized by Coomassie staining and the gel was scanned (Figure 5). The protein pattern of the scanned gel demonstrated the resolving power of this technology, and featured a large number of different proteins with each protein typically spread over two fractions. Sixty randomly chosen protein bands were excised and analyzed by MALDI-TOF MS/MS. In total, 45 proteins were identified (Table 2). Forty-three proteins were identified using the chip-based approach, whereas only 30 proteins were unambiguously identified using the classical sample preparation method. A further comparison of the protein identification confidence by means of the corresponding Mascot scores revealed that in 32 cases a higher total Mascot score (scoring of peptide mass fingerprint plus associated MS/MS-based peptide scores) was achieved using the chip, whereas in only 7 cases was this score higher after dried-droplet sample preparation (Figure 6). Most often this increase in total Mascot score was linked to a more extensive sequence coverage for the respective protein hit. This effect is exemplified by comparing two spectra of the ro05516 protein identified in this experiment (Figure 7). Particularly in the higher mass range (>2200 m/z), more signals were detectable in the chip-based prep than in the steel plate prep, which resulted in an increased sequence coverage (58% vs. 44%) and a higher total Mascot score (143 vs. 107). However, in some cases the Mascot scores were higher after sample preparation on stainless steel. This effect can be assigned to the occurrence of some alkali ion adducts in these cases (data not shown). These adducts lead to the generation of additional peaks in the MS spectrum that remain unmatched to a protein sequence and thus blur the search result.
FIGURE 5.
Different rhodococcal membrane protein anion exchange chromatography fractions separated on an SDS-PAGE and stained with Coomassie Brilliant Blue.
TABLE 2.
Proteins Identified from MALDI-TOF/TOF Analysis of R. jostii RHA1 Membranes
| Spot No. | Protein ID | Fraction No. | MW, kDa (observed) |
|---|---|---|---|
| 1 | |||
| 2 | Peptidoglycan glycosyltransferase | 2 | 50 |
| 3 | Hypothetical protein RHA1_ro05537 | 2 | 48 |
| 4 | |||
| 5 | |||
| 6 | Hypothetical protein RHA1_ro11207 | 2 | 35 |
| 7 | |||
| 8 | |||
| 9 | Hypothetical protein RHA1_ro00834 | 2 | 30 |
| 10 | Hypothetical protein RHA1_ro05516 | 2 | 28 |
| 11 | Probable 1-acyl-sn-glycerol-3-phosphate acyltransferase | 2 | 27 |
| 12 | Probable ubiquinol-cytochrome c reductase cytochrome c subunit | 2 | 25 |
| 13 | Transcriptional regulator | 1 | 24 |
| 14 | 50S ribosomal protein L5 | 2 | 22 |
| 15 | Hypothetical protein RHA1_ro01385 | 2 | 20 |
| 16 | 50S ribosomal protein L13 | 2 | 16 |
| 17 | Probable succinate dehydrogenase hydrophobic membrane anchor protein
Hypothetical protein RHA1_ro06281 |
2
2 |
15
15 |
| 18 | 50S ribosomal protein L16 | 2 | 13 |
| 19 | |||
| 20 | |||
| 21 | |||
| 22 | Possible proline-rich protein | 7 | 47 |
| 23 | Protein-export membrane protein | 10 | 46 |
| 24 | Hypothetical protein RHA1_ro05190 | 8 | 45 |
| 25 | Hypothetical protein RHA1_ro01491 | 8 | 39 |
| 26 | |||
| 27 | ABC phosphate transporter, substrate-binding component | 8 | 37 |
| 28 | Probable ubiquinol-cytochrome c reductase iron-sulfur subunit | 8 | 36 |
| 29 | ABC sulfate/thiosulfate porter, substrate binding component | 9 | 34 |
| 30 | Hypothetical protein RHA1_ro02104 | 9 | 31 |
| 31 | |||
| 32 | ABC metal transporter, ATP-binding component | 9 | 27 |
| 33 | ATP synthase delta subunit
ABC amino acid transporter, ATP-binding component |
8
8 |
25
25 |
| 34 | ATP-dependent Clp protease | 7 | 22 |
| 35 | Hypothetical protein RHA1_ro04458 | 13 | 23 |
| 36 | Hypothetical protein RHA1_ro05626 | 12 | 22 |
| 37 | |||
| 38 | Hypothetical protein RHA1_ro02317 | 10 | 21 |
| 39 | Hypothetical protein RHA1_ro06895 | 9 | 20 |
| 40 | H(+)-transporting two-sector ATPase subunit B | 9 | 18 |
| 41 | 50S ribosomal protein L7/L12 | 9 | 16 |
| 42 | Probable succinate dehydrogenase hydrophobic membrane anchor protein | 10 | 14 |
| 43 | H(+)-transporting two-sector ATPase epsilon subunit | 10 | 12 |
| 44 | |||
| 45 | |||
| 46 | Hypothetical protein RHA1_ro06389 | 13 | 116 |
| 47 | Hypothetical protein RHA1_ro03675 | 12 | 110 |
| 48 | Hypothetical protein RHA1_ro03675 | 12 | 90 |
| 49 | |||
| 50 | Chaperone protein | 13 | 51 |
| 51 | ABC oligopeptide transporter, substrate-binding component | 12 | 50 |
| 52 | H(+)-transporting two-sector ATPase beta subunit | 13 | 49 |
| 53 | |||
| 54 | Ketol-acid reductoisomerase | 12 | 40 |
| Hypothetical protein RHA1_ro00933 | 12 | 40 | |
| 55 | Probable ubiquinol-cytochrome c reductase iron-sulfur subunit | 12 | 35 |
| 56 | ABC daunorubicin resistance transporter, ATP-binding component | 13 | 33 |
| 57 | |||
| 58 | Pyruvate carboxylase | 16 | 116 |
| 59 | |||
| 60 |
FIGURE 6.
Comparison of protein Mascot scores after dried-droplet sample preparation on a stainless steel target and chip-based sample preparation. The bars to the left show the analysis based on total Mascot score (protein summary), i.e., basically the addition of the peptide mass fingerprint score and the peptide MS/MS score. The bars to the right represent the results based on the peptide MS/MS Mascot score only. Scores were ranked “higher” or “lower” if they differed more than 5% and were supported by a respective change of sequence coverage.
FIGURE 7.
Exemplary MS spectra of R. jostii RHA1_ro05516 separated by anion exchange chromatography/SDS-PAGE and spotted together with α-cyano-4-hydroxycinnamic acid matrix on a stainless steel plate (bottom) or directly applied to the chip (top). The respective sequence coverage of the same protein identified was 58% on the chip and 44% on stainless steel.
On the level of protein identification based solely on MS/MS results, 25 proteins were identified with a higher score using the MALDI chip and 10 proteins were identified with a higher peptide score after sample preparation on stainless steel target (Figure 6). Hence, this kind of sample preparation technique may also prove beneficial for purely MS/MS-driven shot-gun proteomic approaches like LC-MALDI analysis of even more complex peptide mixtures.
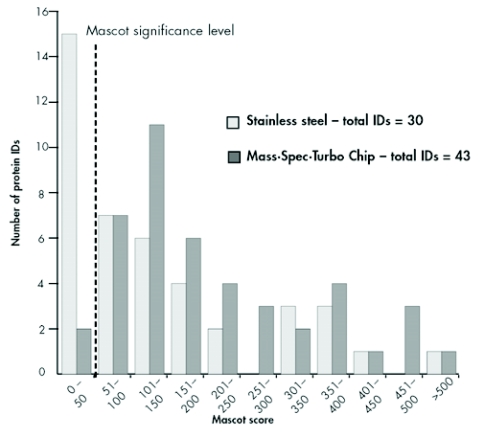
The clustering of the identified proteins with respect to their total Mascot scores showed strong differences in terms of the score distribution patterns between the different MALDI sample preparation types (Figure 8). Generally, the proteins identified can be divided into two groups: One group comprises proteins typically yielding only lower Mascot scores, whereas a second group consists of proteins that can be easily identified because of their higher abundance and/or because they produce high-quality MS and MS/MS spectra. The closer examination of the group yielding lower Mascot scores reveals that the center of the distribution (101 150 scoring points) lies well above the significance level for the chip-based approach. At the same time, the maximum of the distribution curve for the dried-droplet sample preparation remains below the significance level, demonstrating the superiority of preparations using the sublimated matrix in terms of protein identification confidence. Less pronounced, but still detectable, the same effect can be seen in the second group, the “high Mascot score” proteins (250 to > 500 scoring points); here, the distribution curve for dried-droplet preparations seems to peak at the 300 400 scoring level, whereas after sample application on the MALDI chip an increased number of identified proteins were found in this higher-scoring group.
FIGURE 8.
Distribution of total Mascot scores of the identified proteins. The vertical dashed line shows the significance threshold.
In another statistical evaluation, the identified proteins were analyzed with respect to their cellular localization by querying their sequence for transmembrane domains or membrane attachment sites. This in-silico analysis of the proteins identified after cumulating both MALDI runs revealed that approximately two thirds of the proteins could be designated as integral or membrane-associated proteins, whereas one third could be considered as contaminating cytoplasmic proteins. In a previous study, the same separation technology was applied for the membrane proteome of the related C. glutamicum.5 In this study, about 50% of the identified proteins were predicted to be integral membrane or membrane-associated proteins. Hence, the observed results for R. jostii RHA1 are in line with, if not slightly better, than our previous data for C. glutamicum.
In the course of the experiments it was demonstrated that MALDI sample preparation on presublimated CHCA matrix was superior to standard dried-droplet sample preparation for the identification of membrane proteins. Although no peptide mass or fragmention sequence matching to hydrophobic membrane spanning peptide was found after in-depth analysis of the spectra, an increase of identification performance was manifested by a higher total number of identified proteins in combination with an increase of the confidence level (Mascot score). This effect can be ascribed to a general improvement in MS and MS/MS sensitivity, whereas specific coverage of transmembrane regions may be achieved if an alternative in-gel digestion approach is used, e.g., a sequential digestion with cyanogen bromide and trypsin,13 which facilitates the cleavage in TM helices1,5.
ACKNOWLEDGMENTS
REM micrographs were provided by Bayer Industry Services GmbH, Germany. We are grateful to Norbert Dencher and Regina Owo-rah-Nkruma for providing bacteriorhodopsin and photosystem 2, respectively. This work was supported by the BMBF grant 0313812A to A.P. and M.R.
REFERENCES
- 1.Fischer F, Poetsch A. Protein cleavage strategies for an improved analysis of the membrane proteome. Proteome Sci. 2006;4:2–14. doi: 10.1186/1477-5956-4-2. [DOI] [PMC free article] [PubMed] [Google Scholar]
- 2.Vorm O, Roepstorff P, Mann M. Improved resolution and very high sensitivity in MALDI TOF of matrix surfaces made by fast evaporation. Anal Chem. 1994;66:3281–3287. [Google Scholar]
- 3.McLeod MP, Warren RL, Hsiao WW, et al. The complete genome of Rhodococcus sp. RHA1 provides insights into a catabolic powerhouse. Proc Natl Acad Sci USA. 2006;103:15,582–15,587. doi: 10.1073/pnas.0607048103. [DOI] [PMC free article] [PubMed] [Google Scholar]
- 4.Masai E, Yamada A, Healy JM, et al. Characterization of biphenyl catabolic genes of gram-positive polychlorinated biphenyl degrader Rhodococcus sp. strain RHA1. Appl Environ Microbiol. 1995;61:2079–2085. doi: 10.1128/aem.61.6.2079-2085.1995. [DOI] [PMC free article] [PubMed] [Google Scholar]
- 5.Schluesener D, Fischer F, Kruip J, Rogner M, Poetsch A. Mapping the membrane proteome of Corynebacterium glutamicum. Proteomics. 2005;5:1317–1330. doi: 10.1002/pmic.200400993. [DOI] [PubMed] [Google Scholar]
- 6.Laemmli UK. Cleavage of structural proteins during the assembly of the head of bacteriophage T4. Nature. 1970;227:680–685. doi: 10.1038/227680a0. [DOI] [PubMed] [Google Scholar]
- 7.Hellman U, Wernstedt C, Gonez J, Heldin CH. Improvement of an “In-Gel” digestion procedure for the micropreparation of internal protein fragments for amino acid sequencing. Anal Biochem. 1995;224:451–455. doi: 10.1006/abio.1995.1070. [DOI] [PubMed] [Google Scholar]
- 8.Krogh A, Larsson B, von Heijne G, Sonnhammer EL. Predicting transmembrane protein topology with a hidden Markov model: application to complete genomes. J Mol Biol. 2001;305:567–580. doi: 10.1006/jmbi.2000.4315. [DOI] [PubMed] [Google Scholar]
- 9.Jaskolla T, Roth U, Röhl H, et al. Sensitive and reproducible detection of peptides by Maldi-TOF MS using self-assembled monolayer (SAM)-based chips–specifications and applications. Poster presented at: American Society for Mass Spectrometry Conference; May 28–June 1, 2006; Seattle, WA. [Google Scholar]
- 10.Jaskolla T, Karas M, Steinert K, Roth U, Menzel C, Reihs K. Effects of matrix crystal size on ion formation in matrix-assisted laser desorption/ionization. Poster presented at: American Society for Mass Spectrometry Conference; June 3–June 7, 2007; Indianapolis, IN. [Google Scholar]
- 11.Poetsch A, Seelert H, Meyer zu Tittingdorf J, Dencher NA. Detergent effect on anion exchange perfusion chromatography and gel filtration of intact chloroplast H(+)-ATP synthase. Biochem Biophys Res Commun. 1999;265:520–524. doi: 10.1006/bbrc.1999.1688. [DOI] [PubMed] [Google Scholar]
- 12.Schluesener D, Rogner M, Poetsch A. Evaluation of two proteomics technologies used to screen the membrane proteomes of wild-type Corynebacterium glutamicum and an L-lysine-producing strain. Anal Bioanal Chem. 2007;389:1055–1064. doi: 10.1007/s00216-006-0997-x. [DOI] [PubMed] [Google Scholar]
- 13.van Montfort BA, Doeven MK, Canas B, et al. Combined in-gel tryptic digestion and CNBr cleavage for the generation of peptide maps of an integral membrane protein with MALDI-TOF mass spectrometry. Biochim Biophys Acta. 2002;1555:111–115. doi: 10.1016/s0005-2728(02)00264-5. [DOI] [PubMed] [Google Scholar]


