Abstract
Several techniques are under development to diagnose oesophageal adenocarcinoma at an earlier stage. We have demonstrated the potential of Raman spectroscopy, an optical diagnostic technique, for the identification and classification of malignant changes. However, there is no clear recognition of the biochemical changes that distinguish between the different stages of disease. Our aim is to understand these changes through Raman mapping studies. Raman spectral mapping was used to analyse 20-μm sections of tissue from 29 snap-frozen oesophageal biopsies. Contiguous haematoxylin and eosin sections were reviewed by a consultant pathologist. Principal component analysis was used to identify the major differences between the spectra across each map. Pseudocolour score maps were generated and the peaks of corresponding loads identified enabling visualisation of the biochemical changes associated with malignancy. Changes were noted in the distribution of DNA, glycogen, lipids and proteins. The mean spectra obtained from selected regions demonstrate increased levels of glycogen in the squamous area compared with increased DNA levels in the abnormal region. Raman spectroscopy is a highly sensitive and specific technique for demonstration of biochemical changes in the carcinogenesis of Barrett's oesophagus. There is potential for in vivo application for real-time endoscopic optical diagnosis.
Keywords: Raman spectroscopy, adenocarcinoma, oesophagus, biochemical changes
Despite advances in diagnosis and therapy, oesophageal adenocarcinoma remains an aggressive and usually lethal tumour (Zhang et al, 2005). Given the poor prognosis associated with the disease, a better understanding the pathogenesis and the factors associated with increased risk is essential. Also, strategies for prevention of oesophageal adenocarcinoma are hotly contested. The increased incidence of oesophageal adenocarcinoma is mirrored by similar rise in the incidence of Barrett's oesophagus (Prach et al, 1997). Barrett's oesophagus a premalignant condition is characterised by columnar mucosa, specifically intestinal metaplasia (IM) (Hamilton et al, 1988; Weinstein and Ippoliti, 1996).
Raman spectroscopy an optical diagnostic technique has been recognised as a valuable analytical tool in biological and medical research. It depends on an energy shift due to interaction with vibrational modes of molecules. The Raman spectrum is a direct function of the molecular composition of the tissue and provides a fingerprint of the tissue (Crow et al, 2003; Koljenovic et al, 2004; Stone et al, 2004).
During the past decade, progress in Raman spectroscopic instrumentation has increased the sensitivity of the measurement to such a degree that the acquisition of high-quality spectral data from biological tissue and cells is possible. The greatest benefit of this technique lies in its high sensitivity to subtle molecular and biochemical changes, as well as its capability for noninvasive sensing (Haka et al, 2002; Mantsch et al, 2002; Shafer-Peltier et al, 2002).
In previous studies, we have demonstrated the potential of Raman spectroscopy for the identification and classification of malignant changes in oesophagus. Raman spectroscopy was used to analyse 87 oesophageal biopsies from 44 patients. Spectral results were correlated with the consensus opinion of three gastrointestinal pathologists using multivariate statistical analysis (Kendall et al, 2003). However, there was no clear recognition of the biochemical changes that distinguished between the different stages of malignant progression. Our aim in this study was to understand these changes through Raman mapping and to attain direct biochemical information on Barrett's oesophagus, which is novel in this field.
This study utilises near-infrared Raman Spectroscopy, a highly specific optical analysis technique, to build robust spectral, biochemical diagnostic models of oesophageal pathologies. In doing so we will further our understanding of carcinogenesis in these tissues.
MATERIALS AND METHODS
Ethical approval for this study was obtained from the Gloucestershire Local Research Ethics Committee. Informed consent was obtained from the patients at routine upper gastrointestinal endoscopy for surveillance of Barrett's oesophagus, chronic reflux symptoms and with suspected malignancy. Barrett's oesophagus was defined as the presence of columnar mucosa in the distal oesophagus of any length with IM on biopsy (Sharma et al, 1998). Patient demographics, including age and sex were noted.
In total, 29 samples collected from 22 patients were included in the study. The biopsies collected were snap-frozen in liquid nitrogen after mounting them on acetate paper. A consultant gastrointestinal pathologist who was blinded to identity and symptoms of the patient examined haematoxylin and eosin sections obtained from the frozen samples. The biopsy samples were classified as normal squamous, IM, low-grade dysplasia (LGD), high-grade dysplasia (HGD) and adenocarcinoma. Mixed samples with two pathologies were included in the study, which would mimic in vivo application. Owing to the focal change of mucosa often the scanned area will have heterogeneous pathology. A 20-μm contiguous section for Raman mapping, mounted on calcium fluoride, was left uncontaminated thus providing an approximation to an in vivo approach.
Raman spectral measurement
Raman spectra were measured with a highly sensitive Renishaw Raman System 1000® spectrometer optimised to provide rapid acquisition of high-quality tissue spectra. A diode laser with 830 nm incident light was used for excitation of the tissue. The spectrometer was connected to a microscope fitted with a Leica (NA 0.5) × 50 ultra long working distance objective lens and motorised stage to allow micro positioning of small tissue samples. A single 300 lines mm−1 grating was used to disperse the collected light and a charged coupled device detector measured the signal at each wavelength.
In total, 25 000 spectra were measured from the sections on calcium fluoride slides. The spectra were collected at 100-μm steps across whole sections to provide information about global changes in the specimen. The contiguous haematoxylin and eosin section image captured by a digital camera mounted microscope was used to verify the different areas of dysplasia. The consultant pathologist compared these images with the white light images from the calcium fluoride section.
Spectral analysis
Analysis was performed using Matlab and the PLS toolbox (Eigenvector Technologies, Manson, Washington, USA), generating principal components, which were used to identify the major differences between the spectra across each map. Pseudocolour maps of the principal component scores have been generated, and the peaks of the corresponding loads identified, enabling visualisation of the biochemical changes associated with malignancy (Pelletier, 2003). Reference spectra were obtained of glycogen, actin, triolein, DNA, collagen type 1, oleic acid (purchased from Sigma-Aldrich, Gillingham, UK).
Mean spectra from regions of interest were plotted for comparison and identification of spectral differences. Peak assignments of these mean spectra were also identified. Relative concentrations of different biochemical constituents were obtained by mathematical fit to mean spectra. This was performed as follows:
The PLS-toolbox® (Eigenvector) for Matlab® was adapted for use with the data in these studies. The fitting of the mean spectra of the biochemical constituents to the mean spectra of the different regions of interest from the tissue specimens was performed with ordinary least squares analysis. To optimise this process and remove any spectral offset the first derivative of each of the spectra was calculated using a Savitsky-Golay filter.
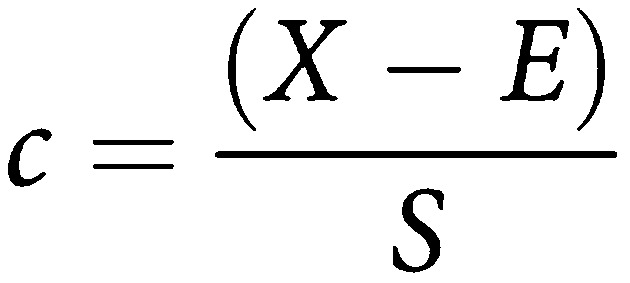
This fitting process is explained simply below. We begin by describing the measured tissue spectrum as a sum of the constituent spectra multiplied by their concentrations plus a residual or error. This leads to
 |
where S is the matrix of spectral components, c is the matrix of concentrations to be predicted and X is the measured spectra. This can be used to provide a ‘best fit’ of the spectral components or basis spectra found within the measured spectra. The assumption is made that the residual E is minimised (i.e., least square of the residual) and that the spectral components selected are the major constituents of the spectra.
 |
The disadvantage with this technique is that any colinearity in the components selected will skew the fit. An example being amino acids and the proteins containing them being used in the same model. Furthermore, if components are not included the omitted variable bias can introduce some errors in the fit. (Sowa et al, 2006) Observation of the residual E enables the quality of the fit to be observed and any remaining features of the spectra to be included in the next iteration of the model.
RESULTS
In total, 29 samples with different pathologies were studied from 22 patients with male to female ratio of 26 : 4. The pathologies with normal squamous and adenocarcinoma and normal squamous and LGD constituted 24% each, normal squamous and HGD were 33%, normal squamous and IM were 14% and the rest were normal squamous and squamous dysplasia (Table 1).
Table 1. Pathologies of different samples.
| NSq and IM | NSq and LGD | NSq and HGD | NSq and adeno | NSq and SqDy |
|---|---|---|---|---|
| 4 | 7 | 10 | 7 | 1 |
Adeno, adenocarcinoma; HGD, high-grade dysplasia; IM, intestinal metaplasia; LGD, low-grade dysplasia; NSq, normal squamous; SqDy, squamous dysplasia.
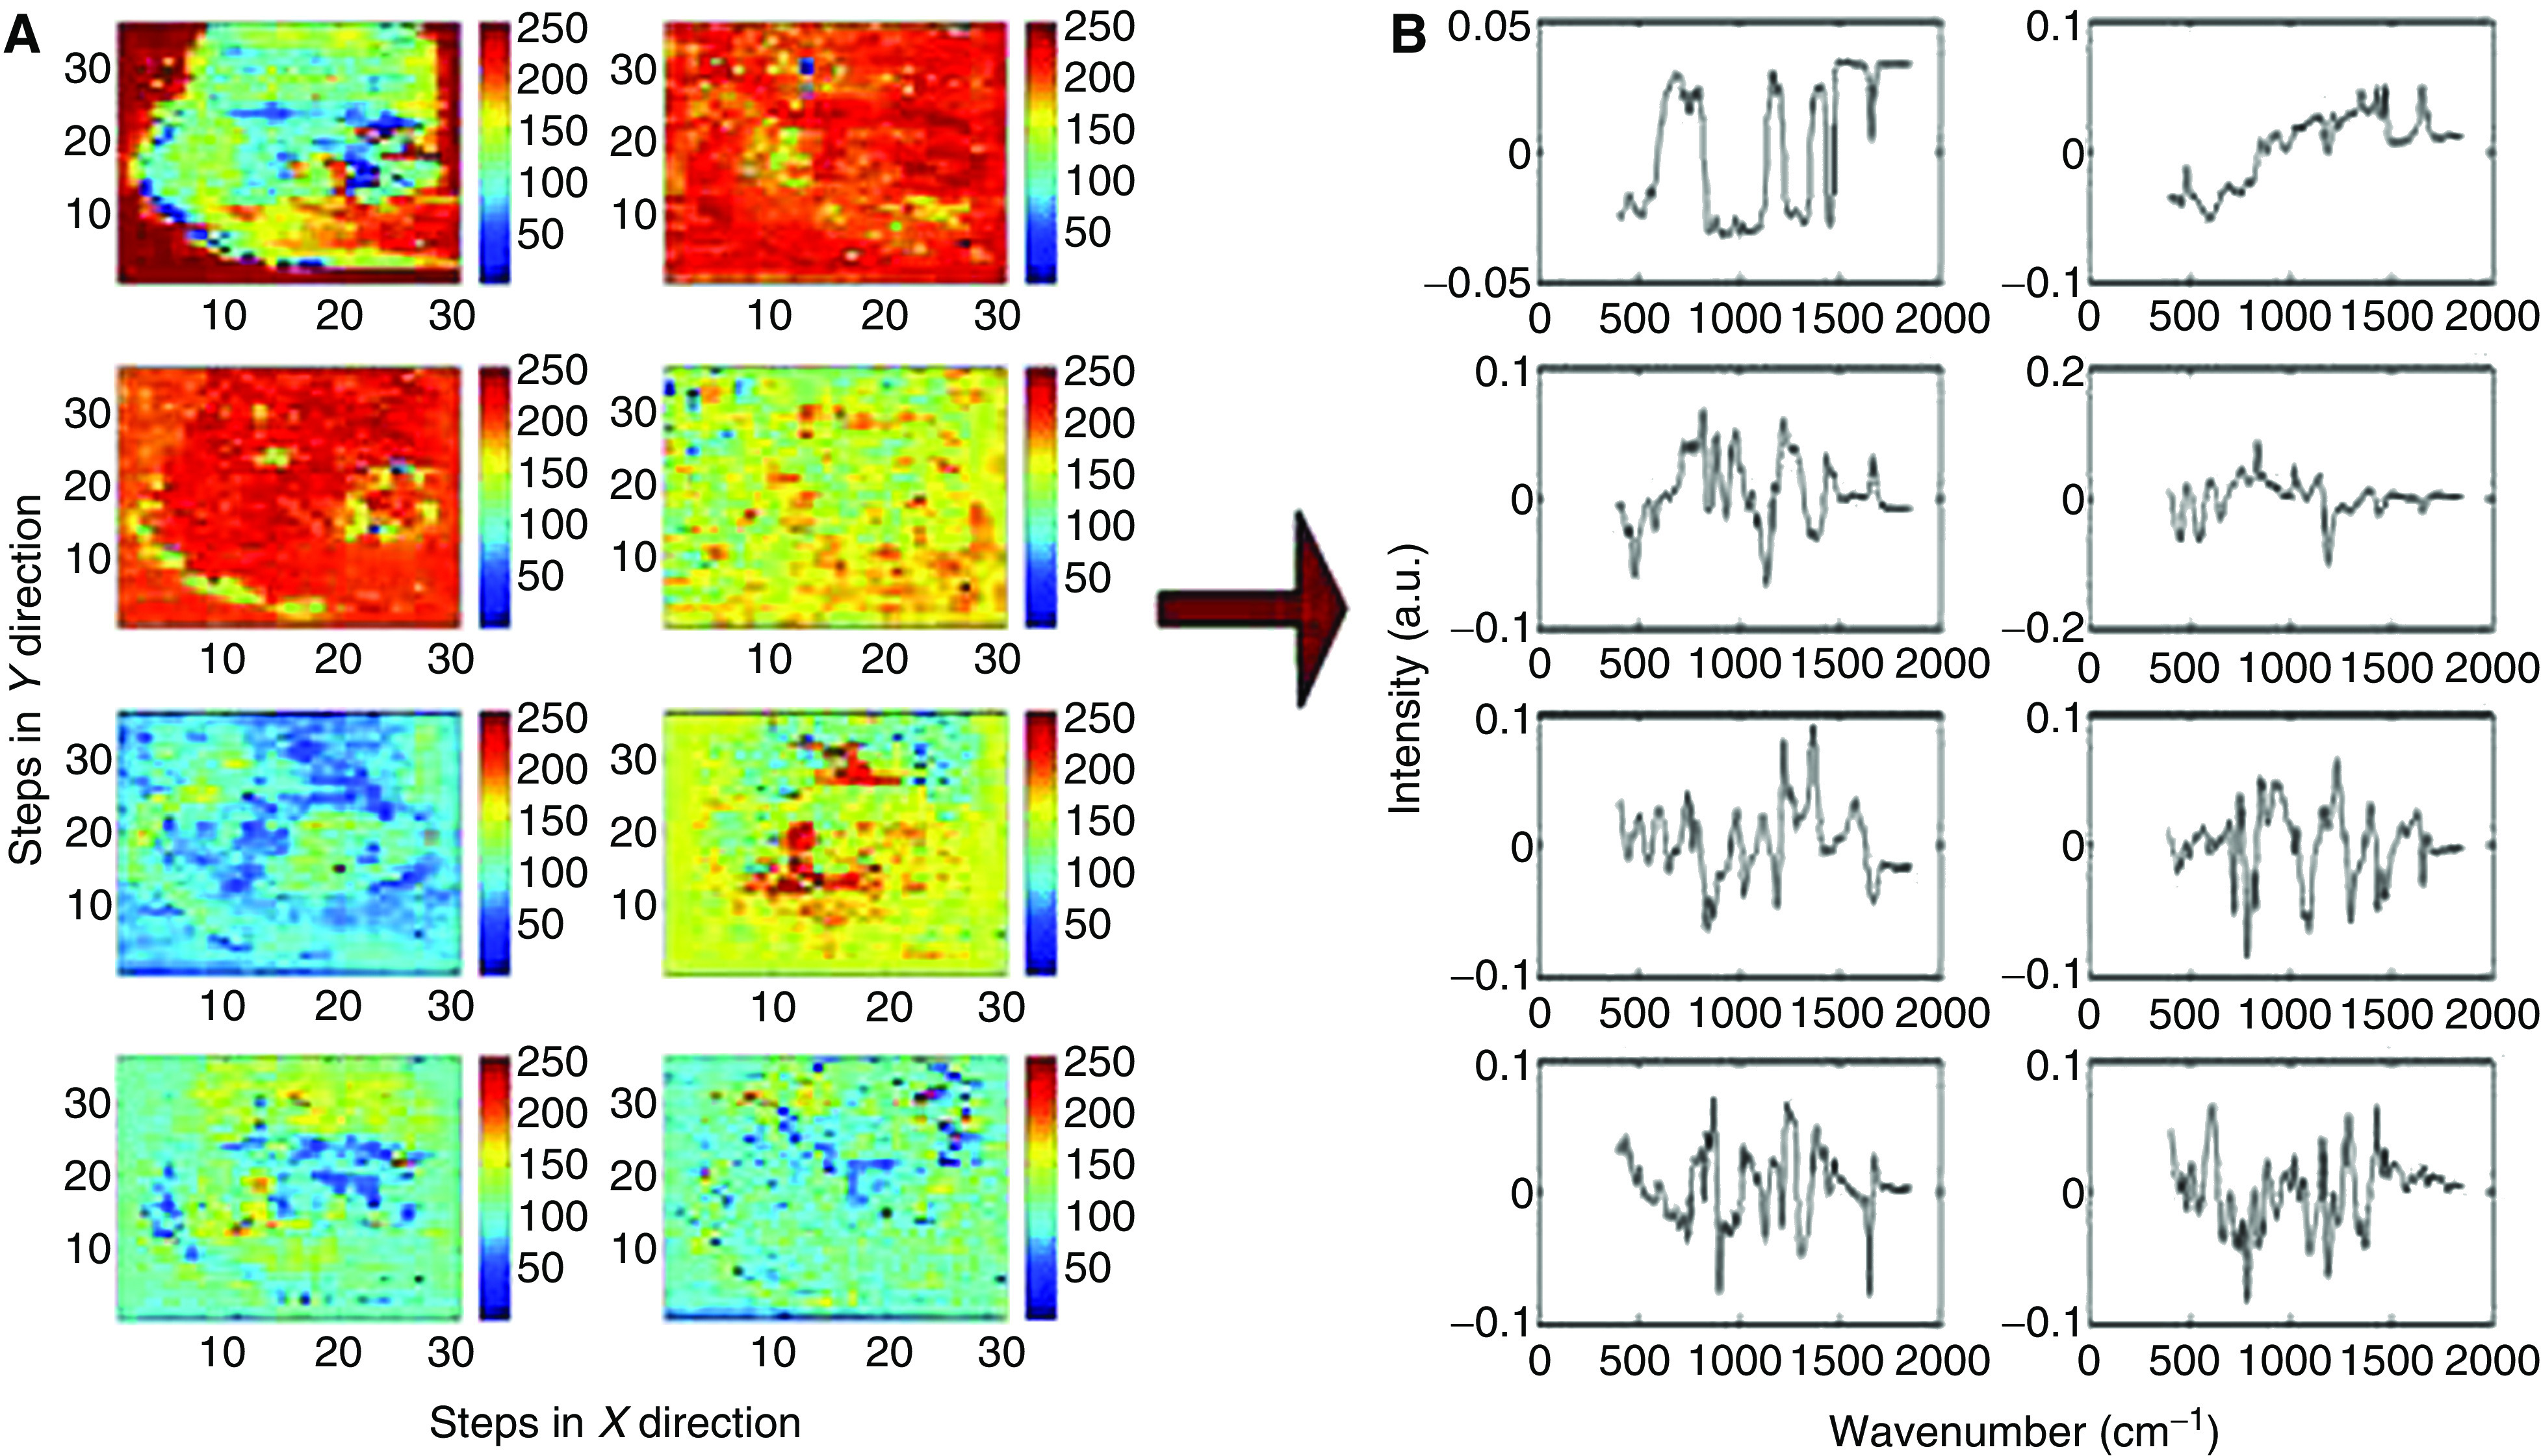
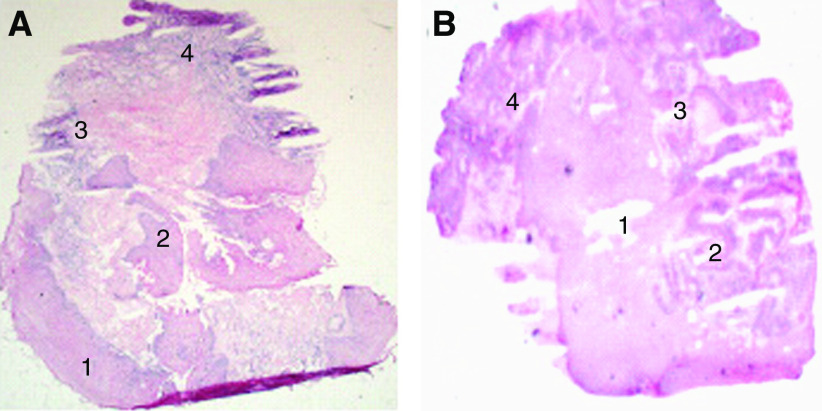
Figure 1 shows the haematoxylin and eosin section of the normal squamous and HGD (A) and normal squamous and adenocarcinoma (B) sections. The pseudocolour maps of PC scores and the corresponding loads (generated from the specimen during spectral analysis) of normal squamous and HGD illustrate the biochemical variation in the tissue. These are shown in Figure 2. The concentration distribution of different biochemical constituents in the various principal component score maps, vary from high-intensity colour red to low-intensity blue.
Figure 1.
Haematoxylin and eosin stained sections with pathology labelled. (A) Regions 1 and 2 normal squamous and regions 3 and 4 HGD. (B) Region 1 normal squamous and regions 2, 3 and 4 adenocarcinoma.
Figure 2.

First eight pseudocolour principal component score maps and corresponding loads for the normal squamous and HGD sample (H&E stained section Figure 1A). PC 1 top left to PC 8 bottom right.
The first score map of normal squamous and HGD section shows the highest variation across the map between tissue and calcium fluoride slide. Peak assignment of the other following loads demonstrates further variation in the tissue distribution of DNA (deoxyribonucleic acid), glycogen, lipids and proteins. For example in load 3, DNA peaks can be demonstrated at 722, 752, 782 and 1663 cm−1 and peaks at 820, 884, 1223, 1278 and 1663 cm−1 correspond to proteins, including collagen I. The corresponding score shows variation in the DNA and proteins across the sample. Similarly, in load 6 peaks at 852 and 918 cm−1 correspond to glycogen and 750 and 918 cm−1 to lactic acid. Almost all inverted peaks in PC 6 load corresponds to DNA, which is concentrated in dysplastic area (Figure 1A). As the number of principal components increases more subtle variations can be seen. The variation in the lipids and DNA can be demonstrated across the sample in PC load 8 and its corresponding score.
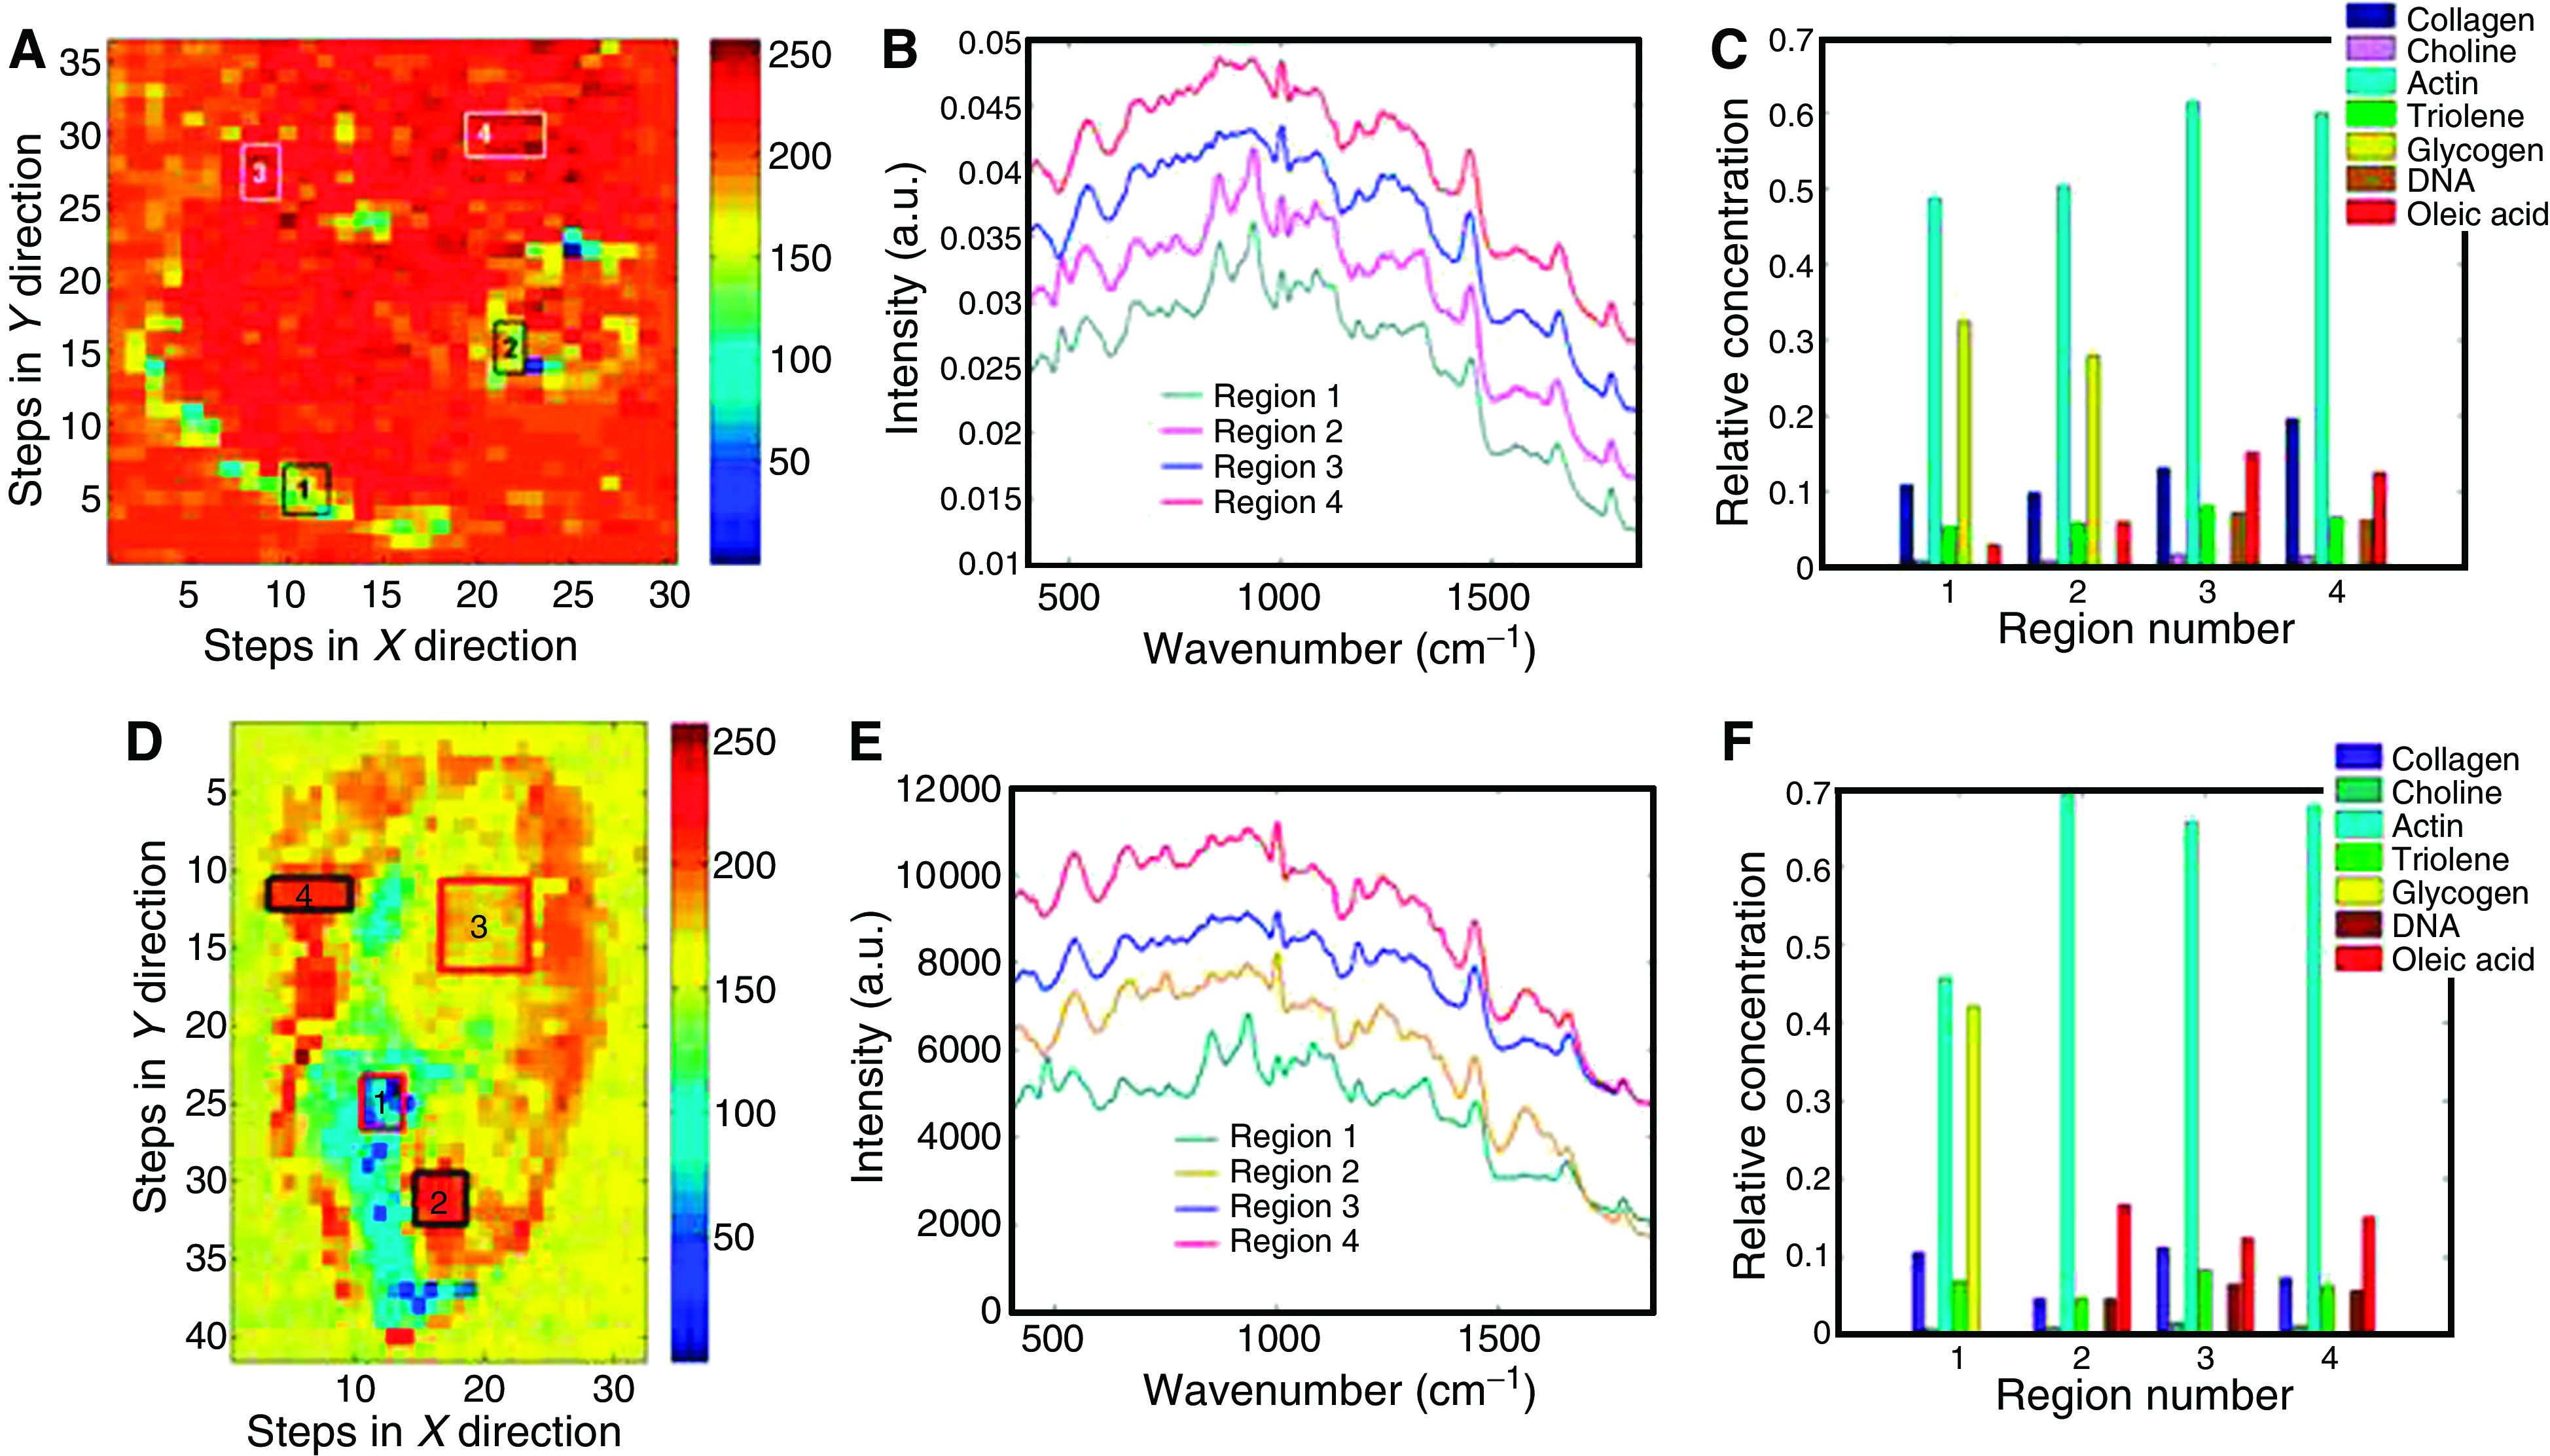
Figure 3 shows the score map from the third principal component (A) with the mean spectra from the selected four regions (B). Spectral differences were demonstrated between the selected regions, for example; glycogen peaks are seen at 853, 937 and 1333 cm−1 and DNA peaks can be clearly demonstrated at 719, 755 and 781 cm−1. The mean spectra from the selected regions were analysed for variation in the biochemical composition of the tissue (C). Following mathematical least squares fit, marked variation in the distribution of different biochemical constituents were seen; such as glycogen, DNA, oleic acid and collagen I across the tissue sample. DNA, oleic acid, collagen I and actin are predominantly seen in the region of HGD and glycogen in the normal squamous tissue.
Figure 3.

Normal squamous and HGD sample (H&E stained section Figure 1A). (A) Third principal component score map with selected regions marked. (B) Mean Raman spectra from selected regions. (C) Relative concentration of selected biochemical constituents calculated with mean spectra from selected regions. Normal squamous and adenocarcinoma sample (H&E stained section Figure 1B). (D) Third principal component score map with selected regions marked. (E) Mean Raman spectra from selected regions. (F) Relative concentration of selected biochemical constituents calculated with mean spectra from selected regions.
An additional example of the distribution of various biochemical constituents is shown in Figure 3D–F. Figure 1B shows the section of normal squamous and adenocarcinoma with pathological distribution. The corresponding third principal component score shown in Figure 3D shows clear differentiation in the subpathologies, which has been delineated by colour contrast in pseudocolour map. The score map shows variation in the DNA and glycogen content across the sample. The mean spectra from the selected regions (1, 2, 3 and 4 in Figure 3D and F) were analysed to understand the biochemical changes associated in these regions. The analysis was carried out in a similar way to the previous sample and distinct variation was noted in the distribution of glycogen, DNA, actin and oleic acid. In Figure 3E the spectral difference for glycogen is more pronounced in region 1. The glycogen peaks at 481, 853, 937 and 1048 cm−1 in the mean spectrum of region 1 can be clearly demonstrated. On the contrary the DNA triplets at 720, 729 and 748 cm−1 are well seen in the spectra of regions 2, 3 and 4. The biochemical distribution plot shows increase distribution of DNA, actin and oleic acid in dysplastic glandular regions (2, 3 and 4 regions in Figure 3D–F).
DISCUSSION
Better understanding of the carcinogenesis of Barrett's oesophagus is an essential step in targeting the lesion and improving the survival. Currently, endoscopy with biopsy during surveillance, or in suspected patients, is the gold standard for diagnosis of malignancy. In spite of various diagnostic methods and some surveillance programmes survival has not improved in last decade. The potential of present surveillance programmes to improve detection of adenocarcinoma at early stage has been questioned by many studies (Reid et al, 1988; van Sandick et al, 1998; Macdonald et al, 2000; Montgomery et al, 2001).
To improve mortality it is vital to diagnose the lesion at an early stage where there are only biochemical changes without significant architectural changes. A new diagnostic technique, which can facilitate this application, is valuable in future.
Various methods have been adopted to understand the molecular biology of cancer tissue. Most of these concentrate on DNA changes; however, little attention has been given to understand the other biochemical changes in the tissue (Jankowski et al, 1999; Doak et al, 2003). By understanding and quantifying the biochemical changes during neoplastic progression it may be possible to detect the abnormal lesion before morphological changes can occur.
For the development of new diagnostic methods for detection of tissue states in vivo, it is important to understand the spectral features of pure individual components of tissues; that means cells and subcellular components. Raman spectroscopy is still evolving at this stage.
Recent studies shows that Raman microspectroscopy has been applied to record complete spectral maps of freeze-dried cells as well as living cells in media without the need for any fixing technique before the mapping. The resulting spectra showed the localisation of the nucleus, organelles and the membrane (Kraft et al, 2003). Raman spectroscopy is more often associated with the determination of molecular structure and with qualitative analysis; as an example, the conformational characterisation of natively unfolded proteins through a simple band fitting of the amide I region has been recently described (Maiti et al, 2004). There have also been numerous applications of Raman spectroscopy for the quantitative analysis of sample composition, the most relevant application fields being clinical (Mc Laughlin et al, 2002; Pelletier, 2003). It needs further studies to unravel all the information or data present in the Raman spectrum.
Our results show Raman spectroscopy is a true indicator of biochemical changes in the tissue. The Raman effect is due to an energy shift due to interaction with molecular vibration modes, a Raman spectrum reflects the signature of that molecule. Overall we know the major changes in the cell such as increase in the DNA, however, delicate variation of different components (such as sugars, lipids, proteins and amino acids) needs attention. The subtle variations in the spectral peaks can confer ample biochemical information from the tissue.
The changes in the distribution of DNA, lipids and proteins in the cells during the process of carcinogenesis could be early markers in detection of high-risk patients before morphological changes occur. This study is a significant first step towards establishing these biochemical changes. By further understanding the carcinogenesis process it would help us to improve the diagnostic techniques, thus improving the survival. These preliminary results need further studies to confirm the results and to study more biochemical components. This will also need to be validated by different centres, and inter and intraobserver variability should be addressed.
Possible future applications of Raman spectroscopy include an in vivo endoscopic probe during surveillance, thus identifying high yield areas and eliminating the need for random biopsies. This may reduce sampling error and decrease or eliminate the need for biopsy that adds to the cost of the procedure. The Raman spectrum is a direct function of the molecular composition of the tissue and can therefore also be used to give a truly objective measure of pathology. Hence Raman spectroscopy can be potentially used as pathological tool in validating the diagnoses, identifying the margins in curative resection and lymph nodes.
References
- Crow P, Stone N, Kendall CA, Uff JS, Farmer JA, Barr H, Wright MP (2003) The use of Raman spectroscopy to identify and grade prostatic adenocarcinoma in vitro. Br J Cancer 89(1): 106–108 [DOI] [PMC free article] [PubMed] [Google Scholar]
- Doak SH, Jenkins GJ, Parry EM, Griffiths AP, Shah V, Baxter JN, Parry JM (2003) Characterisation of p53 status at the gene, chromosomal and protein levels in oesophageal adenocarcinoma. Br J Cancer 89(9): 1729–1735 [DOI] [PMC free article] [PubMed] [Google Scholar]
- Haka AS, Shafer-Peltier KE, Fitzmaurice M, Crowe J, Dasari RR, Feld MS (2002) Identifying microcalcifications in benign and malignant breast lesions by probing differences in their chemical composition using Raman spectroscopy. Cancer Res 62(18): 5375–5380 [PubMed] [Google Scholar]
- Hamilton SR, Smith RR, Cameron JL (1988) Prevalence and characteristics of Barrett esophagus in patients with adenocarcinoma of the esophagus or esophagogastric junction. Hum Pathol 19(8): 942–948 [DOI] [PubMed] [Google Scholar]
- Jankowski JA, Wright NA, Meltzer SJ, Triadafilopoulos G, Geboes K, Casson AG, Kerr D, Young LS (1999) Molecular evolution of the metaplasia-dysplasia-adenocarcinoma sequence in the esophagus. Am J Pathol 154(4): 965–973 [DOI] [PMC free article] [PubMed] [Google Scholar]
- Kendall C, Stone N, Shepherd N, Geoboes K, Warren B, Bennett R, Barr H (2003) Raman spectroscopy, a potential tool for the objective identification and classification of neoplasia in Barrett's oesophagus. J Pathol 200: 602–609 [DOI] [PubMed] [Google Scholar]
- Koljenovic S, Bakker Schut TC, van Meerbeeck JP, Maat AP, Burgers SA, Zondervan PE, Kros JM, Puppels GJ (2004) Raman microspectroscopic mapping studies of human bronchial tissue. J Biomed Opt 9(6): 1187–1197 [DOI] [PubMed] [Google Scholar]
- Kraft C, Knetschke T, Siegner A, Funk RHW, Salzer R (2003) Mapping of single cells by near infrared Raman microspectroscopy. Vib Spectrosc 32: 75–83 [Google Scholar]
- Macdonald CE, Wicks AC, Playford RJ (2000) Final results from 10 year cohort of patients undergoing surveillance for Barrett's oesophagus: observational study. BMJ 321(7271): 1252–1255 [DOI] [PMC free article] [PubMed] [Google Scholar]
- Maiti NC, Apetri MM, Zagorski MG, Carey PR, Anderson VE (2004) Raman spectroscopic characterisation of secondary structure in natively unfolded proteins: α-synuclein. J Am Chem Soc 126: 2399–2408 [DOI] [PubMed] [Google Scholar]
- Mantsch HH, Choo-Smith L, Shaw RA (2002) Vibrational spectroscopy and medicine: an alliance in the making. Vibrat spectros 30: 31–41 [Google Scholar]
- Mc Laughlin C, MacMillan D, McCardie C, Smith WE (2002) Quantitative analysis of mitoxantrone by surface – enhanced resonance Raman scattering. Anal Chem 74: 3160–3167 [DOI] [PubMed] [Google Scholar]
- Montgomery E, Bronner MP, Goldblum JR, Greenson JK, Haber MM, Hart J, Lamps LW, Lauwers GY, Lazenby AJ, Lewin DN, Robert ME, Toledano AY, Shyr Y, Washington K (2001) Reproducibility of the diagnosis of dysplasia in Barrett esophagus: a reaffirmation. Hum Pathol 32(4): 368–378 [DOI] [PubMed] [Google Scholar]
- Pelletier MJ (2003) Quantitative analysis using Raman spectrometry. Appl Spetrosc 57: 20A–42A [DOI] [PubMed] [Google Scholar]
- Prach AT, MacDonald TA, Hopwood DA, Johnston DA (1997) Increasing incidence of Barrett's oesophagus: education, enthusiasm, or epidemiology? Lancet 350(9082): 933. [DOI] [PubMed] [Google Scholar]
- Reid BJ, Haggitt RC, Rubin CE, Roth G, Surawicz CM, Van Belle G, Lewin K, Weinstein WM, Antonioli DA, Goldman H (1988) Observer variation in the diagnosis of dysplasia in Barretts esophagus. Hum Pathol 19(2): 166–178 [DOI] [PubMed] [Google Scholar]
- Shafer-Peltier KE, Haka AS, Fitzmaurice M, Crowe J, Myles J, Dasari RR, Feld MS (2002) Raman microspectroscopic model of human breast tissue, implications for breast cancer diangostics in vivo. J Raman Sprectrosc 33(7): 552–563 [Google Scholar]
- Sharma P, Morales TG, Sampliner RE (1998) Short segment Barrett's esophagus – the need for standardization of the definition and of endoscopic criteria. Am J Gastroenterol 93(7): 1033–1036 [DOI] [PubMed] [Google Scholar]
- Sowa MG, Smith MSD, Kendall C, Bock ER, Ko AC-T, Choo-Smith L-P, Stone N (2006) Compositional Modeling of Multicomponent Systems Using Semi-Parametric Regression of Raman Spectra (Submitted to Applied Spectroscopy) [DOI] [PubMed]
- Stone N, Kendall C, Smith J, Crow P, Barr H (2004) Raman spectroscopy for identification of epithelial cancers. Faraday Discuss 126: 141–157; discussion 169–83 [DOI] [PubMed] [Google Scholar]
- van Sandick JW, van Lanschot JJ, Kuiken BW, Tytgat GN, Offerhaus GJ, Obertop H (1998) Impact of endoscopic biopsy surveillance of Barrett's oesophagus on pathological stage and clinical outcome of Barrett's carcinoma. Gut 43(2): 216–222 [DOI] [PMC free article] [PubMed] [Google Scholar]
- Weinstein WM, Ippoliti AF (1996) The diagnosis of Barrett's esophagus: goblets, goblets, goblets. Gastrointest Endosc 44(1): 91–95 [DOI] [PubMed] [Google Scholar]
- Zhang X, Watson DI, Jamieson GG, Lally C, Bessell JR, Devitt PG (2005) Outcome of oesophagectomy for adenocarcinoma of the oesophagus and oesophagogastric junction. ANZ J Surg 75(7): 513–519 [DOI] [PubMed] [Google Scholar]


