Abstract
The transport of cations across membranes in higher plants plays an essential role in many physiological processes including mineral nutrition, cell expansion, and the transduction of environmental signals. In higher plants the coordinated expression of transport mechanisms is essential for specialized cellular processes and for adaptation to variable environmental conditions. To understand the molecular basis of cation transport in plant roots, a Triticum aestivum cDNA library was used to complement a yeast mutant deficient in potassium (K+) uptake. Two genes were cloned that complemented the mutant: HKT1 and a novel cDNA described in this report encoding a cation transporter, LCT1 (low-affinity cation transporter). Analysis of the secondary structure of LCT1 suggests that the protein contains 8–10 transmembrane helices and a hydrophilic amino terminus containing sequences enriched in Pro, Ser, Thr, and Glu (PEST). The transporter activity was assayed using radioactive isotopes in yeast cells expressing the cDNA. LCT1 mediated low-affinity uptake of the cations Rb+ and Na+, and possibly allowed Ca2+ but not Zn2+ uptake. LCT1 is expressed in low abundance in wheat roots and leaves. The precise functional role of this cation transporter is not known, although the competitive inhibition of cation uptake by Ca2+ has parallels to whole plant and molecular studies that have shown the important role of Ca2+ in reducing Na+ uptake and ameliorating Na+ toxicity. The structure of this higher plant ion transport protein is unique and contains PEST sequences.
Most plants are rooted and are therefore stationary organisms that must adapt to harsh and highly variable conditions including changes in the mineral concentrations and water content of soils (1). Acquisition of essential mineral nutrients from soils may become difficult for plants when the soil solution contains very low concentrations of available macro and micro nutrients or contains high concentrations of toxic metal ions such as Na+ or Al3+. To ensure a supply of minerals from soils under a wide range of environmental conditions, multiple membrane transport mechanisms are present in the plasma and vacuole membranes of higher plants (2).
The cation K+ is important in plant growth because of its vital role in cell expansion, osmoregulation, and cellular homeostasis. In higher plants recent molecular evidence (3–5) supports the model (6, 7) that plant roots contain both high- and low-affinity K+ transporters that ensure an adequate supply of this cation across a wide range of soil K+ concentrations. In saline soils, when K+ availability is low, the uptake and transport of Na+ across membranes may also become important for plant growth because Na+ can partially replace K+ in some species (8). However, because the uptake of excessive amounts of Na+ is toxic to nonhalophytic plants, the compartmentation of Na+ into the vacuole is vital. Physiological mechanisms for transport of Na+ into the plant vacuole have been well described, whereas the mechanistic bases for plasma membrane Na+ uptake are only beginning to be understood. Although the precise mechanisms of plasma membrane Na+ uptake are poorly understood, Na+ tracer flux experiments have shown that Na+ uptake pathways are sensitive to inhibition by Ca2+, where the presence of this divalent cation reduces one or more components of Na+ uptake (9).
More than one low-affinity pathway for Na+ and K+ uptake has been suggested to exist in plants. The presence of multiple loci linked to salt tolerance and Na+ exclusion supports the idea of multiple pathways for Na+ uptake (10). The emerging molecular evidence supports the classical tracer flux data (11, 12), showing that higher plants have multiple K+ and Na+ uptake mechanisms in the plasma membrane for acquisition. Recent studies have further shown that the high-affinity K+ uptake transporter HKT1 (3) has both a high-affinity Na+–K+ coupled uptake component and a low-affinity Na+-selective uptake component at toxic extracellular Na+ concentrations that also block high-affinity K+ uptake via HKT1 (13, 14). Inward rectifying K+ channels are the only low-affinity pathway for K+ uptake in higher plants that have been identified (4, 15–17). However, tracer flux studies have indicated that multiple low-affinity K+ uptake transporters may exist in plants (12). The molecular structure as well as the mode of transport of other low-affinity Na+ and K+ uptake pathways remain unknown.
The cloning of plant membrane transporters by yeast complementation has provided a potent tool that has greatly enhanced our understanding of the physiological roles and specific functional and structural characteristics of ion transporters in higher plants (18). Sucrose, potassium, ammonium, sulfate, copper, amino acid, and iron transporters have all been cloned and characterized in yeast mutants deficient in the uptake of these ions. The yeast system has been highly successful for cloning plant transporters because the complementation strategy relies on functional similarities between yeast and plant physiological mechanisms rather than structural similarities in genes. In principle, this strategy can identify transporters that have a specific substrate, such as K+, but also others that are more promiscuous, such as general transporters for a variety of cations.
The application of the yeast complementation system has allowed us to identify a novel cation transporter in higher plants that could function as a component of the multiple low-affinity Na+ and K+ uptake pathways in roots. In the present study we describe the structure and function of a novel plant membrane transporter (low-affinity cation transporter, LCT1) that complements a yeast mutant deficient in the uptake of K+, transports cations, and contains two sequences enriched in Pro, Ser, Thr, and Glu (PEST) (19).
MATERIALS AND METHODS
Plant, Bacterial, Yeast Strains, and Medium.
RNA and DNA were isolated from Triticum aestivum cv. Atlas 66. Escherichia coli strains DH5α and NM522 were used for cloning and sequencing. Saccharomyces cerevisiae strain CY162 (15) was used for cloning the LCT1 cDNA and for expression studies. Minimal medium (21) supplemented with galactose and sucrose was used for growth of the LCT1-expressing cells, whereas 100 mM KCl was added to the medium for growth of CY162 containing the empty pYES2 vector (Invitrogen). In one growth study where it was necessary to change the medium concentration of K+, a phosphate-based liquid medium was used (22). Growth experiments were conducted in tubes containing 5 ml of medium and samples of 100 μl were taken and the optical density at 600 nm was measured.
Cloning and Sequencing.
A cDNA library was constructed by Invitrogen in the pYES2 vector from wheat root poly(A)+ RNA (3). The selection of complemented yeast mutants has been described (3). Double-stranded DNA was sequenced in both directions (Sequenase; United States Biochemical). In many regions severe compressions required the use of PCR cycle sequencing with dye-labeled primers (Applied Biosystems). PEST scores were calculated by pest-find (http://www.at.embnet.org/embnet/tools/bio/PESTfind) according to the methods described at that web site (23).
Isotope Uptake.
Four different isotopes 86Rb+, 22Na+, 45Ca2+, and 65Zn2+ were used to study the functional characteristics of LCT1 as expressed in the yeast strain CY162. For comparison, uptake rates were also measured in CY162 cells containing the pYES2 plasmid without insert. Cells were grown to the late log phase in minimal medium and washed two times in flux buffer containing 150 μM Ca2+, sucrose (2%) and galactose (2%), and 10 mM Hepes (pH 7.0) unless otherwise indicated. For experiments measuring Ca2+ uptake, Ca2+ was omitted from the flux buffer. Cells were mixed with isotope and harvested on a nylon (0.45 μM) membrane and washed with 10 ml of 50 mM CaCl2. Filters containing washed yeast cells were counted for the incorporation of radioactivity using a liquid scintillation counter (Beckman LS3801). Experiments were conducted over long (40–50 min) and short time intervals (6 min). The rate of uptake in the short term was derived from the slope of a linear regression fitted to the amount taken up at four time points (30, 120, 240, 360 sec).
Reverse Transcription–PCR (RT-PCR) of Wheat DNA and RNA.
RNA was isolated from T. aestivum cv. Atlas 66 using standard guanadine extraction buffer and purified from DNA using a cesium chloride cushion (24). First-strand cDNA synthesis was performed using 1.0 μg total root or total leaf RNA in 10.0 μl reactions using SuperScript II RNase H− Reverse Transcriptase (GIBCO/BRL) according to manufacturers protocol. The first strand was primed with a gene-specific reverse oligonucleotide 5′-cgccgtcgccttgctcgccg-3′ (bp 1557–1576).
In subsequent PCRs, 1.0 μl of each RT reaction was used with Taq polymerase and reaction buffer provided (Bresatec, Adelaide, Australia) in a 25-μl reaction. The forward primer was 5′-tggtcgcctccaagtgccta-3′ (bp 906–925), and the reverse primer was 5′-aacgcgaacgatgctgcgaa-3′ (bp 1400–1419). Temperature cycles were as follows: one cycle of 94°C for 1.5 min, followed by 35 cycles of 94°C for 1 min, 50°C for 1 min, and 72°C for 1 min. Eight microlitres from each PCR reaction was analyzed on a 1.2% agarose gel. To ensure that the expected bands did not come from DNA that may have been copurified with the RNA, “control” RT reactions were set up without the reverse transcriptase enzyme, and those reactions were used in PCRs. Southern blots were also performed.
RESULTS
Complementation of the trk1, trk2 Yeast Mutant by LCT1.
The K+ uptake-deficient yeast strain CY162 was transformed with a wheat root cDNA library in the expression vector pYES2 (Invitrogen). Two clones were recovered from this library screening. One cDNA, HKT1 allowed the yeast strain to grow on medium containing 7 mM and 30 μM K+ (3), and the second cDNA LCT1 conferred growth only on plates with 7 mM K+.
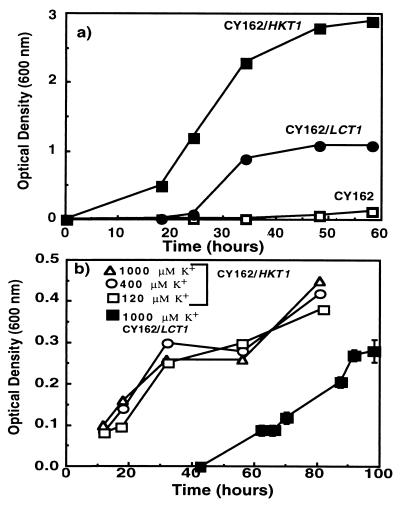
Quantitative growth studies in liquid cultures confirmed that LCT1 complemented the yeast mutant that is deficient in K+ uptake. In medium containing 7 mM K+, after a lag phase of ≈25 h, the CY162 cells expressing LCT1 grew more rapidly than the K+ uptake-deficient CY162 cells transformed with the pYES2 plasmid (Fig. 1a). In all control experiments with the K+ uptake-deficient yeast line, cells were transformed with the empty pYES2 plasmid. LCT1-expressing cells reached stationary phase at ≈0.9 OD600 under these conditions. After a shorter lag phase the CY162 cells expressing HKT1 grew faster and reached a higher final density than LCT1-expressing cells (Fig. 1a).
Figure 1.
Growth of S. cerevisiae strains over time (a) in yeast nitrogen base medium supplemented with sucrose and galactose (7 mM K+) and (b) in arginine-phosphate medium with concentrations of 120–1,000 μM K+ supplemented with sucrose and galactose (means ± SD). All strains were derived by transformation of the CY162 cells and contain the plasmid pYES2. CY162 contains the empty pYES2 plasmid, CY162/HKT1 has the pYES2 plasmid containing HKT1, and CY162/LCT1 has the pYES2 plasmid containing LCT1.
In a separate experiment the growth of LCT1-expressing cells and HKT1-expressing cells was measured over a range of K+ concentrations up to 1 mM in arginine–phosphate liquid medium. LCT1-expressing cells grew after a 40-h lag phase in medium containing 1 mM K+ (Fig. 1b) but did not grow in medium containing 120, 200, or 400 μM K+ (data not shown). This is in contrast to cells expressing the high-affinity K+ transporter HKT1 which grew similarly in medium containing 120, 400, and 1000 μM K+ (Fig. 1b), confirming the high K+ affinity of HKT1 (3).
Analysis of the LCT1 Deduced Amino Acid Sequence.
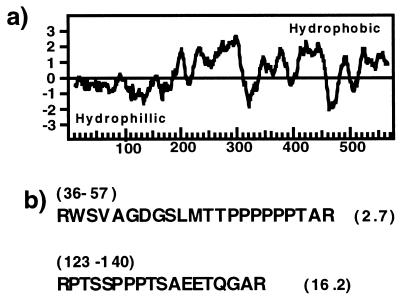
The cDNA sequence encoding LCT1 contains an ORF encoding 574 amino acids which begins from the first start codon encountered at nucleotide 137 of the cDNA. The hydrophobic region of the predicted protein sequence is novel and is not closely related to any polypeptide contained in protein databases as searched using blast (25). Hydropathy analysis shows that the protein has a hydrophilic N terminus followed by hydrophobic domains (Fig. 2a). Approximately 40% of the putative protein is helical and contains 8–10 transmembrane helices as predicted by phdhtm, which is part of the predictprotein program (26).
Figure 2.
Analysis of the nucleotide sequence of LCT1. (a) Hydropathy plot according to Kyte–Doolittle algorithim (42) and window size 19. (b) Deduced amino acid sequence of putative PEST sequences with PEST scores shown at right.
The hydrophilic N terminus of the predicted primary protein structure of LCT1 contains a high density of proline, serine, threonine, and glutamic acid residues that are common to PEST sequences found in rapidly degraded proteins (23). PEST sequence analysis of the N-terminal sequences was completed according to Rogers et al. (19). In the first 140 amino acids of the predicted primary sequence of LCT1 there are two potential PEST regions (Fig. 2b). PEST scores greater than zero are considered to be significant (19). In the putative LCT1 protein there is a highly significant PEST region (score = 16) in comparison with proteins that contain PEST sequences known to function as proteolytic and regulatory signals that score between 2 and 18 (19, 23). In conclusion, LCT1 encodes a novel protein with hydrophobic stretches predicted to traverse the membrane.
Long-Term Uptake Rates.
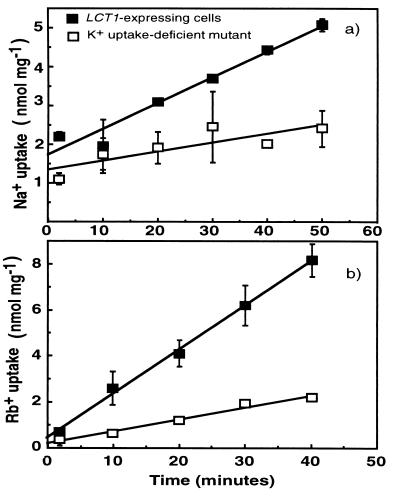
The fact that LCT1 was cloned by complementing a K+ uptake-deficient mutant suggests that the encoded protein can enhance cation uptake. Therefore, uptake of ions into yeast was analyzed. The rate of Na+ and Rb+ uptake into LCT1-expressing cells was relatively low and remained constant for at least 40 min (Fig. 3). Rates of Na+ uptake in nmol/mg−1⋅min−1 were 0.07 for LCT1-expressing cells and 0.02 for K+ uptake-deficient control cells (Fig. 3a). Rates of Rb+ uptake in nmol/mg−1⋅min−1 were 0.19 for LCT1-expressing cells and 0.05 for K+ uptake-deficient cells (Fig. 3b). As expected the differences in the total accumulation of Na+ and Rb+ between LCT1-expressing cells and CY162 cells containing the pYES2 plasmid increased with time (Fig. 3).
Figure 3.
The uptake of Na+ and Rb+ over time in LCT1-expressing cells and the K+ uptake-deficient cells. The mean uptake rates in 1 mM Na+ (a) and 1 mM Rb+ (b) over time in the K+ uptake-deficient cells (□) and in LCT1-expressing cells (▪) (n = 2 for Na+ and n = 4 experiments for Rb+ ± SD). Lines were fitted by linear regression.
Growth and Carbon Supply Affects Uptake Rates.
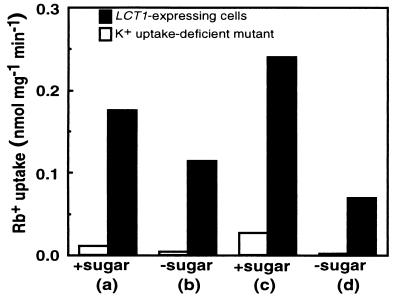
To confirm that the small differences in long-term uptake rates between the K+ uptake-deficient and the LCT1-complemented strains could be detected over shorter time periods, experiments were pursued to measure short-term uptake rates (i) at different phases of growth, and (ii) in the presence or absence of carbon source in the flux buffer. Measurements of short-term uptake rates, which are the most appropriate for measuring net influx rates across the plasma membrane, clearly showed that Rb+ uptake was much greater in LCT1-expressing cells under all conditions (Fig. 4).
Figure 4.
Short-term (6 min) uptake of Rb+ by K+ uptake-deficient cells (open bars) and in LCT1-expressing cells (filled bars) depends on the phase of growth and on the presence of carbon (sucrose/galactose) in the flux buffer. Cells in stationary phase are shown in columns a and b, and cells in the logarithmic phase of growth are shown in columns c and d. Presence of carbon source is denoted by +sugar and absence by −sugar. The rate of uptake was measured in 1 mM Rb+ for LCT1-expressing cells and K+ uptake-deficient cells. Log phase for LCT1-expressing cells was between 0.2 and 0.6 OD600 and for CY162 cells grown in 100 mM KCl was 0.8–1.7.
In both strains the absence of sugar from the flux buffer reduced the rates of Rb+ uptake. The absence of sugars from the flux buffer strongly reduced Rb+ uptake in K+ uptake-deficient cells whereas although Rb+ uptake in the LCT1-expressing cells was reduced in the absence of sugars, it was still substantially higher than that measured in the uptake-deficient cells. In the presence of sugars the growth phase strongly influenced Rb+ uptake rates in the K+ uptake-deficient mutant, which were twice as high during the log phase as in the stationary phase (compare columns a and c in Fig. 4, open bars). These findings provided further confirmation of significantly higher rates of Rb+ uptake into LCT1-expressing cells than into K+ uptake-deficient cells. Differences in Rb+ uptake rates between strains could be detected regardless of growth phase or the presence/absence of carbon source.
The Effect of Monovalent and Divalent Cations on Rb+ Uptake.
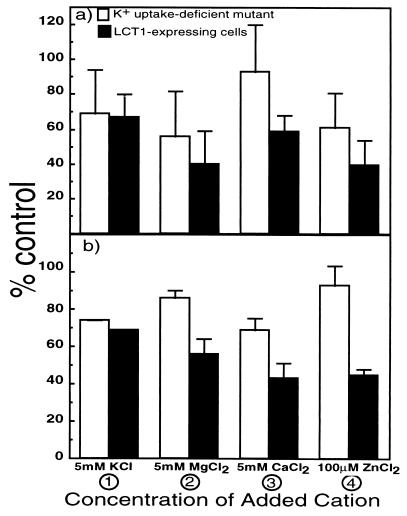
The rate of Rb+ uptake in K+ uptake-deficient control cells (Fig. 5, open bars) and LCT1-expressing cells (Fig. 5, filled bars) was measured over two time periods in the presence of various ions. Short (6 min, Fig. 5a) and longer (40 min, Fig. 5b) term uptake rates were measured in flux buffer containing 1 mM Rb+. Upon addition of 5 mM K+ the uptake rate of Rb+ in both strains was similarly reduced by ≈30% as compared with rates of uptake in the absence of K+ (Fig. 5 a and b, column 1). Note that Rb+ uptake rates in the absence of other added cations (100%) in LCT1-expressing cells were on average 3.5-fold larger than the background Rb+ uptake rates in the K+ uptake-deficient cells (Fig. 3b). Large differences in the reduction of Rb+ uptake between LCT1-expressing cells and control cells were observed when divalent cations or Na+ were added to the buffer. Addition of 5 mM Na+ reduced short-term uptake rates of Rb+ by 54 ± 8% (SD) in LCT1-expressing cells. Short-term uptake rates were unchanged in K+ uptake-deficient cells. In the long-term Rb+ uptake was reduced by 30 ± 8% (SD) in LCT1-expressing cells and 20 ± 14% (SD) in the K+ uptake-deficient cells. Added Ca2+ (5 mM) or Mg2+ (5 mM) reduced Rb+ uptake by 40–60% in LCT1-expressing cells (Fig. 5 a and b, filled bars 2 and 3). In the K+ uptake-deficient control cells Rb+ uptake was reduced to a lesser degree by Mg2+ or Ca2+ (Fig. 5 a and b, open bars 2 and 3). The addition of very low concentrations of Zn2+ (100 μM) caused large reductions (60%) in Rb+ uptake rates into LCT1-expressing cells (Fig. 5 a and b, filled bar 4). Similar trends in the reductions in Rb+ uptake in LCT1-expressing cells were found for both the long (40 min, Fig. 5b) and short (6 min, Fig. 5a) uptake period. Rb+ uptake in control cells and in LCT1-expressing cells showed different sensitivities to competing ions, which provides further support that LCT1 mediates a new transport activity.
Figure 5.
Rubidium uptake measured at 1 mM, as a function of different added ions in LCT1-expressing cells (filled bars) and K+ uptake-deficient cells (open bars) ± SD (n = 3 separate experiments). Uptake of Rb+ was measured over (a) the short term (6 min) and (b) the long term (40 min).
To determine whether LCT1 is permeable to Ca2+ or Zn2+, experiments were conducted with radioactive isotopes of these ions. Many experiments (n > 10) were conducted to determine the permeability of this transporter to Ca2+. Small, but significant, differences in Ca2+ uptake rates between LCT1-expressing cells and K+ uptake-deficient cells were detected. A larger difference in Ca2+ uptake between the mutant strain and the strain expressing LCT1 was difficult to detect presumably because of the background high-affinity Ca2+ uptake previously described in yeast cells (27). In one experiment over short time periods (30–360 sec) Ca2+ uptake rates into LCT1-expressing cells at five different concentrations (0.5, 1.0, 2.0, 3.0, and 4.0 mM) were constant [0.09 ± 0.01 (SD) nmol/mg−1⋅min−1] and three times higher than uptake rates measured in K+ uptake-deficient control cells [0.03 ± 0.01 (SD) nmol/mg−1⋅min−1]. In contrast to Ca2+, no significant difference was observed in the rate of Zn2+ uptake over the same range of external concentrations into LCT1-expressing cells and K+ uptake-deficient cells (data not shown). Because the rate of Zn2+ uptake does not differ between strains, but Zn2+ appears to interfere with Rb+ uptake via LCT1, we suggest that Zn2+ is not significantly transported into cells by LCT1, but blocks the transporter.
Concentration Dependence of Rb+ and Na+ Uptake.
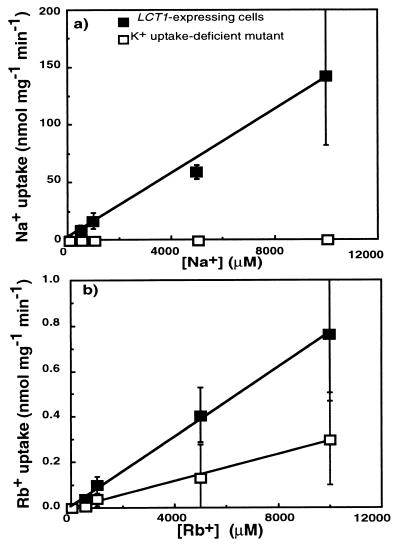
Uptake rates were measured over a range of Rb+ and Na+ concentrations to estimate the affinity of LCT1 for these cations. Over a wide concentration range (50 μM to 10 mM) the rate of uptake by LCT1-expressing cells was linear (r2 = 0.99), and therefore the affinity of the transporter for Na+ was in the low-affinity range (Fig. 6a). Rb+ uptake rates for both strains were also linear up to 10 mM (Fig. 6b; r2 = 0.99). Note that low-affinity Rb+ uptake into maize roots also is linear in the concentration range up to 10 mM (28).
Figure 6.
Short-term (6 min) uptake rates at different concentrations of Na+ and Rb+ by LCT1-expressing cells (▪) and by K+ uptake-deficient cells (□). Means ± SD (n = 3–4 separate experiments) of (a) Na+ uptake and (b) Rb+ uptake. Lines were fitted by linear regression.
In these short-term uptake experiments the absolute rates of Rb+ uptake in LCT1-expressing cells were on average 170 times lower than Na+ uptake rates (Fig. 6). This is in contrast to the long-term experiments at 1 mM where the rates of uptake of Rb+ into LCT1-expressing cells were slightly higher than the rates of Na+ uptake (Fig. 3). Long-term (40 min) uptake rates of Na+ were lower (Fig. 3a) than short-term (6 min) Na+ uptake rates in LCT1-expressing cells (Fig. 6a). Long-term uptake rates may involve adaptations in yeast to Na+ exposure, such as Na+ extrusion by the Na+ ATPases encoded by the ENA gene family (29), which suggests that short-term Na+ uptake rates (Fig. 6) more accurately reflect the transport activity of LCT1. Therefore, the finding that short-term Na+ uptake rates were much higher in LCT1-expressing cells than in the control cells (Fig. 6a) shows that LCT1 potentially mediates significant uptake of Na+.
LCT1 Expression in Planta.
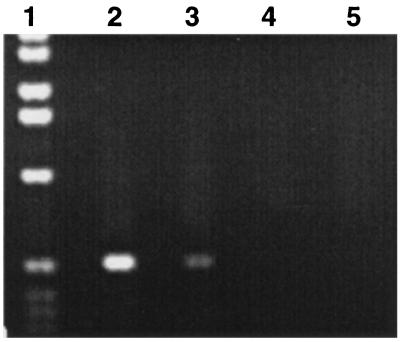
Southern blot analysis of the LCT1 sequence confirmed that this gene is derived from T. aestivum (data not shown). Northern blot analysis and RNase protection assays were not sufficiently sensitive to clearly detect the expression of LCT1 in poly(A)+ RNA isolated from wheat roots. Therefore we developed an RT-PCR protocol suitable for detection of the LCT1 transcript. Preliminary evidence, using RT-PCR, showed that LCT1 is expressed in both leaves and roots of wheat (Fig. 7).
Figure 7.
RT-PCR of total T. aestivum cv. Atlas 66 RNA with LCT1-specific primers. Lanes: 1, 1-kb marker (GIBCO/BRL); 2 and 3, PCRs performed on total T. aestivum root and leaf cDNA, respectively; 4 and 5, PCRs performed on total T. aestivum root and leaf RNA reactions without reverse transcriptase to check for any DNA contamination in RNA.
DISCUSSION
The complementation of yeast cells deficient in K+ uptake, LCT1-mediated cation uptake rates, cation inhibition, and the hydrophobicity of the core region of the predicted protein together strongly support the conclusion that LCT1 is a membrane transport protein. Uptake studies in yeast cells further support this conclusion and show that this transporter has a low affinity for Na+ and Rb+. Although the expression of LCT1 may activate endogenous yeast transport systems, to our knowledge there have been no reports of heterologous membrane protein expression inducing transporter activity in yeast cells, whereas this phenomenon has been observed in Xenopus oocytes (30). In summary we suggest that the LCT1 cDNA encodes a novel transmembrane transport protein and does not merely activate endogenous transport in yeast.
The functional characterization in yeast expressing LCT1 suggests that this protein transports cations into the cell. Although the flux rates of K+ were not measured directly, the ability of LCT1 to complement a yeast mutant deficient in K+ uptake together with data on Rb+ and Na+ uptake show that LCT1 expression leads to K+ uptake into the cell. In three out of four short-term experiments (6 min), the Na+ influx rates at 1 mM were ≈150 times higher than the long-term ones. The lower rates of uptake measured in the long term may be due to the efflux of Na+ via the P-type Na+ ATPase in the yeast plasma membrane (29). Additional studies will be needed to resolve the importance of the LCT1 transporter for Na+ influx into plant cells.
To further characterize this novel transporter, studies on interference by other ions were initiated. The differences in the inhibition of Rb+ uptake by monovalent and divalent cations in LCT1-expressing cells and the K+ uptake-deficient strain provide further evidence for a distinct transport function of LCT1 (Fig. 5). In general we found that influx of Rb+ through LCT1 was sensitive to interference by Zn2+, Ca2+, Mg2+, and Na+, but less sensitive to K+. Zinc effectively blocked Rb+ fluxes, but uptake studies showed that Zn2+ does not permeate the transporter. This functional characteristic may help to identify the permeation pathway through LCT1, as zinc is known to bind to cysteine and histidine residues (31). Six cysteine residues are located in predicted hydrophobic domains, and seven histidines residues are located in predicted intracellular loops.
Calcium also inhibits Rb+ fluxes at higher concentrations and studies using 45Ca2+ suggest that Ca2+ may permeate the transporter. The plant plasma membrane contains multiple pathways for Ca2+ influx, some which may be for the uptake of this essential mineral and others for signaling, in which concentration changes of cytosolic Ca2+ would function as a second messenger. Properties of LCT1 reported here provide evidence that this cDNA may encode a molecular component of Ca2+ uptake pathways in plants.
PEST Sequence.
The LCT1 cDNA described in this paper encodes a protein with two significant PEST sequences (residues 36–57 and 123–140) that score 2.7 and 16.2 in the N-terminal region. PEST sequences have been defined as regions of proteins rich in proline, glutamate, serine, and threonine residues that are not interrupted by positive charges (19, 23). In higher plants few proteins have been described that contain PEST sequences (32, 33).
Many proteins have been identified in other eukaryotes and in prokaryotes that contain PEST sequences (19, 23). PEST sequences appear to provide signals for cellular protease recognition that may either lead to protein degradation or to modification of protein activity by cleavage. The cleavage of a protein may result in changes of the function of the resulting polypeptide as in the case of the mammalian ryanodine receptor Ca2+ channel from sarcoplasmic reticulum (SR) (20) where cleavage of the ryanodine receptor Ca2+ channel by proteases results in an increase in Ca2+ release from SR vesicles (34). Other transporter proteins have been identified that also contain PEST sequences.
In LCT1 we speculate that the PEST sequence may be recognized by a protease and followed by cleavage of the N terminus. Cleavage of these sequences may not occur when LCT1 is expressed in yeast, which may explain the relatively low apparent transport rates. Support for the idea that regions of transport proteins may act as partial inhibitors of transport comes from studies on the plant plasma membrane H+-ATPase (35). Further studies on deletions of sections of the N terminus of LCT1 by proteases or by molecular engineering will be needed to determine whether the absence of PEST sequences increase transport rates and to fully understand the physiological role of this novel plant ion transporter.
A Physiological Role for LCT1.
The low rates of cation uptake through LCT1 when expressed in yeast suggest that this transporter may not play a primary role in providing a pathway for K+ uptake. In higher plants the results of experiments on excised roots have been interpreted to suggest that multiple low-affinity carrier sites exist with different affinities for various cations (12, 36). At the molecular level these different carrier sites may be distinct ion transporters. We suggest that LCT1 may be one of these low-affinity components of cation uptake.
The LCT1 transporter may also play a role in low-affinity uptake of cations such as Na+. Based on the targeting of LCT1 to the yeast plasma membrane, we presume that this protein resides in the plasma membrane of plant cells. Although yeast cells do not always appear to recognize specific plant targeting signals, other signals seem to faithfully target plant proteins to the correct membrane (37). Short-term Na+ uptake rates mediated by LCT1 expression were relatively large (Fig. 6a). The reduction in cation influx by the addition of Ca2+ ions is also important to the postulate that this transporter may play a role in the uptake of Na+ and in plant response to salinity. At the whole plant level it has been shown that the addition of Ca2+ ameliorates Na+ toxicity (38), reduces Na+ uptake and inhibits translocation (39, 40). At the cellular level it was recently shown that Ca2+ partially abolishes the uptake of Na+ into wheat root cells through nonselective cation channels (41).
At high Na+ concentrations (>10 mM Na+), high-affinity K+ uptake via HKT1 is blocked and HKT1 becomes a low-affinity Na+-selective uptake transporter (13, 14). Nevertheless, physiological as well as genetic studies show that more than one pathway for Na+ uptake across the plasma membrane of plant roots exists (5, 10, 12). The properties of LCT1 described here indicate that LCT1 may encode one of the molecular components of low-affinity Na+ uptake in planta.
In conclusion, we have isolated and characterized a unique plant membrane transporter LCT1 that encodes a low-affinity cation transport mechanism. However, the primary physiological role, the major ion that this transporter carries and the precise mechanism of transport (channel or carrier) is not certain. Nevertheless, the finding that LCT1 can provide a low-affinity Na+ uptake component and that Ca2+ inhibits the cation uptake mediated by LCT1 corresponds to properties that have been described for Na+ uptake in plant roots. Further studies will be needed to determine precisely what role the structurally novel LCT1 transporter plays in plant growth and adaptation to environmental conditions such as soil salinity.
Acknowledgments
All of the work presented was completed in the Department of Botany at the University of Adelaide, except for the isolation of the LCT1 cDNA, which was done at the University of California, San Diego. We thank R. Gaber for CY162 and M. Udvardi, P. Ryan, E. Diatloff, and E. Delhaize for comments on the manuscript. This research was funded by grants from the Australian Research Council (D.P.S.) and in part from U.S. Department of Energy grant (DE-FG07-96ER20253) and a U.S. Department of Agriculture grant (95-37304-2227) (J.I.S.).
ABBREVIATIONS
- LCT1
low-affinity cation transporter
- RT-PCR
reverse transcription–PCR
- PEST
sequences rich in Pro, Ser, Thr, and Glu residues
Footnotes
Data deposition: The sequence reported in this paper has been deposited in the GenBank database (accession no. AF015523).
References
- 1.Epstein E. BioScience. 1977;27:783–787. [Google Scholar]
- 2.Marschner H. Mineral Nutrition of Higher Plants. San Diego: Academic; 1995. [Google Scholar]
- 3.Schachtman D P, Schroeder J I. Nature (London) 1994;370:655–658. doi: 10.1038/370655a0. [DOI] [PubMed] [Google Scholar]
- 4.Sentenac H, Bonneaud N, Minet M, Lacroute F, Salmon J, Gaymard F, Grignon C. Science. 1992;256:663–665. doi: 10.1126/science.1585180. [DOI] [PubMed] [Google Scholar]
- 5.Schroeder J I, Ward J M, Gassmann W. Annu Rev Biophys Biomol Struct. 1994;23:441–471. doi: 10.1146/annurev.bb.23.060194.002301. [DOI] [PubMed] [Google Scholar]
- 6.Epstein E, Rains D W, Elzam O E. Proc Natl Acad Sci USA. 1963;49:684–692. doi: 10.1073/pnas.49.5.684. [DOI] [PMC free article] [PubMed] [Google Scholar]
- 7.Maathuis F J M, Sanders D. Physiol Plant. 1996;96:158–168. [Google Scholar]
- 8.Flowers T J, Läuchli A. In: Encyclopedia of Plant Physiology. Läuchli A, Bieleski R L, editors. 15b. Berlin: Springer; 1983. pp. 651–670. [Google Scholar]
- 9.Rains D W, Epstein E. Plant Physiol. 1967;42:314–318. doi: 10.1104/pp.42.3.314. [DOI] [PMC free article] [PubMed] [Google Scholar]
- 10.Omielan J A, Epstein E, Dvorak J. Genome. 1991;34:961–974. [Google Scholar]
- 11.Rains D W, Epstein E. Plant Physiol. 1967;42:319–323. doi: 10.1104/pp.42.3.319. [DOI] [PMC free article] [PubMed] [Google Scholar]
- 12.Epstein E, Rains D W. Proc Natl Acad Sci USA. 1965;53:1320–1324. doi: 10.1073/pnas.53.6.1320. [DOI] [PMC free article] [PubMed] [Google Scholar]
- 13.Rubio F, Gassmann W, Schroeder J I. Science. 1995;270:1660–1663. doi: 10.1126/science.270.5242.1660. [DOI] [PubMed] [Google Scholar]
- 14.Gassmann W, Rubio F, Schroeder J I. Plant J. 1996;10:869–882. doi: 10.1046/j.1365-313x.1996.10050869.x. [DOI] [PubMed] [Google Scholar]
- 15.Anderson J A, Huprikar S S, Kochian L V, Lucas W J, Gaber R F. Proc Natl Acad Sci USA. 1992;89:3736–3740. doi: 10.1073/pnas.89.9.3736. [DOI] [PMC free article] [PubMed] [Google Scholar]
- 16.Schroeder J I, Fang H H. Proc Natl Acad Sci USA. 1991;88:11583–11587. doi: 10.1073/pnas.88.24.11583. [DOI] [PMC free article] [PubMed] [Google Scholar]
- 17.Schachtman D P, Schroeder J I, Lucas W J, Anderson J A, Gaber R F. Science. 1992;258:1654–1658. doi: 10.1126/science.8966547. [DOI] [PubMed] [Google Scholar]
- 18.Frommer W B, Ninnemann O. Annu Rev Plant Physiol Plant Mol Biol. 1995;46:419–444. [Google Scholar]
- 19.Rogers S, Wells R, Rechsteiner M. Science. 1986;234:364–368. doi: 10.1126/science.2876518. [DOI] [PubMed] [Google Scholar]
- 20.Brandt N R, Caswell A H, Brandt T, Brew K, Mellgren R L. J Membr Biol. 1992;127:35–47. doi: 10.1007/BF00232756. [DOI] [PubMed] [Google Scholar]
- 21.Sherman F. Methods Enzymol. 1991;194:3–20. doi: 10.1016/0076-6879(91)94004-v. [DOI] [PubMed] [Google Scholar]
- 22.Rodriguez-Navarro A, Ramos J. J Bacteriol. 1984;159:940–945. doi: 10.1128/jb.159.3.940-945.1984. [DOI] [PMC free article] [PubMed] [Google Scholar]
- 23.Rechsteiner M, Rogers S W. Trends Biochem Sci. 1996;21:267–271. [PubMed] [Google Scholar]
- 24.Sambrook J, Fritsch E F, Maniatis T. Molecular Cloning: A Laboratory Manual. Plainview, NY: Cold Spring Harbor Lab. Press; 1989. [Google Scholar]
- 25.Gish W, States D J. Nat Genet. 1993;3:266–272. doi: 10.1038/ng0393-266. [DOI] [PubMed] [Google Scholar]
- 26.Rost B, Casadio R, Fariselli P, Sander C. Protein Sci. 1995;4:521–533. doi: 10.1002/pro.5560040318. [DOI] [PMC free article] [PubMed] [Google Scholar]
- 27.Borbolla M, Pena A. J Membr Biol. 1980;54:149–156. doi: 10.1007/BF01940568. [DOI] [PubMed] [Google Scholar]
- 28.Kochian L V, Lucas W J. Plant Physiol. 1982;70:1723–1731. doi: 10.1104/pp.70.6.1723. [DOI] [PMC free article] [PubMed] [Google Scholar]
- 29.Haro R, Garciadeblas B, Rodriguez-Navarro A. FEBS Lett. 1991;291:189–191. doi: 10.1016/0014-5793(91)81280-l. [DOI] [PubMed] [Google Scholar]
- 30.Tzounopoulos T, Maylie J, Adelman J P. Biophys J. 1995;69:904–908. doi: 10.1016/S0006-3495(95)79964-7. [DOI] [PMC free article] [PubMed] [Google Scholar]
- 31.Berg J M, Shi Y. Science. 1996;271:1081–1085. doi: 10.1126/science.271.5252.1081. [DOI] [PubMed] [Google Scholar]
- 32.Nixon P J, Komenda J, Barber J, Deak Z, Vass I, Diner B A. J Biol Chem. 1995;270:14919–14927. doi: 10.1074/jbc.270.25.14919. [DOI] [PubMed] [Google Scholar]
- 33.Zhang S H, Lawton M A, Hunter T, Lamb C J. J Biol Chem. 1994;269:17586–17592. [PubMed] [Google Scholar]
- 34.Shoshan-Barmatz V, Weil S, Meyer H, Varsanyi M, Heilmeyer L M G. J Membr Biol. 1994;142:281–288. doi: 10.1007/BF00233435. [DOI] [PubMed] [Google Scholar]
- 35.Palmgren M G, Sommarin M, Serrano R, Larsson C. J Biol Chem. 1991;266:20470–20475. [PubMed] [Google Scholar]
- 36.Elzam O E, Rains D W, Epstein E. Biochem Biophys Res Commun. 1964;15:273–276. doi: 10.1016/0006-291x(64)90159-7. [DOI] [PubMed] [Google Scholar]
- 37.Gal S, Raikhel N V. Plant J. 1994;6:235–240. doi: 10.1046/j.1365-313x.1994.6020235.x. [DOI] [PubMed] [Google Scholar]
- 38.LaHaye P A, Epstein E. Science. 1969;166:395–396. doi: 10.1126/science.166.3903.395. [DOI] [PubMed] [Google Scholar]
- 39.Jacoby B, Hanson J B. Plant Physiol. 1985;77:930–934. doi: 10.1104/pp.77.4.930. [DOI] [PMC free article] [PubMed] [Google Scholar]
- 40.Cramer G, Epstein E, Lauchli A. Plant Cell Environ. 1989;12:551–558. [Google Scholar]
- 41.Tyerman S D, Skerrett M, Garrill A, Findlay G P, Leigh R A. J Exp Bot. 1997;48:459–480. doi: 10.1093/jxb/48.Special_Issue.459. [DOI] [PubMed] [Google Scholar]
- 42.Kyte J, Doolittle R F. J Mol Biol. 1984;157:105–132. doi: 10.1016/0022-2836(82)90515-0. [DOI] [PubMed] [Google Scholar]


