

Abstract
OBJECTIVES
The purpose of this work was to determine cognitive and adaptive behavioral outcomes of children with traumatic brain injury acquired before age 2 years and to compare outcomes between inflicted versus noninflicted brain injury.
PATIENTS AND METHODS
All of the North Carolina children hospitalized in an ICU for a traumatic brain injury before age 2 years between the years 2000 and 2001 were eligible for study entry. A total of 112 surviving children were prospectively identified, 52 (46%) of whom had complete follow-up. Thirty-one control children were recruited from preschool settings. Control subjects were chosen to be demographically similar to case subjects. Child measures of cognition and adaptive behavior at age 3 years were measured and compared between children with and without traumatic brain injury and children with inflicted and noninflicted traumatic brain injury.
RESULTS
Sixty percent of injured children were >1 SD below normal on cognitive testing. Forty percent of injured children scored >1 SD below normal on adaptive behavior testing. Children with inflicted traumatic brain injury performed more poorly on tests of cognition and adaptive behavior. Glasgow Coma Scale ≥13, absence of seizures, income above twice the poverty guidelines, and high social capital were associated with improved outcomes. Injured children had lower scores than uninjured control children after adjustment for socioeconomic status.
CONCLUSIONS
Very young children with mild-to-severe traumatic brain injury as measured by the Glasgow Coma Scale are at risk for global cognitive deficits more than a year after the time of injury. Inflicted brain injury is associated with more severe injury and worse outcomes. This is less optimistic than findings in this same cohort 1 year after injury. Family characteristics seem to play a role in recovery after injury.
Keywords: abuse, traumatic brain injury, shaken baby syndrome, injury, developmental disabilities
Traumatic brain injury (TBI) is one of the most common causes of childhood disability in the United States, with a high proportion of injuries occurring in children <4 years old.1,2 Most longitudinal pediatric studies of the cognitive consequences of TBI have been performed in school-aged children3; however, recent reports indicate that very young children may be more vulnerable to the deleterious effects of acquired TBI than older children.4,5 Longitudinal follow-up of very young children is important, because they must both regain skills and acquire new, more complex skills.
We previously recruited a cohort of children who experienced a TBI before 2 years of age.6 Approximately half of this cohort were victims of abuse.6 This study assessed the neurodevelopmental status of these children at 3 years of age. We examined the influence of injury mechanism, injury severity, and social domains on specific developmental outcome. We hypothesized that children who sustained an inflicted TBI before age 2 years would demonstrate more pervasive deficits in cognitive development and adaptive behavior compared with children with noninflicted TBI. We also expected that differences in the TBI group and the uninjured control subjects would persist after adjustment for socioeconomic disadvantage.
METHODS
TBI Cohort
All children <2 years old who were North Carolina residents and presented to a PICU after a TBI during the years 2000 and 2001 and survived were eligible for inclusion. Methods of recruitment and ascertainment of mechanism of injury have been described previously.6 Briefly, all of the children had either radiographic or pathologic evidence of a nonpenetrating intracranial injury. Mechanism of injury was decided by the child protection team at the hospital of origin and reviewed by 2 of the authors. The legal guardian was asked to consent to interview at 1 and 2 years postinjury.7,8 Families participating in telephone interviews were invited to have their child receive a neurodevelopmental evaluation. Four consenting families moved from the state before evaluation. The children of these 4 families did not have a Mullen score or anthropometric data collected, but all of the other family information and the Scales of Independent Behavior-Revised (SIB-R) were recorded.
Comparison Group
A comparison group of typically developing children, who had similar socioeconomic and racial backgrounds to the TBI group, was recruited from preschools in North Carolina and Southern Virginia. No comparison child had known head injury or other cognitive or physical disabilities by maternal report. This study was approved by the institutional review board at the University of North Carolina at Chapel Hill.
Procedures
Children were tested by 2 members of a team composed of 2 school psychology doctoral students and a pediatric nurse practitioner. The doctoral students were trained in the assessment instruments by a licensed neuropsychologist (Dr Hooper), who accompanied the team on the first 3 home visits and random subsequent visits to insure consistency of the examinations. Family and child-specific data were collected from the maternal caregiver.
Family Level Data
Family data included whether the child was in his/her home of origin, total income to the household, number of people supported by that income, mother’s social capital, and the Hollingshead Four-Factor Index of Social Status (A. B. Hollingshead, PhD, Four Factor Index of Social Status, unpublished manuscript, 1975). Income level was compared with the published North Carolina poverty guidelines from the year 2000.9 Social capital is a construct incorporating a person’s integration with his/her community and family.10 High social capital has been associated with positive developmental outcomes in a group of children aged 2 to 5 years who were thought to be at high risk for poor outcomes secondary to an adverse social or economic environment.11 The social capital index was used as a bivariate descriptor with ≥4 considered “high” social capital as per the study by Runyan et al.11
Child Level Data
Child injury data, including presenting modified pediatric Glasgow Coma Scale (GCS),12,13 presence of posttraumatic seizures, and receipt of cardiopulmonary resuscitation, was ascertained at the time of injury by chart review.14 Children were grouped by GCS score, with mild injury defined as a GCS of 13 to 15, moderate injury as a GCS of 9 to 12, and severe as a GCS of 3 to 8. Children were examined for major disabilities, use of adaptive aids, and anthropometric data at the time of the 3-year-old evaluation.
Cognitive-Developmental Evaluation
The Mullen Scales of Early Learning was chosen to assess cognitive abilities and developmental status.15 Four Mullen subscales were used: visual reception, fine motor, expressive language, and receptive language. An overall composite index (mean: 100; SD: ± 15), the early learning composite (composite), was calculated with its standard score. The Mullen has a sufficiently low floor to assess the most impaired child in the sample. For our purposes, the Mullen composite was dichotomized into reference range and greater (≥85) and below reference range.
Adaptive Behavior Evaluation
The SIB-R reflected the maternal caregiver’s perception of the child’s adaptive behavior.16 This age-normed scale assesses skills needed to function independently in age-appropriate settings. As above, the scale was dichotomized into reference range (≥85) or below reference range.
Statistical Analysis
Characteristics of eligible families of injured children who did not participate were compared with participants using χ2 statistics for categorical variables. Medians were calculated for nonnormally distributed data and compared with the Wilcoxon rank sum test. P values of .05 were considered statistically significant throughout.
Comparison of Children With Inflicted and Noninflicted TBI
Injury and family characteristics were examined. The relative risk (RR) of a low GCS (<13 vs ≥13), dichotomized child race, social capital index, and income status dependent on injury mechanism was calculated with 95% confidence intervals (CIs). The Mullen composite, each Mullen subscale, and the SIB-R were compared. The distributions of the 2 groups were examined by categorizing them into the number of SDs below normal. Then, as the scales were nonnormally distributed, the median and interquartile range (IQR) were calculated for each scale, and the Wilcoxon rank sum test was used to compare scales by injury mechanism. Finally, a correlation coefficient was calculated using the Mullen composite and SIB-R to test whether or not cognitive outcome and adaptive behavior were related.
Predictors of poor outcome were assessed with a bivariate analysis using child and family covariates as predictors and the dichotomized Mullen composite as the outcome. The RR of poor outcome with 95% CI was calculated for categorical variables. Statistically significant covariates in the bivariate models were entered into a proportional odds model. The proportional odds model is a multivariate model used to examine the odds of a child performing 1 SD better on the Mullen composite per unit of change in the predictor variables.
Comparison of Injured Children to Uninjured Control Subjects
Families of injured and uninjured children were compared using the χ2 test. Means were calculated for the Mullen composite, Mullen subscales, and the SIB-R. Student’s t test was used to compare the mean scores of injured to uninjured children. The odds of injured versus uninjured children falling below norm on the Mullen composite were calculated.
To insure that differences observed between the TBI and uninjured groups were not because of socioeconomic status, a propensity score was created using the Hollingshead Index, family income, and child gender.17,18 A common odds ratio (OR) adjusted for propensity score was calculated using exact methods.
RESULTS
Of the 112 surviving children identified with a TBI, 72 (64.3%) participated in telephone follow-up. Fifty-two (72.2%) of the 72 children followed by telephone received a 3-year-old evaluation. Therefore, 46.4% of all of the eligible children in North Carolina were evaluated. Eligible nonparticipants were similar to children and families who participated in the home visit at initial enrollment (Table 1).
TABLE 1.
Baseline Characteristics of Eligible Families and Children Who Did Not Complete the Home Visit Compared With Those Who Completed the Home Visit
| Characteristic | Did Not Complete Home Visit (N = 52)
|
Completed Home Visit (N =60)
|
||
|---|---|---|---|---|
| n | % | n | % | |
| Children | ||||
| Inflicted | 35 | 58.3 | 27 | 51.9 |
| Male | 37 | 61.7 | 30 | 57.7 |
| White | 30 | 50.0 | 26 | 50.0 |
| GSC | ||||
| 13–15 | 29 | 48.3 | 31 | 59.6 |
| 9–12 | 13 | 21.7 | 9 | 17.3 |
| 3–8 | 16 | 26.7 | 12 | 23.1 |
| Missing | 2 | 3.3 | ||
| Age at injury, median (IQR), mo | 5.0 | (2.0–10.0) | 4.2 | (1.8–9.9) |
| Mothersa | ||||
| Age at child’s injury, median, IQR, y | 24 | (20–28) | 24 | (20–28) |
| Married | 25 | 41.7 | 23 | 44.2 |
| Education: high school or more | 36 | 60.0 | 34 | 65.4 |
No statistically significant differences exist between the 2 groups.
These data are from the child’s home of origin.
Injured Group: Family and Child Characteristics
Injured children were most frequently cared for by families with 2 parents (63.5%) whose maternal and paternal caregivers had at least a high school education (78.8% and 77.8%, respectively) and were employed (84.6%). Approximately 29% of the maternal caregivers were foster or adoptive parents. Families were generally poor; 30% were below the North Carolina poverty guidelines, and 69% were below twice the North Carolina poverty guidelines. The most frequent source of maternal income was work performed by herself or another adult (86.5%) as opposed to child support or government support. The mean Hollingshead Index was 32.4 (SD: 13.6). Most families had a social capital index of ≥4 (63.5%).
The median child age at injury was 4.2 months (IQR: 1.8–9.9). Twenty-seven children (52%) had inflicted TBI. One child with inflicted TBI was premature (32 weeks’ gestational age). No child had a history of congenital cardiac, neurologic, or pulmonary disease. No child sustained a second TBI during follow-up.
When children were compared by mechanism of injury, more children with inflicted TBI (55%) had a GCS <13 than children with noninflicted TBI (24%; RR: 1.9; 95% CI: 1.1–3.1). Children were similar when compared by race (RR: 0.8; 95% CI: 0.5–1.4), age at injury (3.7 vs 6.8 months; P = .2), and age at evaluation (3.1 vs 3.2 years; P = .5). Families caring for children after inflicted TBI were not substantively different from families caring for children with noninflicted injuries by Hollingshead Index (P = .8), social capital (RR: 1.7; 95% CI: 0.9–3.2), or income below the North Carolina poverty guidelines (RR: 0.6; 95% CI: 0.3–1.3) or twice below the poverty guidelines (RR: 1.0; 95% CI: 0.6–1.7).
Anthropometrics and Disabilities
The children’s physical assessment revealed that 8.2% were <5th percentile for height and weight. Nearly a quarter of children (23%) were ≥2 SDs below normal for head circumference. The most frequent disabilities were delay in speech acquisition in 19 (36.5%), three quarters of whom had inflicted injuries. Eleven children (21.1%) had ongoing seizure disorders (73% inflicted TBI). Other disabilities included blindness (3), spasticity (5), quadriparesis (1), and hemiparesis (11). Mobility problems were frequent; 17 children (32.7%) required wheel chairs, walkers, or braces (76.4% inflicted TBI). Other adaptive aids included glasses (4), hearing aids (1), gastric feeding tubes (4), and tracheostomy (1).
Neurodevelopmental Evaluation
Children with TBI scored below population norms on the Mullen composite and all of its subscales but scored within population norms in adaptive behavior (Table 2). The composite score was examined by the child presenting modified GCS. Children with a GCS <13 were at an increased risk (RR: 6.6; 95% CI: 1.7–25.5) of having a composite below reference range, although a GCS ≥13 did not guarantee a normal score. In fact, 37% of children with a GCS ≥13 scored below normal on the composite (Fig 1). When the Mullen composite was examined by injury mechanism, more children with inflicted TBI fell into the lowest category (>3 SD below normal) compared with those with noninflicted TBI (40% vs 4.3%; RR: 2.6; 95% CI: 1.6–4.2; Fig 2). Children with inflicted injuries did more poorly across all of the Mullen subscales (Table 2).
TABLE 2.
Cognitive and Adaptive Behavior Outcomes of Children With Inflicted and Noninflicted TBI
| Variable | All Injured Children (N =48), Median (IQR) | Inflicted (n =25), Median (IQR) | Noninflicted (n =23), Median (IQR) | Pa | Norms |
|---|---|---|---|---|---|
| Visual reception subscale | 35.0 (20.0–46.5) | 29 (20–43) | 38 (30–54) | .04 | 50 ± 10 |
| Fine motor subscale | 36.0 (20–52) | 20 (20–45) | 45 (28–53) | .02 | 50 ± 10 |
| Receptive language subscale | 38.5 (24–48) | 24 (20–46) | 43 (35–51) | .01 | 50 ± 10 |
| Expressive language subscale | 34.5 (24.5–43.0) | 30 (20–43) | 38 (31–45) | .02 | 50 ± 10 |
| Early learning comprehension | 77.0 (57.0–91.5) | 68 (49–86) | 84 (68–100) | .02 | 100 ± 15 |
|
| |||||
| SIB-R standard score | 97 (65–120)b | 94 (12–122)c | 100 (79–113)d | .2 | 100 ± 15 |
Wilcoxon Rank Sum Test comparing inflicted to noninflicted traumatic brain injury.
N = 52.
n = 25.
n = 23.
FIGURE 1.
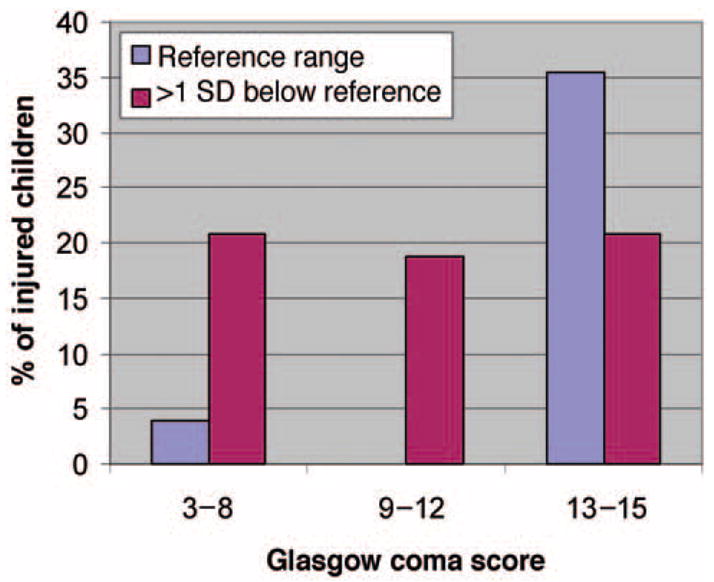
GSC by Mullen early learning composite.
FIGURE 2.
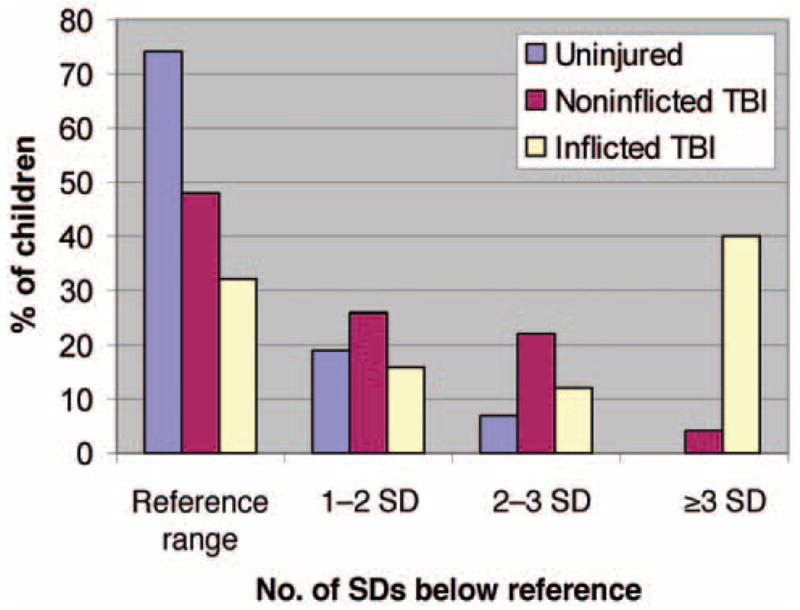
Injured and uninjured children: Mullen early learning composite.
Children with inflicted and noninflicted TBI were compared on the SIB-R. No statistical difference in means was seen between groups (P = .2); however, the distributions were different (Table 2). Children with inflicted TBI were more likely to be ≥3 SDs below normal than children with noninflicted TBI (RR: 1.6; 95% CI: 1.0–2.6) on the SIB-R (Fig 3). The SIB-R was moderately correlated with the Mullen composite (R2 = 0.6).
FIGURE 3.

Injured and uninjured children: SIB-R.
Child and social covariates associated with outcome on the Mullen composite included male gender, posttraumatic seizures, GCS <13, social capital index, and poverty status (Table 3). The multivariate model confirmed these results. After adjustment for all covariates in the model, high GCS category (OR: 12.1; 95% CI: 3.0–48.9), absence of seizures (OR: 6.1; 95% CI: 1.6–24.1), family income above twice the poverty guidelines (OR: 14.5; 95% CI: 2.2–93.5), and high social capital (OR: 5.0; 95% CI: 1.3–18.9) were all predictors of 1 level better of outcome; however, estimates were imprecise because of small numbers.
TABLE 3.
Bivariate Analysis Showing the RR of Being >1 SD Below Normal on Mullen Early Learning Composite Score for Injured Children
| Characteristic | >1 SD Below
|
Reference Range
|
RR | 95% CI | ||
|---|---|---|---|---|---|---|
| N | % | N | % | |||
| Physiologic | ||||||
| Gender | ||||||
| Male | 20 | 69.0 | 7 | 36.8 | 1.7 | (1.0–3.0) |
| Female | 9 | 31.0 | 12 | 63.2 | ||
| Mechanism | ||||||
| Inflicted | 17 | 58.6 | 8 | 42.1 | 1.3 | (0.8–2.1) |
| Noninflicted | 12 | 41.4 | 11 | 57.9 | ||
| Seizure | ||||||
| Yes | 17 | 58.6 | 5 | 16.3 | 2.4 | (1.0–5.5) |
| No | 12 | 41.4 | 14 | 73.7 | ||
| Cardiopulmonary resuscitation | ||||||
| Yes | 7 | 24.2 | 2 | 10.5 | 2.0 | (0.5–7.9) |
| No | 22 | 75.9 | 17 | 89.5 | ||
| GCS | ||||||
| 3–12 | 19 | 65.5 | 2 | 10.5 | 6.6 | (1.7–25.5) |
| 13–15 | 10 | 34.5 | 17 | 89.5 | ||
| Social | ||||||
| Social capital index | ||||||
| <4 | 14 | 48.3 | 3 | 15.8 | 2.9 | (1.0–8.6) |
| ≥4 | 15 | 51.7 | 16 | 84.2 | ||
| Below the poverty level | ||||||
| Yes | 12 | 42.9 | 2 | 10.5 | 1.8 | (1.2–2.7) |
| No | 16 | 57.1 | 17 | 89.5 | ||
| Twice below the poverty level | ||||||
| Yes | 25 | 89.3 | 9 | 47.4 | 3.2 | (1.2–8.7) |
| No | 3 | 10.7 | 10 | 52.6 | ||
| Maternal education | ||||||
| Less than high school | 7 | 24.1 | 4 | 21.1 | 1.04 | (0.8–1.4) |
| High school or greater | 22 | 75.9 | 15 | 78.9 | ||
| Hollingshead Index (categorized) | ||||||
| More than mean | 18 | 69.2 | 8 | 44.4 | 1.8 | (0.9–3.7) |
| Less than mean | 8 | 30.8 | 10 | 55.6 | ||
Comparison of Children With TBI to Uninjured Children
Thirty-one uninjured families and children participated. The mean age of child evaluation was 3.6 years (SD: 0.3 years). Families of the uninjured and TBI children had similar characteristics when compared by marital status (P = .2), employment status (P = .5), maternal and paternal education of high school or more (P = .2 and .7, respectively), income source (P = .5), and percentage below the poverty guidelines (P = .8). Families of uninjured children had a significantly higher Hollings-head Index (median: 42.1; SD: 14.4; P = .002) compared with families of injured children, and uninjured children were more likely to live with their biological mother (P = .01).
Scores of the injured and uninjured children overlapped on both the Mullen scales and the SIB-R. However, TBI children scored significantly lower on the composite and 3 of the 4 Mullen subscales than uninjured children. Both groups scored poorly on the fine-motor subscale (Table 4). The odds of scoring below the reference range on the Mullen composite for a child with TBI compared with an uninjured child was 4.9 (95% CI: 1.9–13.3). After adjustment for propensity score, the common OR of scoring below the reference range remained at 3.9 (95% CI: 1.3–12.4) for children with TBI. Children with TBI also scored lower on the SIB-R (P = .001) than uninjured children.
TABLE 4.
Cognitive and Adaptive Behavior Outcomes of Uninjured Children and Children With TBI
| Variable | Uninjured children (N =31), Mean ± SD | All Injured Children (N =48), Mean ± SD | Pa | Norms |
|---|---|---|---|---|
| Mullen scale scores | ||||
| Visual reception subscale | 50.9 ± 11.9 | 36.4 ± 14.6 | .0001 | 50 ± 10 |
| Fine motor subscale | 41.0 ± 13.2 | 37.8 ± 17.1 | .25 | 50 ± 10 |
| Receptive language subscale | 49.0 ± 12.4 | 37.8 ± 14.1 | .0005 | 50 ± 10 |
| Expressive language subscale | 45.4 ± 8.9 | 35.3 ± 11.8 | .0001 | 50 ± 10 |
| Early learning comprehension | 94.0 ± 18.7 | 77.3 ± 22.0 | .0007 | 100 ± 15 |
| Scales of Independent Behavior Standard Score-Revised | ||||
| SIB-R standard score | 116 (107–131)b | 97 (65–120)b | .001c | 100 ± 15 |
Data are from a t test comparing uninjured with injured children.
Data are median (IQR).
Data are from a Wilcoxon rank sum test comparing uninjured with injured children.
DISCUSSION
This study found that children who suffer a TBI before age 2 years are at high risk for pervasive cognitive deficits and deficits in adaptive behavior. The cognitive deficits are global and include problems in motor, visual processing, and receptive and expressive language. These deficits persist when controlled for social status. Children with inflicted TBI had greater disability and more severe cognitive and adaptive behavior problems than children with noninflicted TBI. All of the participants with TBI were tested ≥1 year postinjury; thus, all should have completed their most rapid recovery phase.19 The results of this formal neurocognitive testing performed, on average, 2 years after injury provide a less optimistic picture than results from telephone follow-up performed for this same cohort of children at 1 year postinjury.8 At that time, children with inflicted injury fared more poorly than children with noninflicted injury; however, more than half of the cohort had, at most, mild deficits recognized. The more optimistic picture obtained from parental interview 1 year after injury could reflect the limitations of the tools used to assess the children’s cognitive function or may reflect parents’ optimism to having their child make some cognitive gains after a critical illness. To our knowledge, these data represent the longest prospective neurodevelopmental follow-up of children with inflicted and noninflicted TBI acquired at similar ages.
Children at risk for cognitive deficits included children with “mild” injury severity as measured by the GCS. Thirty-seven percent of children with a mild GCS score12–14 and all of the children with a moderate range GCS (A. Hollingshead, Four Factor Index of Social Status, unpublished manuscript, 1975)9–11 tested below population norms. Overall, the children’s cognitive abilities were paralleled by their parent-rated adaptive behavior scores; however, cognitive deficits were identified in a subset of children rated well on scales of adaptive behavior.
Children with inflicted TBI had worse outcomes than children with noninflicted TBI; however, degree of disability was associated more strongly with injury severity than injury mechanism. The disproportionate burden of injury in children with inflicted TBI may result from a delay in receiving care, because many children with inflicted injuries become recognized only when they have respiratory distress, seizures, or are unarousable.14 This delay in recognition could add a secondary brain insult, causing the child to have a worse outcome than children with immediately recognized injury. Another possibility is that mechanisms of injury causing inflicted TBI result in more severe injury than those typical of noninflicted TBI. The difference in outcome does not seem to be from social factors alone, because the children’s homes of origin were similar in the 2 groups.14
These results agree partially with a previous study of young children with noninflicted TBI which reported that preschool children with severe TBI had cognitive deficits across multiple domains at follow-up.19 However, unlike our study, children with mild-to-moderate injury did not show persistent deficits. The difference in results may be secondary to older age at injury, higher socioeconomic status, or differences in measures of injury severity in the comparison study.
The severe delay in children with inflicted injuries is consistent with previous reports.20,21 A previous prospective study comparing children with inflicted to noninflicted TBI ~1 month after recovery from posttraumatic amnesia found that 5% of children with noninflicted TBI compared with 45% of children with inflicted TBI scored in the mentally deficient range on formal cognitive testing.21 A combined prospective (n = 12) and cross-sectional (n = 13) study of 25 children with inflicted TBI found that 68% of survivors were abnormal on follow-up.20 These previous studies have been hampered by a lack of prospective longitudinal follow-up,20,22 differential age at injury dependent on injury type,21 and length of follow-up. No previous study has used socioeconomically similar controls.
Environmental influences including poverty and social capital played a role in recovery from injury. Families with better financial means and those able to access family or community resources tended to do better. This finding is unlikely to be secondary to access to medical care, because most families could identify a primary pediatrician and access ancillary therapies.8 Social and economic disadvantage have been shown to be important in infant cognitive development.23–25 Preterm infants have shown short-term developmental gains with the provision of increased stimulation and/or increased social support to families.26 As strategies to enhance parent-infant interactions are teachable to parents, this may be a malleable recovery factor.
This study has limitations. The primary limitation is the size of the cohort. Although the study size limits some conclusions that can be drawn from the analysis because of imprecision, it is the largest study of its kind and represents an effort to follow every child with early TBI during a defined period in an entire state. We were unable to obtain participation from all of the injured children limiting the study’s generalizability. Although this may introduce bias, our sample was similar in those characteristics measured compared with all of the children eligible for study. Finally, although data from the uninjured controls were adjusted for socioeconomic disadvantage, they may differ by important unmeasured covariates.27
CONCLUSIONS
Children who acquire radiographically evident TBI before age 2 years have persisting deficits in both cognitive development and adaptive behavior. Cognitive delays were found both in children with mild injury and care-giver-rated normal adaptive behavior. Because a complete neurodevelopmental evaluation is not a routine part of care after early TBI, delays in cognition may not be identified unless formal comprehensive testing is performed.
Acknowledgments
Dr Keenan is supported by a grant from the National Institute for Child Health and Human Development (K23 HD041040-01A2).
Abbreviations
- TBI
traumatic brain injury
- SIB-R
Scales of Independent Behavior-Revised
- GCS
Glasgow Coma Scale
- RR
relative risk
- CI
confidence interval
- IQR
interquartile range
- OR
odds ratio
Footnotes
The authors have indicated they have no financial relationships relevant to this article to disclose.
Dr Keenan had full access to all of the data in the study and takes responsibility for the integrity of the data and the accuracy of the data analysis.
References
- 1.Langlois J, Rutland-Brown W, Thomas K. Traumatic Brain Injury in the United States: Emergency Department Visits, Hospitalizations, and Deaths. Atlanta, GA: Centers for Disease Control and Prevention, National Center for Injury Prevention and Control; 2004. [Google Scholar]
- 2.Langlois JA, editor. National Center for Injury Prevention and Control. 2000. Traumatic Brain Injury in the United States: Assessing Outcomes in Children. [Google Scholar]
- 3.Ewing-Cobbs L, Barnes M, Fletcher JM, Levin HS, Swank PR, Song J. Modeling of longitudinal academic achievement scores after pediatric traumatic brain injury. Dev Neuropsychol. 2004;25:107–133. doi: 10.1080/87565641.2004.9651924. [DOI] [PubMed] [Google Scholar]
- 4.Taylor HG, Alden J. Age-related differences in outcomes following childhood brain insults: an introduction and overview. J Int Neuropsychol Soc. 1997;3:555–567. [PubMed] [Google Scholar]
- 5.Anderson V, Catroppa C, Morse S, Haritou F, Rosenfeld J. Functional plasticity or vulnerability after early brain injury? Pediatrics. 2005;116:1374–1382. doi: 10.1542/peds.2004-1728. [DOI] [PubMed] [Google Scholar]
- 6.Keenan HT, Runyan DK, Marshall SW, Nocera MA, Merten DF, Sinal SH. A population-based study of inflicted traumatic brain injury in young children. JAMA. 2003;290:621–626. doi: 10.1001/jama.290.5.621. [DOI] [PubMed] [Google Scholar]
- 7.Keenan HT, Runyan DK, Nocera M. Longitudinal follow-up of families and young children with traumatic brain injury. Pediatrics. 2006;117:1291–1297. doi: 10.1542/peds.2005-1883. [DOI] [PMC free article] [PubMed] [Google Scholar]
- 8.Keenan HT, Runyan DK, Nocera M. Child outcomes and family characteristics 1 year after severe inflicted or noninflicted traumatic brain injury. Pediatrics. 2006;117:317–324. doi: 10.1542/peds.2005-0979. [DOI] [PMC free article] [PubMed] [Google Scholar]
- 9.Politz K, Lewis S, Imes R, Bangit I. A Consumer’s Guide to Getting and Keeping Health Insurance in North Carolina. Washington, DC: Georgetown University Institute for Healthcare Research and Policy; 2001. [Google Scholar]
- 10.Coleman J. Social capital in the creation of human capital. Am J Sociol. 1988;94:95–120. [Google Scholar]
- 11.Runyan DK, Hunter WM, Socolar RR, et al. Children who prosper in unfavorable environments: the relationship to social capital. Pediatrics. 1998;101:12–18. doi: 10.1542/peds.101.1.12. [DOI] [PubMed] [Google Scholar]
- 12.Teasdale G, Jennett B. Assessment of coma and impaired consciousness. A practical scale. Lancet. 1974;2:81–84. doi: 10.1016/s0140-6736(74)91639-0. [DOI] [PubMed] [Google Scholar]
- 13.Nichols D, Yaster M, Lappe D, Haller J. Golden Hour: The Handbook of Advanced Pediatric Life Support. 2. St Louis, MO: Mosby; 1996. [Google Scholar]
- 14.Keenan HT, Runyan DK, Marshall SW, Nocera MA, Merten DF. A population-based comparison of clinical and outcome characteristics of young children with serious inflicted and noninflicted traumatic brain injury. Pediatrics. 2004;114:633–639. doi: 10.1542/peds.2003-1020-L. [DOI] [PMC free article] [PubMed] [Google Scholar]
- 15.Mullen E. Mullen Scales of Early Learning. Circle Pines, MN: American Guidance Srvices, Inc; 1995. [Google Scholar]
- 16.Bruininks R, Woodcock R, Weatherman R, Hill B. Scales of Independent Behavior-Revised. Itasca, IL: Riverside Publishing; 1996. [Google Scholar]
- 17.Rubin DB. Estimating causal effects from large data sets using propensity scores. Ann Intern Med. 1997;127:757–763. doi: 10.7326/0003-4819-127-8_part_2-199710151-00064. [DOI] [PubMed] [Google Scholar]
- 18.Newgard CD, Hedges JR, Arthur M, Mullins RJ. Advanced statistics: the propensity score—a method for estimating treatment effect in observational research. Acad Emerg Med. 2004;11:953–961. doi: 10.1197/j.aem.2004.02.530. [DOI] [PubMed] [Google Scholar]
- 19.Ewing-Cobbs L, Fletcher JM, Levin HS, Francis DJ, Davidson K, Miner ME. Longitudinal neuropsychological outcome in infants and preschoolers with traumatic brain injury. J Int Neuropsychol Soc. 1997;3:581–591. [PubMed] [Google Scholar]
- 20.Barlow KM, Thomson E, Johnson D, Minns RA. Late neurologic and cognitive sequelae of inflicted traumatic brain injury in infancy. Pediatrics. 2005;116(2) doi: 10.1542/peds.2004-2739. Available at: www.pediatrics.org/cgi/content/full/116/2/e174. [DOI] [PubMed]
- 21.Ewing-Cobbs L, Kramer L, Prasad M, et al. Neuroimaging, physical, and developmental findings after inflicted and noninflicted traumatic brain injury in young children. Pediatrics. 1998;102:300–307. doi: 10.1542/peds.102.2.300. [DOI] [PubMed] [Google Scholar]
- 22.King WJ, MacKay M, Sirnick A. Shaken baby syndrome in Canada: clinical characteristics and outcomes of hospital cases. CMAJ. 2003;168:155–159. [PMC free article] [PubMed] [Google Scholar]
- 23.Yeates KO, Taylor HG, Drotar D, et al. Preinjury family environment as a determinant of recovery from traumatic brain injuries in school-age children. J Int Neuropsychol Soc. 1997;3:617–630. [PubMed] [Google Scholar]
- 24.Aylward GP. The relationship between environmental risk and developmental outcome. J Dev Behav Pediatr. 1992;13:222–229. [PubMed] [Google Scholar]
- 25.Sameroff AJ, Seifer R, Barocas R, Zax M, Greenspan S. Intelligence quotient scores of 4-year-old children: social-environmental risk factors. Pediatrics. 1987;79:343–350. [PubMed] [Google Scholar]
- 26.Taylor HG, Klein N, Hack M. School-age consequences of birth weight less than 750 g: a review and update. Dev Neuropsychol. 2000;17:289–321. doi: 10.1207/S15326942DN1703_2. [DOI] [PubMed] [Google Scholar]
- 27.Braveman PA, Cubbin C, Egerter S, et al. Socioeconomic status in health research: one size does not fit all. JAMA. 2005;294:2879–2888. doi: 10.1001/jama.294.22.2879. [DOI] [PubMed] [Google Scholar]