

SUMMARY
Mammalian target of rapamycin, mTOR, is a major sensor of nutrient and energy availability in the cell and regulates a variety of cellular processes including growth, proliferation and metabolism. Loss of the tuberous sclerosis complex genes (TSC1 or TSC2) leads to constitutive activation of mTOR and downstream signaling elements, resulting in the development of tumors, neurological disorders, and at the cellular level, severe insulin/IGF-1 resistance. Here, we show that loss of TSC1 or TSC2 in cell lines and mouse or human tumors causes endoplasmic reticulum (ER) stress and activates the unfolded protein response (UPR). The resulting ER stress plays a significant role in the mTOR-mediated negative-feedback inhibition of insulin action and increases the vulnerability to apoptosis. These results demonstrate ER stress as a critical component of the pathologies associated with dysregulated mTOR activity and offer the possibility to exploit this mechanism for new therapeutic opportunities.
INTRODUCTION
Tuberous sclerosis complex (TSC) is an autosomal dominant disease characterized by benign tumors of the brain, kidney, skin and other vital organs leading to neurological disorders, such as severe epilepsy, mental retardation, and autism and a variety of other clinical manifestations resulting from the widespread occurrence of hamartomas. The genes mutated in this disease, TSC1 and TSC2, encode tumor suppressors that are associated in a complex, such that deficiency of either gene gives rise to TSC. Akt/PKB and other growth factor-activated kinases phosphorylate TSC2 and inhibit down stream signaling from the TSC1-2 complex (Inoki et al., 2002; Ma et al., 2005; Manning et al., 2002; Roux et al., 2004). TSC2 has a GTPase activating protein (GAP) domain that has GAP activity toward the small G protein called Ras homolog enriched in brain (Rheb) (Garami et al., 2003; Saucedo et al., 2003; Tee et al., 2003; Zhang et al., 2003). Loss of TSC2 function either by TSC2- or TSC1-deficiency leads to constitutive activation of mammalian target of rapamycin (mTOR) and downstream signaling pathways due to increased levels of GTP-bound Rheb (Garami et al., 2003; Saucedo et al., 2003; Tee et al., 2003; Zhang et al., 2003). Therefore, the TSC1-2 complex, through its Rheb-GAP activity, is a critical negative regulator of mTOR under physiological conditions.
TOR proteins function in two evolutionarily conserved complexes called TOR complex 1 and 2 (mTORC1 and mTORC2) (Loewith et al., 2002). mTORC1 is composed of mTOR, raptor and mLST8/GβL and is sensitive to rapamycin (Hara et al., 2002; Kim et al., 2002; Kim et al., 2003). It regulates cell growth, proliferation and metabolism through mTOR-mediated phosphorylation of eukaryotic initiation factor 4E (eIF4E)-binding proteins (4E-BP) and the ribosomal protein S6 kinases (S6K1 and S6K2) (Hara et al., 2002; Kim et al., 2002). Ultimately, phosphorylation of 4E-BP-1 and S6K1/2 increases protein synthesis by stimulation of cap-dependent translation. Activation of mTOR also leads to increased ribosomal biogenesis (Dann and Thomas, 2006; Harris and Lawrence, 2003; Hay and Sonenberg, 2004; Inoki et al., 2005; Kwiatkowski and Manning, 2005; Sarbassov et al., 2005a). mTORC2 is composed of mTOR, rictor, mSIN1 and mLST8/GβL, and this branch of mTOR action is resistant to acute inhibition by rapamycin (Loewith et al., 2002). Activation of mTORC2 has been shown to regulate Akt serine 473 phosphorylation (Sarbassov et al., 2005b). While it is clear that mTORC1 activity is increased upon loss of the TSC genes, a role for mTORC2 downstream of the TSC1-2 complex and Rheb has not been established.
Interestingly, increased or dysregulated activation of the mTORC1 pathway triggers a negative-feedback loop blocking insulin and IGF1 receptor (IR) signaling to phosphoinositide 3-kinase (PI3K) and Akt. This is most apparent in cells lacking the TSC1-2 complex. TSC-deficient cells are refractory to insulin-induced tyrosine phosphorylation of insulin receptor substrate-1 (IRS-1), and IRS–2, and activation of PI3K and Akt (Harrington et al., 2004; Shah et al., 2004; Dann & Thomas 2006). TSC-deficiency can also lead to decreased IRS-1 abundance at both the mRNA and protein levels (Harrington et al., 2004; Shah et al., 2004). While critical in integrating cellular metabolic responses, the molecular mechanisms responsible for the negative-feedback regulation of insulin action through the TSC-mTORC1 pathway are not fully understood.
Uncontrolled protein synthesis and dysfunctional nutrient sensing challenge the integrity of the endoplasmic reticulum (ER). Folding and maturation of secreted and membrane-bound proteins take place in the ER and increased protein trafficking, as well as conditions that perturb cellular nutrient and energy homeostasis can lead to ER stress and activation of a complex signaling network called the unfolded protein response (Marciniak and Ron, 2006; Schroder and Kaufman, 2005). This signaling cascade is primarily initiated by the type-I transmembrane kinases, inositol requiring enzyme-1 (IRE-1) and PKR-like endoplasmic reticulum kinase (PERK), and a type-II transmembrane protein, activating transcription factor-6 (ATF-6) (Marciniak and Ron, 2006; Schroder and Kaufman, 2005). Activation of PERK leads to phosphorylation of eukaryotic translation initiation factor 2 alpha (eIF2α) at serine 51 and consequently results in global translational attenuation under ER stress conditions (Harding et al., 2000; Harding et al., 1999). IRE-1 has both kinase and endoribonuclease activity (Cox et al., 1993; Mori et al., 1993). The kinase activity of IRE-1 activates c-Jun amino-terminal kinase (JNK) through a pathway mediated by tumor necrosis factor (TNF) receptor-associated factor-2 (TRAF-2) and apoptosis signal-regulating kinase-1 (ASK-1) (Urano et al., 2000). JNK subsequently triggers stress and inflammatory responses and insulin resistance (Aguirre et al., 2000; Hirosumi et al., 2002; Tuncman et al., 2006). The endoribonuclease domain of IRE-1 cleaves the mRNA of a transcription factor called X-Box Binding Protein-1 (XBP-1) and initiates the removal of 26bp from the full length XBP-1 mRNA, leading to translation of a higher molecular weight protein called the spliced form of XBP-1 (XBP-1s) (Calfon et al., 2002; Yoshida et al., 2001; Schroder & Kaufman 2005). The XBP-1s acts as a highly active transcription factor and is one of the master regulators of ER folding capacity (Lee et al., 2003).
We have found that the conditions accompanying states of obesity increase the demand on ER function and lead to ER stress in metabolically active tissues (Ozcan et al., 2004, Hotamisligil 2005). Interestingly, experimental or obesity-induced ER stress is a critical regulator of insulin action in vitro and in vivo and a key mechanism leading to insulin resistance and type 2 diabetes in the whole organism (Ozcan et al., 2004, Hotamisligil 2006). The principal mechanism that underscores the inhibition of insulin action during ER stress is the inhibition of IRS-1 tyrosine phosphorylation through IRE-1-dependent activation of JNK (Ozcan et al., 2004). Serine phosphorylation of IRS-1 is a critical event in the inhibition of insulin receptor signaling (Hotamisligil et al., 1996, Zick 2005). JNK plays a causal role in development of insulin resistance and type-2 diabetes in obesity and inhibits insulin action through phosphorylation of IRS-1 at serine 307 (Aguirre et al., 2000; Hirosumi et al., 2002; Tuncman et al., 2006).
These observations led us to postulate that dysregulated protein synthesis and disturbances in nutrient signaling caused by uncontrolled mTORC1 signaling might lead to ER stress in TSC-deficient cells and tumors, thereby contributing to the feedback inhibition of insulin/IGF1 action and other pathologies associated with this condition. In the present study, we have investigated the relationship between the TSC-mTORC1 pathway and the unfolded protein response (UPR) as they relate to insulin receptor signaling and apoptotic responses.
RESULTS
Loss of the TSC1 and TSC2 Genes Causes ER Stress and Activates the UPR
To investigate whether deficiency of TSC1–2 complex function and consequently sustained activation of mTORC1 leads to UPR, we have analyzed several biochemical and molecular indicators of ER stress, such as PERK phosphorylation (Thr980) and expression of genes involved in the UPR (i.e., GRP78 and CHOP) in TSC1- and TSC2-deficient cell lines. As shown in figure 1A, Tsc1−/− mouse embryonic fibroblasts (MEFs) exhibited constitutive mTORC1 activity, as indicated by robust rapamycin-sensitive S6K1 (Thr389) and ribosomal protein S6 (Ser235/236) phosphorylation under basal, unstimulated conditions. These cells also exhibit a marked increase in PERK phosphorylation compared to a littermate-derived wild-type (WT) control cell line (Figure 1A, triplicates shown) indicating the presence of ER stress. In addition to PERK phosphorylation, the spliced form of X-box binding protein 1 (XBP-1s) and the mRNA levels of glucose-regulated protein 78 (GRP78) and CHOP were significantly increased in Tsc1−/− cells indicating that the IRE-1 arm of the UPR is also significantly activated. Rapamycin treatment for 24 hours suppressed mTOR activity, completely reversed PERK phosphorylation and significantly reduced XBP-1 splicing and the expression of CHOP and GRP78 mRNAs in Tsc1−/− cells (Fig. 1A–B).
Figure 1. Analysis of UPR and mTORC1 signaling pathways in Tsc1−/− and Tsc2−/− cells.

(A) PERK (Thr980) phosphorylation, XBP-1 mRNA splicing and downstream elements of mTORC1 signaling; phosphorylation of S6K1 (Thr389), total S6K1 levels and S6 (Ser235/236) phosphorylation in the presence or absence of rapamycin (20 nM) for 24 hours in Tsc1−/− MEFs and WT controls (triplicates shown). (B) Expression levels of CHOP, GRP78, and XBP-1s mRNAs in Tsc1+/+ and Tsc1−/− cells treated either with rapamycin or vehicle. (C) UPR and mTOR signaling parameters in Tsc2−/− MEFs reconstituted with a retroviral control vector (+VEC) or with a retrovirus containing the WT TSC2 gene. (D) CHOP, GRP78, and XBP-1s mRNA levels in TSC2-deficient cells reconstituted with either vector or WT TSC2 upon treatment with rapamycin (20 nM) or vehicle, as above. (E) Time course of rapamycin’s effect on PERK phosphorylation in Tsc2−/− MEFs. Tsc2+/+ (WT) or Tsc2−/− cells were serum starved for 24 h in the presence of rapamycin (20 nM) for the duration indicated. Data are mean ± SEM of triplicates.
As mentioned above, loss of either TSC1 or TSC2 function results in activation of the mTORC1 pathway. To test if TSC2-deficiency also results in UPR, we have examined the components of this pathway in littermate-derived Tsc2+/+ and Tsc2−/− MEFs. Similar to the TSC1-deficiency, Tsc2−/− cells also exhibited increased PERK phosphorylation and XBP-1 splicing as well as increased GRP78 and CHOP expression compared to WT controls (Supplementary Figure S1A–B). All of these UPR indicators were also reversible upon treatment of Tsc2−/− cells with rapamycin. Importantly, cycloheximide treatment also completely suppressed PERK (Thr980) phosphorylation in both Tsc1−/− and Tsc2−/− cells (Fig. S1C), supporting the hypothesis that increased protein synthesis is likely the underlying mechanism for activation of UPR in TSC1- and –2-deficient cells. Finally, we utilized a third experimental system where Tsc2−/− cells were stably reconstituted with either an empty control retrovirus or TSC2-expressing retrovirus to allow comparisons within the same cellular background and causally link the absence of TSC2 to development of ER stress. As shown in figure 1C, TSC2-deficiency-induced activation of UPR, with rapamycin-sensitive increases in the phosphorylation of PERK (Thr980), XBP-1 splicing, and expression of GRP78 and CHOP, could be rescued by the reconstitution of Tsc2−/− cells with the TSC2 gene. Taken together, these results demonstrate that TSC-deficiency leads to ER stress and the induction of UPR, in both Tsc1−/− and Tsc2−/− cells, is mTORC1 dependent. We also tested the kinetics of the impact of rapamycin on activation of ER stress by monitoring PERK phosphorylation in Tsc2−/− cells. These experiments demonstrated that rapamycin treatment resulted in diminished PERK phosphorylation starting at 2–6h of treatment (Fig. 1E), a time course consistent with the impact of cycloheximide treatment on ER stress (data not shown).
Upregulation of UPR Parameters in Tumors Lacking TSC2
Tsc2+/− mice develop several distinct tumors including liver hemangiomas and kidney adenomas upon loss of heterozygosity at the Tsc2 locus (Kobayashi et al., 1999; Onda et al., 1999), and these tumors also exhibit elevated mTORC1 activity (Lee et al., 2005; Manning et al., 2005). Hence, we examined whether TSC-deficiency in vivo leads to ER stress in these tumors. Figure 2A and B illustrate the liver hemangiomas and kidney adenomas developed in the Tsc2+/− mice at one year of age. As expected, there was a significant and widespread increase in S6 phosphorylation in both of these tumors, indicating increased activity of the mTORC1 pathway (Fig. 2C, D). Analysis of UPR markers such as the phosphorylated forms of PERK, eIF2α and IRE-1 showed striking immunoreactivity in the hemangiomas but not in the surrounding normal tissues. Similarly, increased GRP78 staining in the kidney adenomas support the presence of ER stress in these tumors (Fig. 2D). Since the kidney adenomas in aged Tsc2+/− mice (20 months) are quite large and can easily be separated from the surrounding normal tissue, we also biochemically analyzed markers of the mTORC1 pathway and ER stress in extracts from these tumors or adjacent normal tissue following treatment with either vehicle or rapamycin (10 mg/kg) for 2 days. As shown in figure 2E, similar to S6K1, phosphorylation of PERK and eIF2α display a marked up-regulation in the tumor tissue relative to the adjacent normal tissue, providing further evidence for the activation of UPR in the TSC2-deficient adenomas. Consistent with the data obtained from cells lacking TSC1 or TSC2 function, the activation of UPR in TSC-deficient tumors is the result of elevated mTORC1 activity, as it is strongly sensitive to rapamycin (Fig. 2E).
Figure 2. Increased UPR in tumors arising in TSC2+/− mice.

(A) Hematoxylin & Eosin staining of the sections from the liver and (B) kidneys of Tsc2+/− mice at 12 months of age illustrating the presence of hemangiomas and adenomas, respectively. (C) Immunofluoresence staining of phospho-S6 (Ser235/236), phospho-IRE-1, phospho-PERK (Thr980) and phospho-eIF2α (ser51) in the liver hemangiomas of Tsc2+/− mice. (D) Immunofluoresence staining for phospho-S6 and GRP78 in the same cystic adenoma shown in panel B. (E) Detection of phospho-S6K1 (Thr389), total S6K1, phospho-PERK (Thr980), phospho-eIF2α (ser51) and total eIF2α levels by immunoblotting extracts from either adjacent normal kidney tissue (N) or kidney adenomas (T) removed from 20-months old Tsc2+/− mice treated with either rapamycin (10 mg/kg) or vehicle for 2 consecutive days. Mice were sacrificed and extracts were prepared 12 hours after the second dose. Representative samples are shown.
In addition to tumors that arise in the mouse model of TSC, we also analyzed a cortical tuber resection from a TSC patient, removed during epilepsy surgery. Cortical tubers are amongst the most common tumor arising in TSC patients and contain characteristic “giant cells’ that display elevated mTORC1 signaling and are readily identified by their expression of vimentin (Baybis et al., 2004). As shown in figure 3A, the vimentin-positive giant cells exhibit increased S6 phosphorylation. Analysis of eIF2α phosphorylation in the sections from the tuber revealed that giant cells also have increased eIF2α phosphorylation (Fig. 3B). Besides the vimentin-positive giant cells, enlarged dysplastic neurons within the tuber, identified by SMI-311 staining (Wang et al., 2007), also displayed significant eIF2α phosphorylation and strong staining for GRP78/BIP protein (Fig. 3C, D). Taken together, the data produced in TSC-deficient cells, mouse models of TSC, and human tissues demonstrate that loss of TSC function and the consequent increase in mTORC1 activity is associated with development of ER stress and activation of UPR.
Figure 3. Analysis of UPR in a cortical tuber dissected from a 3 year-old patient with tuberous sclerosis.
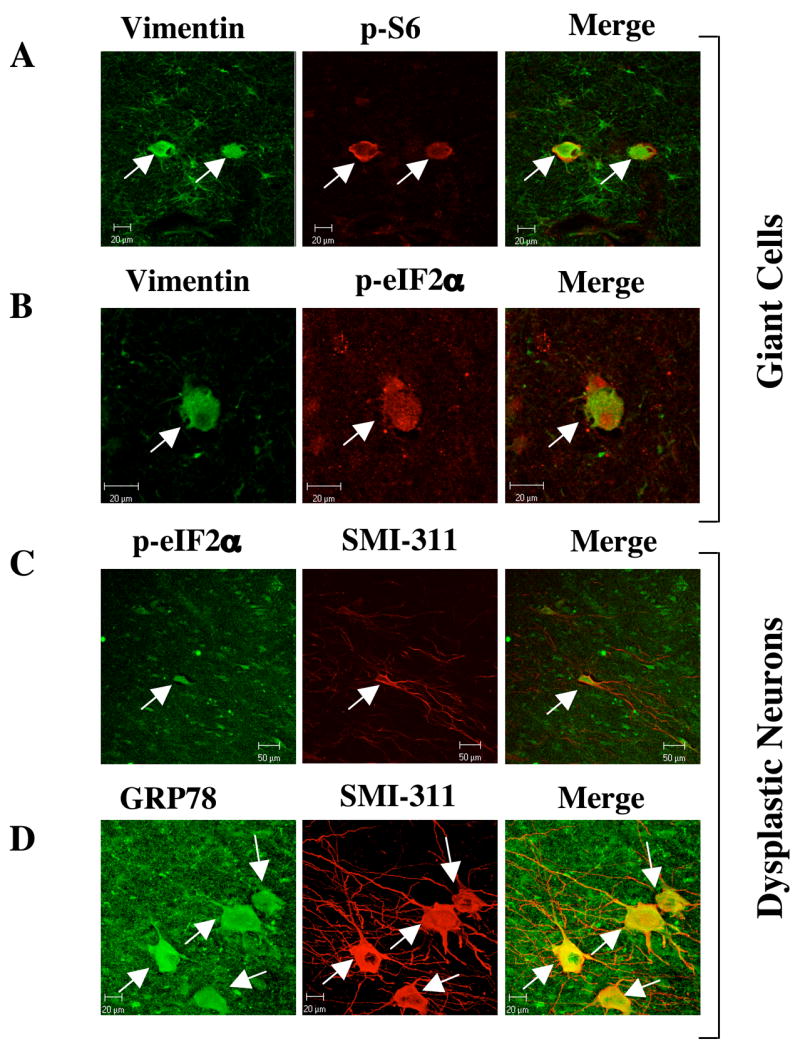
(A) Vimentin and phospho-S6 (ser235/236) staining of the tuber identify enlarged glial cells in which the mTORC1 pathway has been activated. Adjacent tissue contains many weakly-vimentin positive astroglia that do not contain phospho-S6 immunoreactivity. (B) Vimentin and phospho-eIF2α (ser51) staining in a tuber shows an enlarged cell that contains immunoreactivity for both glial marker vimentin and UPR marker phospho-eIF2α. (C) SMI-311 and phospho-eIF2α staining in a tuber shows an enlarged neuron, which contains immunoreactivity for the UPR marker phospho-eIF2α (ser51). Scale bar represents 50μm (D) SMI-311 and GRP78 staining in a tuber section shows several enlarged neurons that are immuno-reactive for the UPR marker GRP78. Scale bar represents 20μm.
Treatment of TSC-deficient Cells with a Chemical Chaperone Decreases ER Stress and Alleviates UPR
Recently, we have shown that chemical chaperones including 4-phenyl butyric acid (PBA) alleviate ER stress in cultured cells and whole animals and consequently rescue defective insulin action in obesity (Ozcan et al., 2006). Hence, this reagent provided a unique opportunity to modulate ER stress and examine its functional consequences in TSC-deficiency. To explore the role of UPR in TSC-deficient cells, we first investigated if treatment with PBA would result in reduction of ER stress and UPR. Indeed, treatment of TSC1-deficient cells with PBA significantly decreased PERK phosphorylation, XBP-1 mRNA splicing, and expression levels of GRP78 and CHOP genes (Fig. 4A–B). Similarly, in TSC2-deficient cells PBA treatment resulted in complete reversal of PERK phoshorylation and marked suppression of CHOP, XBP-1s and GRP78 expression (Fig. 4C–D). These PBA-mediated changes in ER stress indicators in TSC-deficient cells occurred despite sustained elevation of mTORC1 activity compared to WT cells, although a small decrease in S6K1 and S6 phosphorylation was noted under these conditions. These results clearly demonstrate the utility of PBA to alleviate ER stress in TSC-deficient cells.
Figure 4. Effect of PBA treatment on UPR in TSC1- and TSC2-deficient cells.

(A) PERK (Thr980) phosphorylation after 4-PBA (10 mM) treatment for 24 hours in Tsc1−/− MEFs. Phospho-S6K-1 (Thr389), total S6K-1, and phospho-S6 (ser235/236) levels were analyzed with or without 4-PBA treatment in Tsc1−/− MEFs, shown in triplicate. (B) mRNA levels of CHOP, XBP-1s and GRP78 in Tsc1+/+ and in Tsc1−/− cells either in the presence or absence of 4-PBA (10mM) after 24 hours incubation. (C) PERK phosphorylation (Thr980), phospho-S6K-1 (Thr389), and total S6K-1, phospho-S6 (ser235/236) levels with or without 4-PBA treatment in Tsc2−/− (+VEC) MEFs and in their controls Tsc2−/− (+TSC2) cells. (D) CHOP, XBP-1s and GRP78 gene expression levels in WT (+TSC2) and Tsc2−/− (+VEC) cells treated with PBA (10mM) or PBS for 24 hours. Data are mean ± SEM of triplicates.
The impact of ER stress on Insulin Signaling in TSC-deficiency
Having established the efficacy of PBA in improving ER function, we then asked whether the negative-feedback inhibition of insulin receptor signaling seen in TSC-deficient cells is a consequence of ER stress. UPR leads to inhibition of insulin receptor signaling (Ozcan et al., 2004) primarily through a pathway involving IRE-1 mediated JNK activation, IRS-1 phosphorylation, and inhibition of downstream signaling. Therefore, we first investigated whether the increased UPR in TSC null cells is sufficient to increase JNK activity. As shown in figure 5A, Tsc2−/− cells have significantly higher JNK activity when compared to cells expressing TSC2. Furthermore, treatment with either rapamycin or PBA in Tsc2−/− cells resulted in reduction of JNK activity, indicating its link to increased ER stress. As reported previously, Tsc1−/− and Tsc2−/− cells are severely defective in insulin action (Harrington et al., 2004; Radimerski et al., 2002; Shah et al., 2004), and insulin stimulation did not result in the expected increase in IRS-1, IRS–2 or Akt phosphorylation in these cells (Fig. 5B–D). To examine whether this unresponsiveness to insulin is related to UPR, we treated the Tsc1−/− (Fig. 5B) and Tsc2−/− (Fig. 5C) cells with PBA and examined insulin receptor signaling. Treatment with PBA significantly enhanced the insulin-induced phosphorylation of IRS-1, IRS–2 and Akt in Tsc1−/− cells (Fig. 5B) and Tsc2−/− cells (Fig. 5C). Experiments in the TSC2-reconstituted Tsc2−/− cells also demonstrated that significant recovery of insulin receptor signaling could be achieved in the vector infected cells upon alleviation of ER stress with PBA (Fig. 5D). These data indicate that the UPR plays a causal role in the development of defective insulin action in cells lacking TSC genes and is one of the components of the negative-feedback mechanism resulting in insulin resistance.
Figure 5. Role of UPR in development of insulin resistance in TSC1- and TSC2- deficient cells.

(A) IP-kinase assay on JNK activity in Tsc2−/− cells reconstituted either with an empty retroviral vector or a TSC2 expressing vector after vehicle, rapamycin (20 nM) and 4-PBA (10 mM) treatment for 24 hours, shown in triplicate. (B–C) Analysis of insulin stimulated tyrosine phosphorylation of IRS-1 and IRS-2, and phosphorylation of Akt (serine 473) in Tsc1−/− (B) and Tsc2−/− (C) cells in the absence or presence of 4-PBA (10mM) for 24 hours. (D) IRS-1 tyrosine and Akt (serine 473) phosphorylations in Tsc2−/− (+TSC2) and Tsc2−/− (+VEC) MEFs after 4-PBA treatment. (E) Ubiquitination of IRS-1 after 8 hours of Thapsigargin (300 nM) or Tun (2 μg/ml) treatment in the presence of epoximicin (1 μg/ml) (F) IRS-1 protein levels in the presence of cycloheximide (100 μg/ml) after 20 hours of 4-PBA (10 mM) pre-treatment of Tsc1−/− cells. (G). Decreased ER stress and recovery of insulin-stimulated IRS-1 and Akt phosphorylation in Tsc2−/− MEFs by expression of exogenous spliced XBP-1 (sXBP-1). sXBP-1 is introduced into the cells by an adenoviral expression system and the bottom panel shows the protein levels obtained in the cells. Phosphorylation of PERK is examined to monitor ER stress.
In addition to defects in insulin-stimulated tyrosine phosphorylation, IRS-1 protein levels are also suppressed in cells lacking TSC1 or TSC2. This has previously been linked to decreased gene expression as well as increased protein degradation (Harrington et al., 2004; Shah et al., 2004). Interestingly, decreasing ER stress with PBA led to a substantial increase in IRS-1 protein levels, suggesting regulation at an additional level (Fig. 5B–D). Therefore, we investigated the possibility of increased degradation of IRS-1 due to ER stress in the TSC-deficient cells. We have previously shown that induction of acute ER stress results in IRS-1 serine phosphorylation and inhibition of insulin-induced tyrosine phosphorylation of this molecule (Ozcan et al., 2004). We show here that exposure to prolonged ER stress may also lead to increased degradation of IRS-1. Stimulation of WT Fao cells with either of two ER stress-inducing agents, tunicamycin or thapsigargin, for 8 hours in the presence of the proteosome inhibitor epoxomicin resulted in pronounced ubiquitination of IRS-1 (Fig. 5E). To determine the relevance of this mechanism to TSC-deficiency, we examined the relative stability of IRS-1 with or without pre-treatment with PBA in TSC1- and TSC2-deficient cells. As shown in Figure 5F, in cycloheximide-treated Tsc1−/− cells IRS-1 protein was rapidly degraded and was undetectable by one hour. In contrast, pretreatment with PBA significantly extended the stability of IRS-1 in TSC-deficient cells and no reduction in protein level was evident up to 4 hours. While less pronounced, PBA treatment also increased the stability of IRS-2 in the Tsc1−/− cells. Similar results were also obtained in Tsc2−/− cells (data not shown).
In addition to the use of chemical chaperones, ER folding capacity can also be increased by overexpression of sXBP-1 levels (Ozcan et al., 2004). We therefore examined whether defective insulin receptor signaling in TSC-deficient cells could be rescued by an alternative strategy through introduction of active sXBP-1 exogenously into these cells to reduce ER stress. In fact, expression of sXBP-1 in Tsc2−/− cells using an adenoviral expression system resulted in decreased PERK phosphoryation validating this approach to reduce ER stress and UPR signaling (Fig. 5G). Parallel to these changes in ER stress, there was also significantly increased insulin-stimulated phosphorylation of both IRS-1 and Akt1 in Tsc2−/− cells expressing sXBP-1 (Fig. 5G). This effect was most significant for Akt, as insulin stimulation of vector expressing TSC-deficient cells did not result in any detectable Akt phosphorylation. In contrast, upon introduction of sXBP-1, Akt phosphorylation was readily detectable in Tsc-2−/− cells. There was also an increase in IRS-1 protein levels in sXBP1 expressing cells. These data indicate that ER stress adversely affects several important elements of insulin receptor signaling in TSC-deficient cells and significantly contributes to the development of cellular insulin resistance.
TSC-deficient Cells and Tumors are Vulnerable to ER Stress-induced Apoptosis
It is well established that ER stress is linked to apoptotic pathways (Boyce and Yuan, 2006; Marciniak and Ron, 2006; Schroder and Kaufman, 2005). Interestingly, previous studies have reported that Tsc1−/− and Tsc2−/− cells are highly sensitive to apoptosis induced by glucose deprivation (Inoki et al., 2003). Since glucose deprivation is a strong inducer of ER stress, we investigated whether the sensitivity to apoptosis seen in TSC-deficient cells could be the result of chronic ER stress and an inability to adapt to additional challenges imposed on the ER. If this postulate were valid, TSC-deficient cells would be anticipated to succumb to ER stress-inducing agents with increased apoptosis. To test this, we exposed the TSC1- and TSC2-deficient cells and their littermate-derived controls to thapsigargin for 8 hours and analyzed the extent of apoptosis. Induction of ER stress with thapsigargin did not significantly increase apoptosis in WT cells, but this same treatment lead to an elevated apoptotic response in both Tsc1−/− and Tsc2−/− cells (Fig. 6A). We next analyzed the molecular indicators of apoptosis in an additional model of ER stress induced by tunicamycin, which blocks protein glycosylation in the ER. In Tsc2−/− cells, exposure to tunicamycin resulted in marked increases in caspase-3 and PARP cleavage compared to wild-type (reconstituted with TSC2) controls (Fig. 6B). This enhanced ER stress-induced apoptosis is inhibited by rapamycin treatment, demonstrating that hyperactive mTORC1 in TSC-deficient cells is responsible for the heightened sensitivity to ER stress-induced cell death (Fig. 6B).
Figure 6. TSC1- and TSC2-deficiency increases vulnerability to ER stress induced apoptosis.

(A) TSC1- and TSC2-deficient cells and their corresponding controls were incubated overnight in 2% FBS-containing medium and then treated with thapsigargin (300nM) for 6 hours and apoptosis levels were analyzed by ELISA (B) Tsc2−/− cells reconstituted either with TSC2 or with a control vector were stimulated with tunicamycin (2 μg/ml) for 14 hours in the presence of rapamycin (20nM) or DMSO as control. Immunoblotting was performed to analyze the levels of cleaved caspase-3 and cleaved PARP. (C) Tsc2−/− cells reconstituted with vector or TSC2 were starved of glucose for 16 hours in the presence or absence of 4-PBA (10 mM) or rapamycin (20 nM). (D). Induction of apoptosis in Tsc-deficient tumors in vivo by treatment with thapsigargin. Tsc-deficient tumor and surrounding normal tissues were sectioned following thapsigargin treatment and stained with H&E and Tunel to detect apoptotic cells. (E). A model of the interactions between TSC function and insulin resistance. TSC-deficiency results in increased mTOR activity which triggers uncontrolled protein synthesis leading to development ER stress and through this mechanism, insulin resistance. In this setting, ER stress also sensitizes cells to apoptosis. Data are mean ± SEM of triplicates.
These results demonstrate that loss of TSC1 or TSC2 leads to hypersensitivity to ER stress-induced death. In attempts to link the enhanced apoptotic phenotype of the TSC-deficient cells to ER stress in an additional paradigm, we finally investigated whether ER stress contributes to the previously observed sensitivity to glucose deprivation-induced apoptosis in TSC2–deficient cells (Inoki et al., 2003). PBA pretreatment for 6 hours, which relieves the basally elevated ER stress in TSC-deficient cells, reversed the sensitivity of these cells to glucose deprivation (Fig. 6C, top). In PBA-treated Tsc2−/− cells, glucose-deprivation-induced caspase 3 and PARP cleavage were significantly suppressed compared to controls. The extent of the impact of PBA was similar to the protection against apoptosis provided by rapamycin (Fig. 6C, bottom).
Since the TSC-deficient tumors also exhibit up-regulated UPR, we finally tested whether administration of an ER stress-inducing agent, thapsigargin, would also lead to apoptosis of tumor cells in vivo. In these experiments, apoptosis was examined by tunnel assay in kidney adenomas from one-year old Tsc2+/− mice following treatment with thapsigargin (1 mg/kg) or vehicle for 7 consecutive days. As shown in figure 6D, numerous tunnel-positive cells were detected in the tumors following thapsigargin treatment. Apoptotic cells were not detected in normal surrounding kidney tissue in thapsigargin-treated mice or in tumors from vehicle-treated controls, indicating that the TSC-deficient tumor cells are more sensitive to ER stress-induced apoptosis in vivo.
DISCUSSION
mTORC1 Signaling and the Unfolded Protein Response
The TSC-mTORC1 circuit resides at the junction of several important pathways that play crucial roles in energy and nutrient sensing, metabolism, cell growth and differentiation (Dann and Thomas, 2006; Harris and Lawrence, 2003; Hay and Sonenberg, 2004; Inoki et al., 2005; Kwiatkowski and Manning, 2005; Sarbassov et al., 2005a). As nutrient availability and energy status is critically linked to protein synthesis, proper mTOR action is critical for many metabolic processes and its dysregulation results in an array of pathologies. In a parallel fashion, the proper monitoring and maintenance of ER function is also critical in connecting cellular nutrient and energy status to protein synthesis. As a result, the ER is exquisitely sensitive to perturbations in synthetic pathways and to energy and nutrient fluctuations. The UPR system ensures proper and often short-term adaptation of the ER function to the demand of the cells. UPR pathways work as a coordinated signaling network to regulate protein synthesis and increase the folding capacity of the ER. At points where the organelle cannot adapt to the given perturbation, UPR initiates apoptotic pathways. Hence, the integration of UPR and ER function with proper regulation of mTORC1, a major nutrient sensing and growth regulatory pathway, could be considered as a logical link for the coordinated function of metabolic and survival pathways.
The results presented here indicate that ER stress and activation of the UPR pathway is an important pathological feature of TSC and contributes to critical functional abnormalities in insulin/IGF1 action and cell survival. These observations demonstrate a previously unrecognized connection between two critical and highly conserved regulatory pathways and are of interest for several reasons. First, the factors contributing to the negative feedback regulation of insulin and IGF1 action in TSC-deficient cells and in other conditions of aberrant mTORC1 activation are poorly understood. Here, we show that UPR contributes to the emergence of this negative feedback signal in TSC-deficient cells, at least in part, through the activation of JNK, which plays a crucial role in inhibition of IRS-1 activity and the development of insulin resistance both in vitro and in vivo (Hirosumi et al., 2002, Hotamisligil 2006). As insulin is a major stimulus for many biosynthetic pathways including protein synthesis, the feedback inhibition of insulin action in the presence ER stress is likely to represent an adaptive response and might even be considered part of the UPR. Since increased mTORC1 signaling (Um et al. 2004; Khamzina et al., 2005) and ER stress (Ozcan et al., 2004) are both critical features of obesity and insulin resistance, the impact of their coordinated action could have implications beyond TSC-deficiency to metabolic diseases such as type 2 diabetes.
UPR is unlikely to be the only mechanism leading to defective signaling downstream of insulin and IGF1 in TSC-deficient cells. Previous studies have suggested a role for S6K1 activity in the feedback regulation of insulin receptor signaling during mTOR activation in obesity (Um et al., 2004). There is also evidence supporting direct regulation of insulin action by the mTORC1 pathway through phosphorylation of IRS-1, although the physiological relevance of these modifications is currently unclear (Harrington et al., 2004; Tzatsos and Kandror 2005). In the experimental paradigm utilized here, we demonstrate that even under conditions of high levels of S6K1 activity, alleviation of ER stress can prevent IRS-1 degradation and rescue, at least in part, insulin action in TSC-deficient cells. In this setting, increased mTORC1 activity, increased S6K activity, and elevated protein synthesis are upstream of ER stress and UPR and therefore reversible by rapamycin (see Fig. 6E). ER stress and UPR is upstream of insulin receptor signaling as insulin action could be recovered, at least in part, by alleviation of ER stress by chemical or genetic means in Tsc2−/− cells. These observations suggest a multilevel integration between the mTORC1-mediated nutrient sensing apparatus and insulin action in cells. This link might be a narrow response specific to conditions with decreased TSC1-2 complex function, thereby serving to protect the cells from further aberrant protein synthesis and stress in the ER by partially blocking protein translation (via eIF2α phosphorylation) and insulin/IGF1 responsiveness. Alternatively, the involvement of the ER in coordinating the insulin- and nutrient-stimulated signals transmitted through the TSC-mTORC1 pathway may be a general mechanism to ensure ER integrity.
A second interesting feature of these findings is that hyperactivity of the mTORC-1 pathway due to loss of the TSC1-2 complex leads to extreme sensitivity to ER stress-causing agents, and ER stress underlies, at least in part, the increased sensitivity to glucose deprivation-induced cell death seen previously in TSC-deficient cells (Inoki et al., 2003). Since all cells exhibit only a limited adaptive capacity to energy stress and metabolic dysregulation, the activities of distinct survival pathways are often coordinately regulated. In this regard, it is not surprising to uncover a link between ER-related apoptotic responses and the nutrient and energy sensing TSC-mTORC1 pathway. Taken together, we postulate that the ER plays a critical role in integration of metabolic and survival responses through mTORC1 signaling.
Pathologic and therapeutic implications
Our observations may have critical implications for the diseases related to mTORC1 dysregulation, where activation of UPR and its contributions to the pathophysiological properties of these diseases should be considered. As mentioned above, obesity and diabetes represent such conditions which feature increased mTORC1 signaling and ER stress. Under these conditions, the integrated stress response is causal to development of insulin resistance, at least in experimental models, and could be reversed by modulation of the ER. Downstream of mTORC1, S6K1 has also been linked to systemic insulin resistance and abnormal insulin secretion and glucose metabolism (Pende et al., 2000; Um et al., 2004). Increased mTOR activity may also be a contributing factor to obesity-induced ER stress. Hence, in the chronic and relatively milder activation of mTORC1 signaling observed in these systems, mTORC1-S6K1 and UPR might cooperate in a condition of energy surplus to disrupt insulin action without the effective engagement of apoptotic pathways.
On the other hand, it is possible to envision strategies to take advantage of the acute susceptibility to ER stress-induced apoptosis that might accompany all tumors associated with severe dysregulation of mTORC1. For instance, the high levels of ER stress and the selective sensitivity of TSC-deficient cells to ER stress-inducing agents could offer unique therapeutic opportunities in tuberous sclerosis complex and perhaps in other tumor syndromes characterized by aberrantly high mTOR signaling. This postulate is supported by our observations here that thapsigargin treatment leads to apoptosis in TSC-deficient tumors in vivo. Although the currently available ER stress-inducing agents, such as tunicamycin and thapsigargin, are also toxic to normal cells in the body, the heightened susceptibility of TSC-deficient cells to ER stress could be potentially advantageous for selectively inducing apoptosis in tumor cells at low doses. As such, development of more selective and less toxic agents to trigger ER stress- pathways might offer new therapeutic opportunities for the many cancers and other tumor syndromes that feature dysregulated activity of the mTORC1 pathway.
Experimental Procedures
Biochemical reagents
Anti-IRS-1 and anti-IRS-2 antibodies were from Upstate Biotechnology (Charlottesville, VA). Antibodies against phosphotyrosine, JNK-1 were from Santa Cruz Biotechnology (Santa Cruz, CA). Anti-phospho S6K, anti-S6Kl, anti-phospho-PERK, antiphospho-eIF2α, anti-Akt and anti-phospho Akt antibodies and c-Jun fusion protein were from Cell Signaling Technology (Beverly, MA). Monoclonal antibody against vimentin (clone V9) was from Chemicon (Temecula, CA), and neurofilament (NF) (SMI-311) was from Sternberger (Lutherville, MD). The polyclonal anti-phospho-eIF-2α antibody (Ser52) was from Stressgen. Fluorescein-conjugated (FITC-conjugated) goat anti-rabbit IgG were from Jackson Immuno Research Laboratories (West Grove, PA). Thapsigargin and tunicamycin were from Calbiochem (San Diego, CA). Cell Death ELISA system and BM chemiluminescence blotting substrate (POD) were from Roche (Indianapolis, IN). The antiphospho-IRE-1 antibody was kindly provided from Dr. Fumihiko Urano from University of Massachusetts.
Analysis of ER stress parameters
All of the TSC cell lines (Tscl+/+, Tscl−/−, Tsc2+/+, Tsc2−/−) were kindly provided by David J. Kwiatkowski (Boston, MA) and were maintained in medium containing DMEM-H+10%FBS+1%PS (penicillin-streptomycin mixture). At 75% confluence, experiments were initiated by adding 20nM rapamycin or 10mM PBA in fresh medium (DMEM-H+10%FBS+1%PS) for 19 hours. Following three washes with DMEM-H cells were incubated for an additional 5 hours in DMEM-H without FBS containing rapamycin, PBA or a vehicle controls (DMSO or PBS, respectively). Experiments were terminated by removal of medium and immediately freezing in liquid nitrogen. For gene expression experiments, cells were kept in 2–3% serum for 19 hours prior to 5-hour serum starvation.
Insulin Signaling, protein extracts, and immunoprecipitation
For insulin signaling experiments, cells were treated as above. At the end of the 5-hour serum starvation period, cells were stimulated with 100 nM insulin (or with PBS as vehicle controls) for 5 minutes to examine IR, IRS-1 and IRS-2 tyrosine phosphorylation and 15 minutes for Akt (serine 473) phosphorylation. Following each experiment, cells were immediately frozen in liquid nitrogen and kept at −80°C. Details of preparation of protein extracts, western blotting and INK kinase assays are in the supplemental materials.
Rapamycin and thapsigargin treatment of Tsc2+/− mice
Aged cohorts of Tsc2+/− mice (C57BL/6j-129/SvJae background) were treated with 10 mg/kg rapamycin or vehicle controls, where indicated, by daily i.p. injections. Animals were euthanized 12 hours after the final treatment and dissected for tissue harvesting. Tissues were either fixed in 10% formalin for histopathology and immunohistochemistry or snap frozen in liquid nitrogen and homogenized for protein extracts. The details of the immunohistochemisty methods are provided in the supplemental materials.
Apoptosis ELISA
Cells were placed in 96 well plates in DMEM-H+10%FBS+1%PS at 40–50% confluence. Upon reaching 80% confluency, cells were washed with DMEM-H without FBS and thapsigargin (10nM) or DMSO were applied for 6 hours in DMEM-H+1%PS but without FBS. Apoptosis was analyzed by using cell death ELISA system and experiments were performed using manufacturer’s instructions.
Supplementary Material
Acknowledgments
This work is supported in part by grants from the NIH to GSH (DK53063) and BDM (CA122617), the American Diabetes Association to BDM and GSH, Children’s Hospital Boston Mental Retardation and Developmental Disabilities Research Center (P01 HD18655) to MS, the Tuberous Sclerosis Alliance to MS and KD, and junior faculty start up funds to UO. LO is supported by a Mentor Based Postdoctoral Fellowship from the American Diabetes Association. We thank Alex Lipovsky, Burcak Civan and Rebecca Foote for technical assistance and Dr. Fumihiko Urano for the antibodies against IRE-1. We are indebted to David J. Kwiatkowski for providing many of the cell lines and mice used in this study.
Footnotes
Publisher's Disclaimer: This is a PDF file of an unedited manuscript that has been accepted for publication. As a service to our customers we are providing this early version of the manuscript. The manuscript will undergo copyediting, typesetting, and review of the resulting proof before it is published in its final citable form. Please note that during the production process errors may be discovered which could affect the content, and all legal disclaimers that apply to the journal pertain.
References
- Aguirre V, Uchida T, Yenush L, Davis R, White MF. The c-Jun NH(2)-terminal kinase promotes insulin resistance during association with insulin receptor substrate-1 and phosphorylation of Ser(307) J Biol Chem. 2000;275:9047–9054. doi: 10.1074/jbc.275.12.9047. [DOI] [PubMed] [Google Scholar]
- Baybis M, Yu J, Lee A, Golden JA, Weiner H, McKhann G, 2nd, Aronica E, Crino PB. mTOR cascade activation distinguishes tubers from focal cortical dysplasia. Ann Neurol. 2004;56:478–487. doi: 10.1002/ana.20211. [DOI] [PubMed] [Google Scholar]
- Boyce M, Yuan J. Cellular response to endoplasmic reticulum stress: a matter of life or death. Cell Death Differ. 2006;13:363–373. doi: 10.1038/sj.cdd.4401817. [DOI] [PubMed] [Google Scholar]
- Calfon M, Zeng H, Urano F, Till JH, Hubbard SR, Harding HP, Clark SG, Ron D. IRE1 couples endoplasmic reticulum load to secretory capacity by processing the XBP-1 mRNA. Nature. 2002;415:92–96. doi: 10.1038/415092a. [DOI] [PubMed] [Google Scholar]
- Cox JS, Shamu CE, Walter P. Transcriptional induction of genes encoding endoplasmic reticulum resident proteins requires a transmembrane protein kinase. Cell. 1993;73:1197–1206. doi: 10.1016/0092-8674(93)90648-a. [DOI] [PubMed] [Google Scholar]
- Dann SG, Thomas G. The amino acid sensitive TOR pathway from yeast to mammals. FEBS Lett. 2006;580:2821–2829. doi: 10.1016/j.febslet.2006.04.068. [DOI] [PubMed] [Google Scholar]
- Garami A, Zwartkruis FJ, Nobukuni T, Joaquin M, Roccio M, Stocker H, Kozma SC, Hafen E, Bos JL, Thomas G. Insulin activation of Rheb, a mediator of mTOR/S6K/4E-BP signaling, is inhibited by TSC1 and 2. Mol Cell. 2003;11:1457–1466. doi: 10.1016/s1097-2765(03)00220-x. [DOI] [PubMed] [Google Scholar]
- Hara K, Maruki Y, Long X, Yoshino K, Oshiro N, Hidayat S, Tokunaga C, Avruch J, Yonezawa K. Raptor, a binding partner of target of rapamycin (TOR), mediates TOR action. Cell. 2002;110:177–189. doi: 10.1016/s0092-8674(02)00833-4. [DOI] [PubMed] [Google Scholar]
- Harding HP, Zhang Y, Bertolotti A, Zeng H, Ron D. Perk is essential for translational regulation and cell survival during the unfolded protein response. Mol Cell. 2000;5:897–904. doi: 10.1016/s1097-2765(00)80330-5. [DOI] [PubMed] [Google Scholar]
- Harding HP, Zhang Y, Ron D. Protein translation and folding are coupled by an endoplasmic-reticulum-resident kinase. Nature. 1999;397:271–274. doi: 10.1038/16729. [DOI] [PubMed] [Google Scholar]
- Harrington LS, Findlay GM, Gray A, Tolkacheva T, Wigfield S, Rebholz H, Barnett J, Leslie NR, Cheng S, Shepherd PR, et al. The TSC1–2 tumor suppressor controls insulin-PI3K signaling via regulation of IRS proteins. J Cell Biol. 2004;166:213–223. doi: 10.1083/jcb.200403069. [DOI] [PMC free article] [PubMed] [Google Scholar]
- Harris TE, Lawrence JC., Jr TOR signaling. Sci STKE 2003. 2003:re15. doi: 10.1126/stke.2122003re15. [DOI] [PubMed] [Google Scholar]
- Hay N, Sonenberg N. Upstream and downstream of mTOR. Genes Dev. 2004;18:1926–1945. doi: 10.1101/gad.1212704. [DOI] [PubMed] [Google Scholar]
- Hirosumi J, Tuncman G, Chang L, Gorgun CZ, Uysal KT, Maeda K, Karin M, Hotamisligil GS. A central role for JNK in obesity and insulin resistance. Nature. 2002;420:333–336. doi: 10.1038/nature01137. [DOI] [PubMed] [Google Scholar]
- Hotamisligil GS, et al. IRS-1-mediated inhibition of insulin receptor tyrosine kinase activity in TNF-α- and obesity-induced insulin resistance. Science. 1996;271:665–668. doi: 10.1126/science.271.5249.665. [DOI] [PubMed] [Google Scholar]
- Hotamisligil GS. Role of endoplasmic reticulum stress and c-Jun NH2-terminal kinase pathways in inflammation and origin of obesity and diabetes. Diabetes. 2005;54:S73–S78. doi: 10.2337/diabetes.54.suppl_2.s73. [DOI] [PubMed] [Google Scholar]
- Hotamisligil GS. Inflammation and metabolic disorders. Nature. 2006;444:860–7. doi: 10.1038/nature05485. [DOI] [PubMed] [Google Scholar]
- Inoki K, Corradetti MN, Guan KL. Dysregulation of the TSC-mTOR pathway in human disease. Nat Genet. 2005;37:19–24. doi: 10.1038/ng1494. [DOI] [PubMed] [Google Scholar]
- Inoki K, Li Y, Zhu T, Wu J, Guan KL. TSC2 is phosphorylated and inhibited by Akt and suppresses mTOR signalling. Nat Cell Biol. 2002;4:648–657. doi: 10.1038/ncb839. [DOI] [PubMed] [Google Scholar]
- Inoki K, Zhu T, Guan KL. TSC2 mediates cellular energy response to control cell growth and survival. Cell. 2003;115:577590. doi: 10.1016/s0092-8674(03)00929-2. [DOI] [PubMed] [Google Scholar]
- Khamzina L, Veilleux A, Bergeron S, Marette A. Increased activation of the mammalian target of rapamycin pathway in liver and skeletal muscle of obese rats: possible involvement in obesity-linked insulin resistance. Endocrinology. 2005;146:1473–1481. doi: 10.1210/en.2004-0921. [DOI] [PubMed] [Google Scholar]
- Kim DH, Sarbassov DD, Ali SM, King JE, Latek RR, Erdjument-Bromage H, Tempst P, Sabatini DM. mTOR interacts with raptor to form a nutrient-sensitive complex that signals to the cell growth machinery. Cell. 2002;110:163–175. doi: 10.1016/s0092-8674(02)00808-5. [DOI] [PubMed] [Google Scholar]
- Kim DH, Sarbassov DD, Ali SM, Latek RR, Guntur KV, Erdjument-Bromage H, Tempst P, Sabatini DM. GbetaL, a positive regulator of the rapamycin-sensitive pathway required for the nutrient-sensitive interaction between raptor and mTOR. Mol Cell. 2003;11:895–904. doi: 10.1016/s1097-2765(03)00114-x. [DOI] [PubMed] [Google Scholar]
- Kobayashi T, Minowa O, Kuno J, Mitani H, Hino O, Noda T. Renal carcinogenesis, hepatic hemangiomatosis, and embryonic lethality caused by a germ-line Tsc2 mutation in mice. Cancer Res. 1999;59:1206–1211. [PubMed] [Google Scholar]
- Kwiatkowski DJ, Manning BD. Tuberous sclerosis: a GAP at the crossroads of multiple signaling pathways. Hum Mol Genet. 2005:R251–258. doi: 10.1093/hmg/ddi260. [DOI] [PubMed] [Google Scholar]
- Lee AH, Iwakoshi NN, Glimcher LH. XBP-1 regulates a subset of endoplasmic reticulum resident chaperone genes in the unfolded protein response. Mol Cell Biol. 2003;23:7448–7459. doi: 10.1128/MCB.23.21.7448-7459.2003. [DOI] [PMC free article] [PubMed] [Google Scholar]
- Lee L, Sudentas P, Donohue B, Asrican K, Worku A, Walker V, Sun Y, Schmidt K, Albert MS, El-Hashemite N, et al. Efficacy of a rapamycin analog (CCI-779) and IFN-gamma in tuberous sclerosis mouse models. Genes Chromosomes Cancer. 2005;42:213–227. doi: 10.1002/gcc.20118. [DOI] [PubMed] [Google Scholar]
- Loewith R, Jacinto E, Wullschleger S, Lorberg A, Crespo JL, Bonenfant D, Oppliger W, Jenoe P, Hall MN. Two TOR complexes, only one of which is rapamycin sensitive, have distinct roles in cell growth control. Mol Cell. 2002;10:457–468. doi: 10.1016/s1097-2765(02)00636-6. [DOI] [PubMed] [Google Scholar]
- Ma L, Chen Z, Erdjument-Bromage H, Tempst P, Pandolfi PP. Phosphorylation and functional inactivation of TSC2 by Erk implications for tuberous sclerosis and cancer pathogenesis. Cell. 2005;121:179–193. doi: 10.1016/j.cell.2005.02.031. [DOI] [PubMed] [Google Scholar]
- Manning BD, Logsdon MN, Lipovsky AI, Abbott D, Kwiatkowski DJ, Cantley LC. Feedback inhibition of Akt signaling limits the growth of tumors lacking Tsc2. Genes Dev. 2005;19:1773–1778. doi: 10.1101/gad.1314605. [DOI] [PMC free article] [PubMed] [Google Scholar]
- Manning BD, Tee AR, Logsdon MN, Blenis J, Cantley LC. Identification of the tuberous sclerosis complex-2 tumor suppressor gene product tuberin as a target of the phosphoinositide 3-kinase/akt pathway. Mol Cell. 2002;10:151–162. doi: 10.1016/s1097-2765(02)00568-3. [DOI] [PubMed] [Google Scholar]
- Marciniak SJ, Ron D. Endoplasmic reticulum stress signaling in disease. Physiol Rev. 2006;86:1133–1149. doi: 10.1152/physrev.00015.2006. [DOI] [PubMed] [Google Scholar]
- Mori K, Ma W, Gething MJ, Sambrook J. A transmembrane protein with a cdc2+/CDC28-related kinase activity is required for signaling from the ER to the nucleus. Cell. 1993;74:743–756. doi: 10.1016/0092-8674(93)90521-q. [DOI] [PubMed] [Google Scholar]
- Onda H, Lueck A, Marks PW, Warren HB, Kwiatkowski DJ. Tsc2(+/−) mice develop tumors in multiple sites that express gelsolin and are influenced by genetic background. J Clin Invest. 1999;104:687–695. doi: 10.1172/JCI7319. [DOI] [PMC free article] [PubMed] [Google Scholar]
- Ozcan U, Cao Q, Yilmaz E, Lee AH, Iwakoshi NN, Ozdelen E, Tuncman G, Gorgun C, Glimcher LH, Hotamisligil GS. Endoplasmic reticulum stress links obesity, insulin action, and type 2 diabetes. Science. 2004;306:457–461. doi: 10.1126/science.1103160. [DOI] [PubMed] [Google Scholar]
- Ozcan U, Yilmaz E, Ozcan L, Furuhashi M, Vaillancourt E, Smith RO, Gorgun CZ, Hotamisligil GS. Chemical chaperones reduce ER stress and restore glucose homeostasis in a mouse model of type 2 diabetes. Science. 2006;313:1137–1140. doi: 10.1126/science.1128294. [DOI] [PMC free article] [PubMed] [Google Scholar]
- Roux PP, Ballif BA, Anjum R, Gygi SP, Blenis J. Tumor-promoting phorbol esters and activated Ras inactivate the tuberous sclerosis tumor suppressor complex via p90 ribosomal S6 kinase. Proc Natl Acad Sci U S A. 2004;101:13489–13494. doi: 10.1073/pnas.0405659101. [DOI] [PMC free article] [PubMed] [Google Scholar]
- Sarbassov DD, Ali SM, Sabatini DM. Growing roles for the mTOR pathway. Curr Opin Cell Biol. 2005a;17:596–603. doi: 10.1016/j.ceb.2005.09.009. [DOI] [PubMed] [Google Scholar]
- Sarbassov DD, Guertin DA, Ali SM, Sabatini DM. Phosphorylation and regulation of Akt/PKB by the rictor-mTOR complex. Science. 2005b;307:1098–1101. doi: 10.1126/science.1106148. [DOI] [PubMed] [Google Scholar]
- Saucedo LJ, Gao X, Chiarelli DA, Li L, Pan D, Edgar BA. Rheb promotes cell growth as a component of the insulin/TOR signalling network. Nat Cell Biol. 2003;5:566–571. doi: 10.1038/ncb996. [DOI] [PubMed] [Google Scholar]
- Schroder M, Kaufman RJ. The mammalian unfolded protein response. Annu Rev Biochem. 2005;74:739–789. doi: 10.1146/annurev.biochem.73.011303.074134. [DOI] [PubMed] [Google Scholar]
- Shah OJ, Wang Z, Hunter T. Inappropriate activation of the TSC/Rheb/mTOR/S6K cassette induces IRS1/2 depletion, insulin resistance, and cell survival deficiencies. Curr Biol. 2004;14:1650–1656. doi: 10.1016/j.cub.2004.08.026. [DOI] [PubMed] [Google Scholar]
- Tee AR, Manning BD, Roux PP, Cantley LC, Blenis J. Tuberous sclerosis complex gene products, Tuberin and Hamartin, control mTOR signaling by acting as a GTPase-activating protein complex toward Rheb. Curr Biol. 2003;13:1259–1268. doi: 10.1016/s0960-9822(03)00506-2. [DOI] [PubMed] [Google Scholar]
- Tirosh B, Iwakoshi NN, Glimcher LH, Ploegh HL. Rapid turnover of unspliced Xbp-1 as a factor that modulates the unfolded protein response. J Biol Chem. 2006;281:5852–5860. doi: 10.1074/jbc.M509061200. [DOI] [PubMed] [Google Scholar]
- Tuncman G, Hirosumi J, Chang L, Solinas G, Karin M, Hotamisligil GS. Functional in vivo interactions between JNK1 and JNK2 isoforms in obesity and insulin resistance. Proc Natl Acad Sci USA. 2006;103(28):10741–46. doi: 10.1073/pnas.0603509103. [DOI] [PMC free article] [PubMed] [Google Scholar]
- Tzatsos A, Kandror KV. Nutrients suppress phosphatidylinositol 3-kinase/Akt via paptor-dependent mTOR-mediated insulin receptor substrate 1 phosphorylation. Mol Cell Biol. 2006;26:63–76. doi: 10.1128/MCB.26.1.63-76.2006. [DOI] [PMC free article] [PubMed] [Google Scholar]
- Um SH, Frigerio F, Watanabe M, Picard F, Joaquin M, Sticker M, Fumagalli S, Allegrini PR, Kozma SC, Auwerx J, Thomas G. Absence of S6K1 protects against age- and diet-induced obesity while enhancing insulin sensitivity. Nature. 2004;431:200–205. doi: 10.1038/nature02866. [DOI] [PubMed] [Google Scholar]
- Urano F, Wang X, Bertolotti A, Zhang Y, Chung P, Harding HP, Ron D. Coupling of stress in the ER to activation of JNK protein kinases by transmembrane protein kinase IRE1. Science. 2000;287:664–666. doi: 10.1126/science.287.5453.664. [DOI] [PubMed] [Google Scholar]
- Wang Y, Greenwood JS, Calcagnotto ME, Kirsch HE, Barbaro NM, Baraban SC. Neocortical hyperexcitability in a human case of tuberous sclerosis complex and mice lacking neuronal expression of TSC1. Ann Neurol. 2007;61:139–52. doi: 10.1002/ana.21058. [DOI] [PubMed] [Google Scholar]
- Yoshida H, Matsui T, Yamamoto A, Okada T, Mori K. XBP1 mRNA is induced by ATF6 and spliced by IRE1 in response to ER stress to produce a highly active transcription factor. Cell. 2001;107:881–891. doi: 10.1016/s0092-8674(01)00611-0. [DOI] [PubMed] [Google Scholar]
- Zhang Y, Gao X, Saucedo LJ, Ru B, Edgar BA, Pan D. Rheb is a direct target of the tuberous sclerosis tumour suppressor proteins. Nat Cell Biol. 2003;5:578–581. doi: 10.1038/ncb999. [DOI] [PubMed] [Google Scholar]
- Zick Y. Ser/Thr phosphorylation of IRS proteins: a molecular basis for insulin resistance. Sci STKE. 2005:pe4. doi: 10.1126/stke.2682005pe4. [DOI] [PubMed] [Google Scholar]
Associated Data
This section collects any data citations, data availability statements, or supplementary materials included in this article.