

Abstract
Purpose
The goal of this study was to clarify the dynamics of tumor oxygen (partial pressure of oxygen, pO2) in SCC VII murine tumors in mice after X-ray irradiation.
Materials and methods
Changes in pO2 in tumors were measured by 1.2-GHz electron paramagnetic resonance (EPR) spectroscopy after they were exposed to various doses of irradiation. The pO2 in tumors was followed for up to six days after irradiation at doses of 0, 5, 10, 15, and 20 Gy. Paramagnetic crystals were used as an oximetry probe and implanted into normal or tumor tissues in mice for prolonged periods.
Results
The pattern of tumor oxygen after a single dose of radiation with the 5-Gy dose was different from those with other doses (10, 15, and 20 Gy). After 5 Gy, pO2 increased rapidly (P < 0.01, Student’s t test) and then returned to the level observed before irradiation by 12 hours (P < 0.01). In contrast, after 10, 15, or 20 Gy, pO2 increased rapidly by 6 h after irradiation, continued to increase until at least 24 h (P < 0.01), and then gradually decreased.
Conclusion
In tumors that received 5 Gy, post-irradiation increases in pO2 at 4 h after irradiation were detected by EPR oximetry (P < 0.01) noninvasively.
Keywords: EPR, Oximetry, Reoxygenation, Tumor, Radiation
Introduction
Recent developments in radiotherapy techniques have led to the need for more thorough measurements of parameters that may affect the response to radiation. In particular, intensity-modulated radiation therapy (IMRT) can produce dose distributions with high dose gradients between target and non-target areas in tumor and normal tissues and within the tumor itself. This makes it feasible to try to "dose paint" and "dose sculpt" to enhance the effectiveness of therapy [1]. This requires methods to identify parameters that affect radio-sensitivity, as well as methods to image tumors noninvasively [2]. Hypoxia and the metabolic changes induced by hypoxia can confer tumors with resistance to both chemo- and radiotherapy, leading to treatment failure [3, 4]. Clinical studies using oxygen electrodes in carcinomas of uterine cervix have demonstrated a correlation between a low partial pressure of oxygen (pO2) in tumors and a poor response to radiation treatment [5]. Similar relationships have been reported in the head and neck tumors [6–8]. If regions of low pO2 within the tumor can be visualized using new biological imaging techniques, higher doses can be targeted specifically to the hypoxic fraction using IMRT. Targeting hypoxia is also performed by the use of hypoxic sensitizers, hypoxic cytotoxins, hyperbaric oxygen, and so on [9]. However, no non-invasive methods for monitoring pO2 that can be used routinely in the clinic are currently available.
In vivo electron paramagnetic resonance (EPR) oximetry is a promising method for following pO2 in vivo over both space and time [10, 11]. This magnetic resonance technique is based on the effect of oxygen on the EPR spectra of paramagnetic substances. Certain classes of paramagnetic particles, whose spectral line-widths broaden as a function of pO2, are particularly useful for in vivo measurements [11–13]. These are inert and stable in tissues, and are highly sensitive to changes in pO2 within the radiobiologically important range.
While some previous studies have used EPR oximetry to measure the effects of radiation on tumor pO2, there is a need for additional data on other tumors and over a range of doses. This is especially needed because it is now feasible to measure tumor pO2 in patients [14, 15]. In this study we measured the reoxygenation response in SCC VII tumors of mice after X-ray irradiation at various doses. Changes in oxygenation in this tumor have previously been studied by measurements of hypoxic fractions, but not with the direct measurement of tumor pO2. In this study, pO2 was measured in normal tissues of mice for 10 days and in SCC VII tumors of mice for 8 days with a 1.2-GHz EPR spectrometer using a surface-coil resonator and lithium 5, 9, 14, 18, 23, 27, 32, 36-octa-n-butoxy-2,3-naphthalocyanine (LiNc-BuO) crystals as an oxygen-sensitive probe [13]. We will report results of EPR oximetry with LiNc-BuO probes to monitor oxygenation in tumors after irradiation with a tumor model in mice.
Materials and methods
Synthesis of lithium 5, 9, 14, 18, 23, 27, 32, 36-octa-n-butoxy-2,3-naphthalocyanine (LiNc-BuO) radicals
LiNc-BuO was prepared according to the previously reported method [13] with slight modifications. The obtained greenish crystals of LiNc-BuO were washed with methanol and dried under vacuum. The yield of the product was 35 %. Chemical precursors and raw materials such as lithium granules, 5,9,14,18,23,27,32,36-octa-n-butoxy-2,3-naphthlocyanine, n-pentanol, n-hexane and tert-butylmethylether were purchased from Kanto Chemical Co. This compound is not approved for clinical use.
Animal studies
The protocol for all animal experiments was approved by the Sapporo Medical University Animal Care Committee according to the National Institutes of Health Animal Care and Use Protocol (USA). Male C3H mice (6 weeks old; SLC, Shizuoka, Japan) were maintained on laboratory chow and water ad libitum on a 12-h light/dark cycle.
SCC VII tumor cells
SCC VII squamous cell carcinomas derived from C3H mice were maintained in vitro in Eagle’s minimum essential medium containing 10 % fetal bovine serum. Cells were collected from monolayer cultures. Approximately 1.0×10⁵ cells were inoculated subcutaneously into the hind legs [16]. Tumor volume was calculated as tumor volume = π/6·a·b·c, where a, b, and c were the orthogonal dimensions of tumors. This cell line was kindly provided by the Department of Radiology, Stanford University School of Medicine, California, USA. It was originally established at Massachusetts General Hospital, Massachusetts, USA.
Implantation of LiNc-BuO into tumors in mice
Mice were anesthetized by intraperitoneal (i.p.) injection of ketamine/xylazine (ketamine:120 mg/kg, xylazine: 20 mg/kg). Five mg of LiNc-BuO fine crystals (< 150 µM) were suspended in phosphate-buffered saline (PBS). An aliquot (about 10 µg) of LiNc-BuO suspension was implanted in the tumor or normal muscle tissues of hind legs of mice, using a 24-gauge needle loaded with the above crystal suspension in the tip. LiNc-BuO crystals were implanted at the center of the tumor at a depth of 5 mm. All of the in vivo EPR spectra of LiNc-BuO in mice were measured at least 1 d after implantation.
Irradiation
SCC VII tumor-bearing mice were anesthetized with ketamine/xylazine prior to irradiation, and mice were irradiated with graded doses of X-rays. The dose rate was 1.12 Gy/min at 150 kVp, 20mA, using an X-ray machine with a 0.5mm Al filter. The tumors were irradiated selectively by shielding the whole body except for the tumor with 3 mm-thick sheets of lead. Small-diameter tumors (diameter 5–6 mm) were used throughout this study to minimize the heterogeneity of pO2. Twenty-four hours after the implantation of LiNc-BuO in the tumors, an initial pO2 value was obtained for each tumor. After these measurements, tumor tissue areas were irradiated with 0, 5, 10, 15, or 20 Gy.
In vivo EPR measurements in mice
A home-built continuous-wave L-band EPR spectrometer was used to measure pO2 in tumor tissues. The EPR spectrometer consists of a permanent magnet (Model X-5000, NEOMAX, Osaka, Japan), a surface-coil resonator [17], and a home-built microwave bridge (microwave frequency 1.2 GHz). The spectrometer has automatic tuning and matching controls with a surface-coil resonator. These functions can suppress noise due to motion of the animal. Noise in the measured spectra was further suppressed with a Butterworth filter in a LabVIEW-based data-acquisition program. The line-widths of the obtained EPR spectra were then automatically detected in the program. Line-widths were converted into pO2 values according to the calibration curve of LiNc-BuO probes obtained in advance (Fig. 1). To determine pO2 in tumor tissues, anesthetized mice were placed in the magnet. The surface-coil resonator with a loop of 10 mm in diameter was adjusted to the position of the tumor. The animals were maintained at 35–38°C during the experiments by blowing warm air over them, as shown in the previous report [18].
Fig. 1.
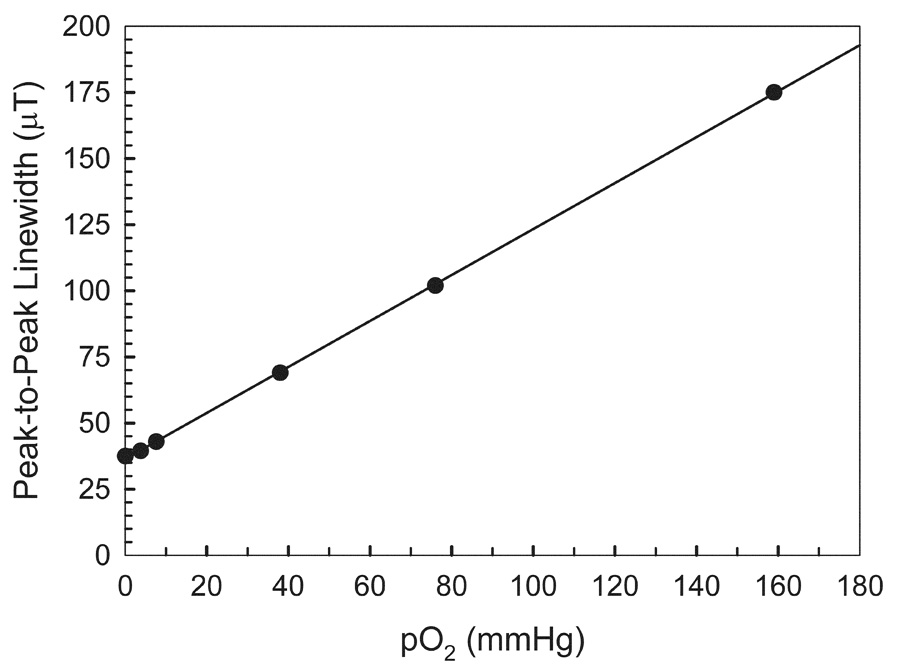
Calibration curve of the L-band EPR line-width of LiNc-BuO versus pO2. LiNc-BuO crystals were suspended in PBS equilibrated with mixtures of oxygen/nitrogen gases of 21, 10, 5, 1, 0.5, and 0 % (in argon) oxygen. The spectra were measured under the following conditions: frequency, 1.2 GHz; incident microwave power, 1 mW; modulation frequency, 90 KHz; modulation amplitude, 0.02 mT; temperature, 35–38°C.
EPR oximetry
Single-scan EPR spectra were obtained from LiNc-BuO-doped SCC VII tumors in mice with the following parameters: scan time 50 s, field scanning 1mT, field modulation 0.025mT, time constant 30 ms, and applied microwave power 5 mW. The applied microwave power was below the saturation of EPR signals. Since the field modulation magnitude was lower than the line-width, no line broadening due to over-modulation was observed in the measurements. pO2 was measured by EPR oximetry 1 h before irradiation (basal value) and at 1, 4 (or 6), 12, 24, 48, 72, and 120 h (or 144) after irradiation. The pO2 measurements were time-dependently carried out after irradiation at the same site as the tumors. Since LiNc-BuO is a colored (dark-greenish) insoluble material, it is easily recognized at the same site as where the probe was located in the tumors.
Statistical Analysis
All values are expressed as means ± the standard error of the means (SEM) of 4–6 independent experiments. Differences between groups were evaluated by Student’s t test (two-sided) or ANOVA for experiments with more than two groups. Differences between groups were considered to be significant at P < 0.05.
Results
Effect of oxygen concentration (pO2) on EPR line-width of LiNc-BuO
The L-band EPR spectrum of LiNc-BuO broadened and its amplitude decreased with an increase in the oxygen concentration. The relationship between the peak-to-peak EPR line-width of LiNc-BuO crystals measured at L-band and the oxygen partial pressure (pO2) is shown in Fig. 1. The line-width versus pO2 curve was quite linear for all preparations of LiNc-BuO crystals used in this study. The slope was 0.86 µT/mmHg. The line-width obtained at 0 % oxygen (in argon) was 0.032 mT.
In vivo stability of LiNc-BuO in tissues
In preliminary experiments we confirmed that the EPR line-width of LiNc-BuO did not change when exposed to reactive oxygen species (superoxide, hydroxyl radicals, and nitric oxide) or ascorbate (5 mM) for 30 min. We also observed that the pH of the medium (within a range of 3–9) and 30 Gy of irradiation had no effect on the EPR spectrum of LiNc-BuO. Since LiNc-BuO prepared in our laboratory has been shown to be quite stable in vitro, 10 µg of LiNc-BuO fine crystalline powder suspended in PBS was implanted into the muscle tissue of mice to evaluate the long-term stability of LiNc-BuO in vivo. The EPR spectrum of LiNc-BuO implanted into the leg muscles of C3H mice was recorded periodically for up to 30 d after the implantation of LiNc-BuO. In vivo EPR spectra of LiNc-BuO in the leg muscle tissues 3 d and 30 d after implantation are shown in Fig. 2. Thirty days after implantation, the signal-to-noise ratio of the obtained EPR spectrum decreased compared to that measured 3 d after implantation, but the line-width of implanted LiNc-BuO was the same and LiNc-BuO in the leg could still respond quickly to the changes in the tissue oxygen concentration. A typical in vivo EPR spectrum of LiNc-BuO in leg muscle and the changes in pO2 evaluated from L-band EPR spectra on different days up to 10 d after implantation of LiNc-BuO are shown in Fig. 3. The response of LiNc-BuO to pO2 was verified by the observation that the EPR spectral line-width was sharpened by the reduction in tissue oxygenation during the interruption of blood flow to the leg (data not shown). While the pO2 values were not stable immediately after the implantation of LiNc-BuO in the leg muscle tissues of mice, 1 day after implantation the pO2 values remained stable for an experimental period of 10 d. All the pO2 values 24 h after implantation did not differ significantly (P > 0.6, paired Student’s t test). The difference of pO2 value between the 0 day and the 1–10th except the 1st, 4th, and 6th day values was significant (P < 0.05).
Fig. 2.
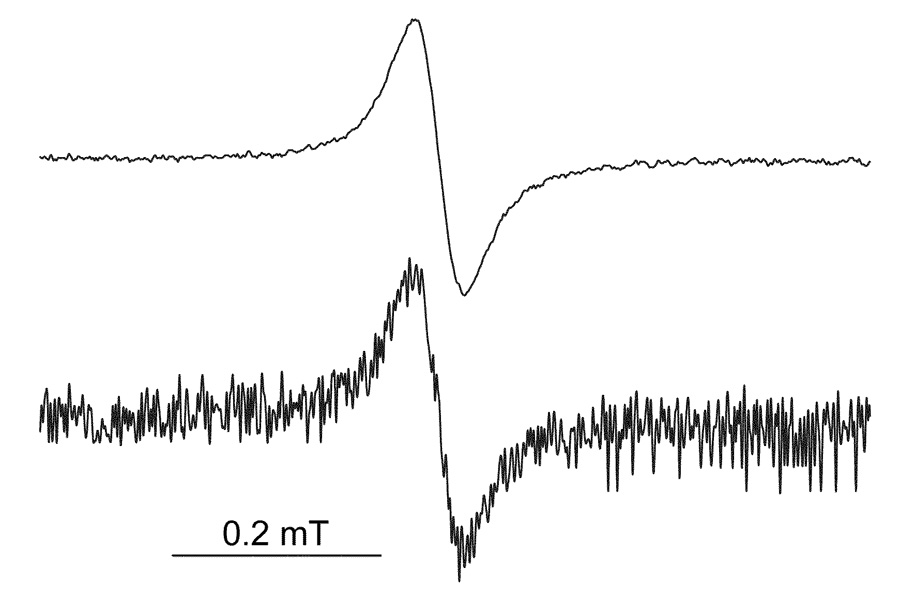
In vivo L-band EPR spectra of LiNc-BuO implanted in the muscle tissues of mice. Fine LiNc-BuO crystals (about 10 µg) were implanted into normal muscle tissues on the hind leg of a C3H mouse. The EPR spectra shown were from a mouse on day 3 (upper) and 30 d (bottom) after implantation of the crystals. The experimental conditions were as follows: frequency, 1.2 GHz; incident microwave power, 5 mW; modulation frequency, 90 kHz; modulation amplitude, 0.03 mT; temperature, 35–38°C.
Fig. 3.
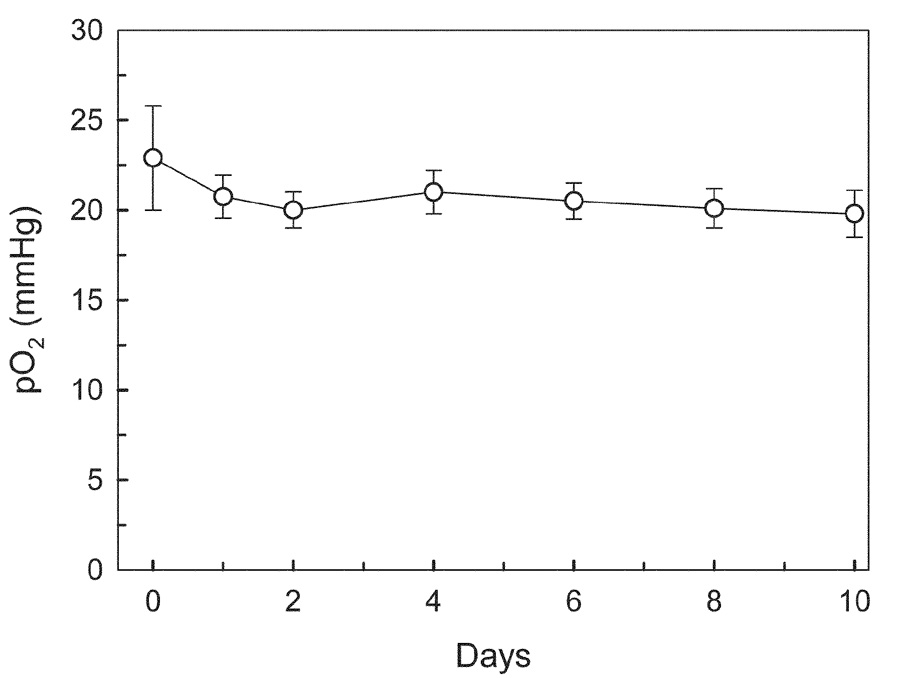
Monitoring pO2 in the muscle tissues through the change in the line-width of implanted LiNc-BuO. Mean values of pO2 recorded repetitively from 4 mice were shown. Error bars show the standard errors of the means (SEM).
Measurement of tumor pO2 as a function of tumor growth
A suspension of LiNc-BuO crystals in PBS was implanted into the tumor in the right leg of the mouse. A similar implantation of LiNc-BuO was performed as a control in normal muscle on the left leg of the same tumor-bearing mouse. pO2 measurements were performed daily after the injection of LiNc-BuO, as described in Fig. 3. Comparison studies of pO2 measurements using four tumors (n=4) with different average volumes of 0.10 ± 0.003 cm3 and 0.81 ± 0.1 cm3 were carried out by EPR oximetry. The pO2 values in tumors measured 24 h after LiNc-BuO implantation were 14.8 ± 2.7 and 7.2 ± 5.5mmHg, respectively. The larger variation in the larger tumor might be due to tumor heterogeneity. Thus, in this study, pO2 observation was started using small tumors. The changes in pO2 values in tumors of 6 tumor-bearing mice are shown in Fig. 4. While pO2 in the muscle tissue of control mice remained constant during the study period, as shown in Fig. 3, pO2 in tumors showed a continuous decrease with time as the size increased (Fig. 4). Significant increase in tumor volume (P<0.01) was observed during 2d–8d compared with the value before radiation. Also, significant decrease in pO2 (P < 0.01) was observed during 5d–8d compared with the value before radiation.
Fig. 4.
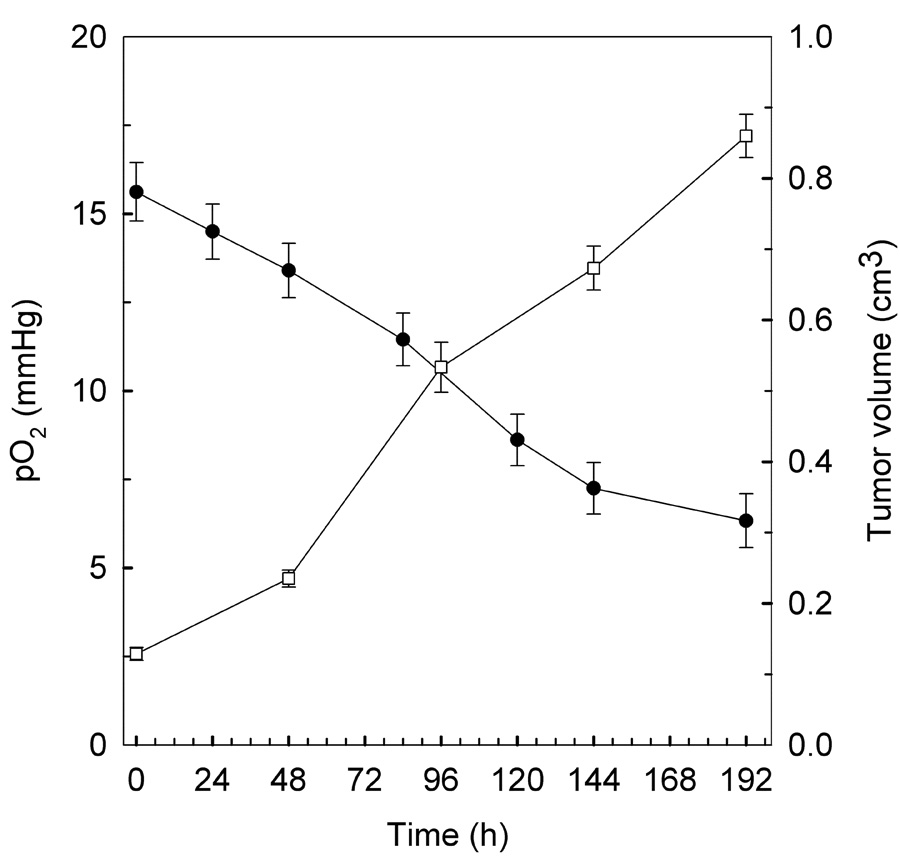
In vivo measurement of pO2 (●) from tumor tissues of mice with SCC VII tumors as a function of tumor growth (□). LiNc-BuO crystals (about 10 µg) were implanted in SCC VII tumors in mice, and the pO2 values in tumors were measured in the same animal up to 8 d after implantation of the crystal. Mean values of pO2 and tumor volume obtained from 6 mice are shown. Error bars show SEM.
Effect of X-ray radiation on pO2 in tumors
pO2 in tumors was measured periodically, generally at 4-h or 6-h intervals for the first 24h, then up to six days after irradiation. The results are shown in Fig. 5. For all of the doses examined in this study, pO2 values increased within 24 h after irradiation, peaked, and then gradually decreased to or below the level before irradiation. The increase in pO2 values in tumors after radiation was strongly dependent on the radiation dose. In particular, an increase in pO2 after a single dose of 5 Gy was observed at 4 hours (Fig. 5a, P <0.01, Student’s t test), although this has not been described in the previous report which used a hypoxic fraction to determine changes in oxygen [16]. This is because EPR oximetry can follow changes in pO2 continuously, making it feasible to follow rapid changes in pO2 over various lengths of time. After single-dose radiation treatment, a characteristic pattern of change in tumor pO2 was observed, which depended on the radiation dose used in the experiment. In the case of 5 Gy radiation, after the maximum pO2 was observed at 4 h after radiation, pO2 decreased within 12 h and the pO2 value at 5 d after radiation was significantly lower than that before radiation (P < 0.01, Student’s t test). In the case of 10 Gy radiation, the highest pO2 values were observed at 24 h after radiation (P < 0.01, Student’s t test), and these then gradually returned to the levels observed before radiation. The pO2 value at about 6 d was significantly lower than that before radiation (P < 0.01, Student’s t test). On the other hand, with 15 or 20 Gy, while the maximum pO2 values were also observed at about 24 hours after radiation (P < 0.01, Student’s t test), they returned to pretreatment levels more slowly. With these radiation doses, the pO2 values at 5 or 6 d after radiation became lower than the maximum pO2 values (P < 0.01, Student’s t test) but were not significantly different from the values before radiation (P > 0.05, Student’s t test).
Fig. 5.
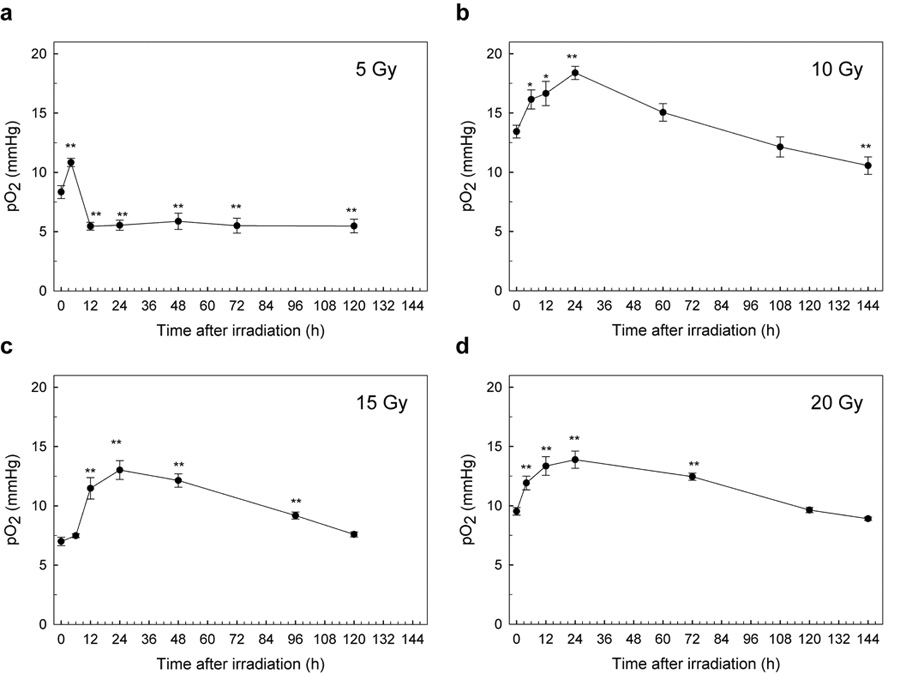
The average changes of pO2 in SCC VII tumors in mice after a single radiation. Changes in pO2 in individual SCC VII tumors in 6 mice were measured over 6 days after a single dose of radiation, (a) 5 Gy, (b) 10 Gy, (c) 15 Gy, and (d) 20 Gy. Experimental conditions were the same as in Fig. 3, except for the radiation treatment. Each point indicates the mean, and error bars indicate SEM. *, P < 0.05; **, P < 0.01.
The changes in tumor volume after radiation are summarized in Table 1. Before radiation, the tumors used in this experiment had volumes within the range 0.1 to 0.2 cm3. Radiation treatment with 5 Gy and 10 Gy did not suppress tumor growth significantly. However, after radiation with doses of 15, or 20 Gy, the tumors shrank appreciably.
Table 1.
Changes in relative tumor volume 5 days after a single dose of radiation. In all conditions, 6 mice were examined. An irradiation dose of 0 Gy indicates the control. Tumor volume data are shown as the mean, and bars show SEM. Differences between two groups were evaluated with Student’s t test.
| Irradiation dose (Gy) | Tumor volume (cm3) |
|---|---|
| 0 | 0.61 ± 0.18 |
| 5 | 0.57 ± 0.21 |
| 10 | 0.48 ± 0.17 |
| 15 | 0.32 ± 0.12* |
| 20 | 0.25 ± 0.09** |
P, < 0.05
P < 0.01.
Discussion
The oxygen status of the SCC VII murine tumor has been investigated indirectly with the paired survival curve method [16, 19] and comet assay [20]. These methods are invasive, whereas in vivo EPR oximetry can evaluate the status of tumor hypoxia by detecting pO2 values in tumors noninvasively, thus the real time monitoring of the oxygen status in tumors is possible by EPR oximetry method.
In our present results, tumor pO2 after a single dose of radiation at 5 Gy showed a different pattern than after other doses (10, 15, and 20 Gy), as shown in Fig. 5. After 5 Gy of irradiation, pO2 increased rapidly at 4 h after irradiation and returned to the level before irradiation, or lower. In contrast, after 10, 15, or 20 Gy of irradiation, pO2 began to increase rapidly 6 h after irradiation and continued to increase until 24 h. The value of pO2 then gradually decreased. As a tumor shrinks, surviving cells that were previously beyond the range of oxygen diffusion are closer to the blood supply and are reoxygenated. This process may be one of the mechanisms of the reoxygenation that occurred slowly during the following 12–72 h (Figs. 5b–5d), since SCC VII tumor shrank considerably after 10, 15, or 20 Gy of irradiation (Table 1). This slow component of reoxygenation, which takes place over a period of days as the tumor shrinks, involves the reoxygenation of cells that were chronically hypoxic [2]. The SCC VII tumor did not shrink with 5-Gy irradiation, indicating that the tumor treated with 5Gy has no or little influence of tumor shrink on reoxygenation. A key finding in our results is that reoxygenation in SCC VII tumors was observed with a single dose of 5 Gy, as shown in Fig. 5a. The rapid rise in pO2 at around 4 h after radiation could be observed since EPR oximetry is noninvasive and real time pO2 monitoring technique.
Olive extensively investigated the mechanism of rapid reoxygenation after 10 Gy of irradiation in SCC VII tumors [20]. She used the comet assay to measure the hypoxic fraction, oxygen diffusion distance, tumor cubes incubated with a fluorescent hypoxia probe to measure oxygen diffusion, and the dual fluorescent dye method to detect regions undergoing transient fluctuations in tumor perfusion. Her results indicated that the rapid reoxygenation of SCC VII tumor following exposure to 10 Gy can be attributed to a decrease in oxygen consumption and an increase in tumor perfusion, but not to cell loss or redistribution. Secomb et al. also showed that consumption could be very important for changes in tumor oxygenation status [21].
Both in vivo [22, 23] and clinical studies [24] have assessed the changes in hypoxia after irradiation. Ljungkvist et al. reported temporal and spatial changes in hypoxia using the hypoxia marker pimonidazole after irradiation (20 Gy) in a murine adenocarcinoma tumor cell line (C38). Their data indicated that the increase in tumor oxygenation after irradiation was caused by reduced oxygen consumption [23]. Fenton et al. reported the effects of a single dose of 10 Gy of radiation on the hypoxic fraction with immunohistochemical staining and perfusion markers. Their results indicated that at 24 h postirradiation, oxygen availability increased, and tumor hypoxia developed at an increased distance from perfused blood vessels after irradiation, which suggests a decrease in oxygen consumption at 24 h. By 72 h postirradiation, all physiological parameters had returned to the levels in volume-matched, nonirradiated controls [22]. Nordsmark et al. reported pre-treatment Eppendorf pO2 measurements in 397 patients with advanced head and neck cancer and used the fraction of pO2 values < or = 2.5 mmHg (HP2.5), < or = 5 mmHg and median tumor pO2 as descriptors. HP2.5 above the population median was the only parameter that was associated with poor overall survival [24].
In the present study, we clarified the X-ray radiation dose-dependent pattern of reoxygenation in SCC VII tumors by monitoring pO2 directly with EPR oximetry. Other investigators reported that an increase in oxygen partial pressure was observed 3–4 h or 6 h after irradiation by using other murine tumors with EPR oximetry [25, 26]. The timing of reoxygenation in RIF-1 murine tumors was determined using EPR oximetry [27]. Radiation was given as a single 20-Gy dose or was split into two 10-Gy doses where the second dose of radiation was delivered either at the minimum postirradiation tumor pO2 (24-h interval, hypoxic group) or after reoxygenation had occurred (72-h interval, oxygenated group). The oxygenated group showed significantly longer tumor-doubling times than the hypoxic group, indicating that the measured changes in pO2 reflected changes in tumor radiosensitivity. EPR oximetry may have clinical value since this method can be used to select an individualized optimal fractionation by monitoring the change in pO2 after each fraction of radiotherapy. The extent and rapidity of reoxygenation are extremely variable among different tumors, and are impossible to predict [2]. However, the process of reoxygenation has important implications in practical radiotherapy [28]. Thus it is important to know the time course of reoxygenation in a tumor to be irradiated to determine the optimal time to deliver subsequent doses.
We used LiNc-BuO that is insoluble as an oximetric probe. The use of insoluble oximetric probes has both advantages and disadvantages. For example, while they can measure pO2 values only at the site at which they are implanted, they can be used repeatedly. Some of their disadvantage can be overcome by using multi-site pO2 measurements by EPR oximetry in which oxygen-sensitive probes are implanted at several different points of interest [29]. We examined the stability of LiNc-BuO in muscle (Fig. 2). At 30 days after implantation, the response of the line-width due to the changes in pO2 was still fast and stable, and gave a reasonable pO2 value. While the signal-to-noise ratio of this probe decreased, the signal intensity of its EPR spectrum was still more than 75% of the original intensity. This long-term stability of oximetry probes in tissues is an important consideration for applications in vivo. A key to practical EPR oximetry is the development of oxygen-sensitive probes that are suitable for specific applications, such as measurements of tumor oxygenation before or after radiotherapy.
In summary, by using EPR oximetry with LiNc-BuO we were able to follow the changes in tumor oxygen induced by radiation with repeated measurements at short intervals and extending into many days. This enabled us to observe a previously unobserved short-term post-radiation increase in oxygen in SCC VII tumors after a single dose of 5 Gy. This type of change, at a dose that may be comparable to those used in fractionated radiation schemes for treating human tumors, could be exploited to optimize fractionated radiation to enhance the therapeutic effect.
Acknowledgements
This work was supported by the Industrial Technology Research Grant Program in 2004 from the New Energy and Industrial Technology Development Organization (NEDO) of Japan (04A06006 to H.H.). Dr. Swartz’s contribution was supported by NIH grant P01EB002180.
Footnotes
Conflict of Interest Statement The authors do not have any financial or personal relationship with other people or organizations that inappropriately influence their work.
Publisher's Disclaimer: This is a PDF file of an unedited manuscript that has been accepted for publication. As a service to our customers we are providing this early version of the manuscript. The manuscript will undergo copyediting, typesetting, and review of the resulting proof before it is published in its final citable form. Please note that during the production process errors may be discovered which could affect the content, and all legal disclaimers that apply to the journal pertain.
References
- 1.Ling CC, Humm J, Larson S, et al. Towards multidimensional radiotherapy (MD-CRT): biological imaging and biological conformality. Int J Radiat Oncol Biol Phys. 2000;47:551–560. doi: 10.1016/s0360-3016(00)00467-3. [DOI] [PubMed] [Google Scholar]
- 2.Hall EJ. Oxygen effect and reoxygenation. In: Hall EJ, editor. Radiobiology for the radiologist. Sixth edition. Philadelphia: Lippincott Williams & Wilkins; 2006. pp. 85–105. [Google Scholar]
- 3.Brizel DM, Sibley GS, Prosnitz LR, et al. Tumor hypoxia adversely affects the prognosis of carcinoma of the head and neck. Int J Radiat Oncol Biol Phys. 1997;38:285–289. doi: 10.1016/s0360-3016(97)00101-6. [DOI] [PubMed] [Google Scholar]
- 4.Teicher BA. Hypoxia and drug resistance. Cancer Metast Rev. 1994;13:139–168. doi: 10.1007/BF00689633. [DOI] [PubMed] [Google Scholar]
- 5.Hockel M, Schlenger K, Aral B, et al. Association between tumor hypoxia and malignant progression in advanced cancer of the uterine cervix. Cancer Res. 1996;56:4509–4515. [PubMed] [Google Scholar]
- 6.Nordsmark M, Bentzen SM, Rudat V, et al. Prognostic value of tumor oxygenation in 397 head and neck tumors after primary radiation therapy. An international multi-center study. Radiother Oncol. 2005;77:18–24. doi: 10.1016/j.radonc.2005.06.038. [DOI] [PubMed] [Google Scholar]
- 7.Nordsmark M, Overgaard J. A confirmatory prognostic study on oxygenation status and loco-regional control in advanced head and neck squamous cell carcinoma treated by radiation therapy. Radiother Oncol. 2000;57:39–43. doi: 10.1016/s0167-8140(00)00223-1. [DOI] [PubMed] [Google Scholar]
- 8.Nordsmark M, Overgaard M, Overgaard J. Pretreatment oxygenation predicts radiation response in advanced squamous cell carcinoma of the head and neck. Radiother Oncol. 1996;41:31–39. doi: 10.1016/s0167-8140(96)91811-3. [DOI] [PubMed] [Google Scholar]
- 9.Overgaard J. Sensitization of hypoxic tumour cells-clinical experience. Int J Radiat Biol. 1989;56:801–811. doi: 10.1080/09553008914552081. [DOI] [PubMed] [Google Scholar]
- 10.Gallez B, Baudelet C, Jordan BF. Assessment of tumor oxygenation by electron paramagnetic resonance: principles and applications. NMR Biomed. 2004;17:240–262. doi: 10.1002/nbm.900. [DOI] [PubMed] [Google Scholar]
- 11.Swartz HM, Boyer S, Brown D, et al. The use of EPR for the measurement of the concentration of oxygen in vivo in tissues under physiologically pertinent conditions and concentrations. Adv Exp Med Biol. 1992;317:221–228. doi: 10.1007/978-1-4615-3428-0_23. [DOI] [PubMed] [Google Scholar]
- 12.Liu KJ, Gast P, Moussavi M, et al. Lithium phthalocyanine: a probe for electron paramagnetic resonance oximetry in viable biological systems. Proc Natl Acad Sci USA. 1993;90:5438–5442. doi: 10.1073/pnas.90.12.5438. [DOI] [PMC free article] [PubMed] [Google Scholar]
- 13.Pandian RP, Parinandi NL, Ilangovan G, et al. Novel particulate spin probe for targeted determination of oxygen in cells and tissues. Free Radic Biol Med. 2003;35:1138–1148. doi: 10.1016/s0891-5849(03)00496-9. [DOI] [PubMed] [Google Scholar]
- 14.Khan N, Williams BB, Swartz HM. Clinical applicaions of in vivo EPR: rationale and initial results. Appl Magn Reson. 2006;30:185–199. [Google Scholar]
- 15.Swartz HM, Khan N, Buckey J, et al. Clinical applications of EPR: overview and perspectives. NMR Biomed. 2004;17:335–351. doi: 10.1002/nbm.911. [DOI] [PubMed] [Google Scholar]
- 16.Kitakabu Y, Shibamoto Y, Sasai K, et al. Variations of the hypoxic fraction in the SCC VII tumors after single dose and during fractionated radiation therapy: assessment without anesthesia or physical restraint of mice. Int J Radiat Oncol Biol Phys. 1991;20:709–714. doi: 10.1016/0360-3016(91)90013-t. [DOI] [PubMed] [Google Scholar]
- 17.Hirata H, Walczak T, Swartz HM. Electronically tunable surface-coil-type resonator for L-band EPR spectroscopy. J Magn Reson. 2000;142:159–167. doi: 10.1006/jmre.1999.1927. [DOI] [PubMed] [Google Scholar]
- 18.Fujii H, Koscielniak J, Berliner LJ. Determination and characterization of nitric oxide generation in mice by in vivo L-Band EPR spectroscopy. Magn Reson Med. 1997;38:565–568. doi: 10.1002/mrm.1910380410. [DOI] [PubMed] [Google Scholar]
- 19.Kim IH, Brown JM. Reoxygenation and rehypoxiation in the SCCVII mouse tumor. Int J Radiat Oncol Biol Phys. 1994;29:493–497. doi: 10.1016/0360-3016(94)90444-8. [DOI] [PubMed] [Google Scholar]
- 20.Olive PL. Radiation-induced reoxygenation in the SCCVII murine tumour: evidence for a decrease in oxygen consumption and an increase in tumour perfusion. Radiother Oncol. 1994;32:37–46. doi: 10.1016/0167-8140(94)90447-2. [DOI] [PubMed] [Google Scholar]
- 21.Secomb TW, Hsu R, Dewhirst MW. Synergistic effects of hyperoxic gas breathing and reduced oxygen consumption on tumor oxygenation: a theoretical model. Int J Radiat Oncol Biol Phys. 2004;59:572–578. doi: 10.1016/j.ijrobp.2004.01.039. [DOI] [PubMed] [Google Scholar]
- 22.Fenton BM, Lord EM, Paoni SF. Effects of radiation on tumor intravascular oxygenation, vascular configuration, development of hypoxia, and clonogenic survival. Radiat Res. 2001;155:360–368. doi: 10.1667/0033-7587(2001)155[0360:eoroti]2.0.co;2. [DOI] [PubMed] [Google Scholar]
- 23.Ljungkvist AS, Bussink J, Kaanders JH, et al. Dynamics of hypoxia, proliferation and apoptosis after irradiation in a murine tumor model. Radiat Res. 2006;165:326–336. doi: 10.1667/rr3515.1. [DOI] [PubMed] [Google Scholar]
- 24.Nordsmark M, Overgaard J. Tumor hypoxia is independent of hemoglobin and prognostic for loco-regional tumor control after primary radiotherapy in advanced head and neck cancer. Acta Oncol. 2004;43:396–403. doi: 10.1080/02841860410026189. [DOI] [PubMed] [Google Scholar]
- 25.Bratasz A, Pandian PP, Deng Y, et al. In vivo imaging of changes in tumor oxygenation during growth and after tretament. Magn Reson Med. 2007;57:950–959. doi: 10.1002/mrm.21212. [DOI] [PMC free article] [PubMed] [Google Scholar]
- 26.Crokart N, Jordan BF, Baudelet C, et al. Early reoxygenation in tumors after irradiation: determining factors and consequences for radiotherapy regimens using daily multiple fractions. Int J Radiat Oncol Biol Phys. 2005;63:901–910. doi: 10.1016/j.ijrobp.2005.02.038. [DOI] [PubMed] [Google Scholar]
- 27.O'Hara JA, Goda F, Demidenko E, et al. Effect on regrowth delay in a murine tumor of scheduling split-dose irradiation based on direct pO2 measurements by electron paramagnetic resonance oximetry. Radiat Res. 1998;150:549–556. [PubMed] [Google Scholar]
- 28.Evans SM, Koch CJ. Prognostic significance of tumor oxygenation in humans. Cancer Lett. 2003;195:1–16. doi: 10.1016/s0304-3835(03)00012-0. [DOI] [PubMed] [Google Scholar]
- 29.Grinberg OY, Smirnov AI, Swartz HM. High spatial resolution multi-site EPR oximetry. The use of convolution-based fitting method. J Magn Reson. 2001;152:247–258. doi: 10.1006/jmre.2001.2408. [DOI] [PubMed] [Google Scholar]