

Abstract
Echinacea preparations are commonly used as nonspecific immunomodulatory agents. Alcohol extracts from three widely used Echinacea species, Echinacea angustifolia, Echinacea pallida, and Echinacea purpurea, were investigated for immunomodulating properties. The three Echinacea species demonstrated a broad difference in concentrations of individual lipophilic amides and hydrophilic caffeic acid derivatives. Mice were gavaged once a day (for 7 days) with one of the Echinacea extracts (130 mg/kg) or vehicle and immunized with sheep red blood cells (sRBC) 4 days prior to collection of immune cells for multiple immunological assays. The three herb extracts induced similar, but differential, changes in the percentage of immune cell populations and their biological functions, including increased percentages of CD49+ and CD19+ lymphocytes in spleen and natural killer cell cytotoxicity. Antibody response to sRBC was significantly increased equally by extracts of all three Echinacea species. Concanavalin A-stimulated splenocytes from E. angustifolia- and E. pallida-treated mice demonstrated significantly higher T cell proliferation. In addition, the Echinacea treatment significantly altered the cytokine production by mitogen-stimulated splenic cells. The three herbal extracts significantly increased interferon-γ production, but inhibited the release of tumor necrosis factor-α and interleukin (IL)-1β. Only E. angustifolia- and E. pallida-treated mice demonstrated significantly higher production of IL-4 and increased IL-10 production. Taken together, these findings demonstrated that Echinacea is a wide-spectrum immunomodulator that modulates both innate and adaptive immune responses. In particular, E. angustifolia or E. pallida may have more anti-inflammatory potential.
Keywords: adaptive immunity, BALB/c mice, Echinacea, immunomodulation, innate immunity
INTRODUCTION
Echinacea is a herbaceous plant genus, consisting of nine species. Three species, Echinacea angustifolia, Echinacea pallida, and Echinacea purpurea, have been used medicinally in the United States and Europe and are being introduced into other regions because of the increasing popularity in alternative herbal remedies. Echinacea has a wide range of pharmacological activities. Besides its common function as a supportive therapy in the treatment of the common cold and upper respiratory tract infections, in which it reduces the duration and/or the severity of the symptoms,1,2 it has been shown to possess palliative effects on wound damage,3 inflammation,3,4 and tumor growth.5
As a widely used over-the-counter and self-prescribed herbal medicine, it is important to elucidate its mode of action in order to enhance clinical benefits and minimize toxicity. The most consistent result identified by the majority of studies so far indicates that Echinacea has nonspecific immunomodulatory properties through the activation of innate immune cells.6,7 For example, in animals Echinacea showed profound effects on immune cell number,8 granulocyte migration,9,10 macrophage phagocytosis, 10,11 natural killer (NK) cell cytotoxicity,12,13 and cytokine production.8,11 In addition, an arabinogalactan-protien isolated from E. purpurea stimulates both the classical and alternative pathways of complement activation.14
While the bulk of studies have emphasized the innate immune properties of Echinacea, few studies have investigated its adaptive immune modulation. One study demonstrated an increase in immunoglobulin (Ig) M response against sheep red blood cells (sRBC) in the mice treated with a glycerine extract of E. purpurea.15 Other studies demonstrated an increase of humoral immunity in vivo but only provided indirect information because of the use of a blend of Echinacea and other herbs.16,17 Data regarding the effect of Echinacea on T cells are more limited. A previous study with E. purpurea found an increase in CD4+ T-lymphocytes in mouse peripheral blood but implied it is a secondary effect in association with macrophage activation.18 Morazzoni et al.19 recently reported that E. angustifolia extract enhances T-cell function in vitro by stimulating interferon (IFN)-γ production in anti-CD3-treated murine T-cell cultures. These experimental results suggest that Echinacea may modulate adaptive immune responses.
However, the evidence for Echinacea effects is confusing and inconsistent since most studies have used different Echinacea preparations, and these preparations are largely influenced by many factors, such as phytochemical variability due to growing conditions and lack of extraction standardization.2,7 Moreover, bacteria-derived endotoxin contamination during the extraction processes may give rise to false-positive results by way of the stimulation of the immune system, especially with in vitro cell culture experiments or injection of the extracts into animals. Many previous reports have neglected this confounding factor of endotoxin, although some touched upon it.19–22
Isolation and characterization of bioactive phytochemicals in Echinacea extracts used in studies are essential. A few widely accepted active compounds of Echinacea include lipophilic alkamides and polar caffeic acid derivatives (cichoric acid and echinacoside).23,24 The in-depth investigation of these active compounds seems to be helpful for the better understanding of the biological nature of Echinacea. However, a purified phytochemical does not mimic the immunological effects of whole plant extracts. It appears that the immunopharmacological activities of Echinacea depend on a combination of several active compounds,25 but not any single individual constituent. In addition, extracts of Echinacea are commercially available and economical, but commercially available purified compounds are expensive and not approved for human consumption. Thus, studies using Echinacea extracts are still of great value. Animal experiments have shown that a combination of Echinacea extracts demonstrated greater effects than extracts of single plants (reviewed by Bodinet et al.17), but using a mixture of plants makes it difficult to distinguish the biological significance of each plant or identify redundancy in effects.
Our preliminary studies using oral administration of Echinacea found that the dry powder or alcohol extract of E. purpurea root could stimulate splenic T-cell proliferation and NK cell cytotoxicity. Based on the experimental data available to date on Echinacea, the purpose of the present study was (1) to provide a comparison of the immunomodulatory activity of three species of Echinacea, (2) to clarify Echinacea’s activities on specific acquired immunity, and (3) identify differences in immune activation based on differences in high performance liquid chromatography (HPLC) profiles. Alcohol extracts of the three Echinacea species were prepared and orally administered in order to compare their effects on multiple immune parameters, i.e., NK cell activity, plaque-forming cell (PFC) response against sRBC, and B- and T-lymphocyte proliferation as well as T-cell and macrophage cytokine production in healthy BALB/c mice. We found many functional immune assays were affected by Echinacea preparations, suggesting that Echinacea not only stimulates innate immunity, but also enhances adaptive immunity.
MATERIALS AND METHODS
Echinacea preparation
E. angustifolia, E. pallida, and E. purpurea were harvested in the USDA North Central Regional Plant Introduction Station (Ames, IA) in October 2003 with identification numbers PI 631285 (E. angustifolia), PI 631293 (E. pallida), and PI 631307 (E. purpurea). Extracts from the dried roots of these plants were prepared as follows: ground root powder was placed into a Whatman 43 × 123-mm cellulose extraction thimble (Whatman International Ltd., Maidstone, UK), covered with glass wool on the top, and refluxed with 250 mL of different organic solvents, 100% ethanol, 95% ethanol, chloroform, and hexane, for 6 hours using a Soxhlet extraction device. The extract was evaporated to dryness with a R-114 rotary evaporator (Brinkman Instruments, Westbury, NY) at <30°C under reduced pressure, and the residue was stored in a red glass bottle to preserve it from photoxidation3 at −20°C. The average efficiency of Soxhlet extraction of the three species was 23% (230 mg of residue/g of starting material).
Before animal treatment, the extracts were dissolved in 95% ethanol and then diluted in nanopure water to a final suspension containing 14.7 mg/mL extracts in 5% ethanol. Ultrasonic treatment was used during the dilution process to improve solubility. After a homogenized suspension was obtained, aliquots were stored at −20°C and thawed for gavage or other analyses with each aliquot used once. The endotoxin level was evaluated in aliquots of the three Echinacea preparations using the Bio-Whitaker (Cambridge, MA) QCL 1000 kit and was below the limit of detection (0.1 EU/mL).
Phytochemical analysis
The phytochemical analysis was performed to detect amides and caffeic acid derivatives in the Echinacea preparations with the use of HPLC.26 Before analysis, dimethyl sulfoxide was added in order to obtain fully dissolved samples. To 320 μL of Echinacea extracts, 40 μL (1 mg/mL) of N-isobutylundeca-2-ene-8,10-diynamide (C15H21O2) and 3,5-dimethoxy-4-hydroxycinnamic acid (C11H12O5) each were added as internal standards for quantification of lipophilic chemicals and hydrophilic chemicals, respectively. Fifteen microliters of each sample was injected into a Beckman Coulter (Fullerton, CA) HPLC apparatus with a model 508 autosampler, model 126 pump control, and model 168 ultraviolet (UV)-photodiode array detector controlled by 32 Karat™ software (version 5.0) and a YMC-Pack ODS-AM RP C18 (250 × 4.6 mm; particle size, 5 μm) analytical column (Waters, Milford, MA). The solvent system for lipophilic constituents was acetonitrile/H2O at a flow rate of 1.0 mL/minute following a linear gradient of 40–80% acetonitrile over 45 minutes. The solvent system for hydrophilic constituents consisted of acetonitrile/H2O and 0.01 % formic acid, at a flow rate of 1.0 mL/minute following a linear gradient of 10–35% acetonitrile over 25 minutes. On-line UV spectra were collected between 190 and 400 nm. The lipophilic chemicals were quantified based on the internal standard with the limit of HPLC detection at approximately 0.02/μg/mL.
Animals
Animal care and experimental procedures were approved by the Iowa State University Committee on Animal Care. Male BALB/c mice at 8 weeks of age were obtained from Harlan Laboratories (Indianapolis, IN) and allowed to acclimate to their new environment for 2–3 weeks. The mice were housed three per cage and provided free access to food and water. The animal room was maintained on a reverse 12-hour light/dark cycle (lights on at 8 PM).
Echinacea administration
This study consisted of two independent experiments with an identical study design. After acclimation, the mice were randomly assigned to five groups. Groups 1–3 were gavaged with one of the three Echinacea preparations. Group 4 was gavaged with an equal volume of 5% ethanol as vehicle control. Group 5 served as a no gavage control (no treatment group). The vehicle control and the no gavage control were established to control for the effects of vehicle as well as handling stress. The Echinacea preparations were orally administered to the animals at 130 mg/kg of body weight once daily for 7 consecutive days using an animal feeding needle. This dosage and regimen were chosen based on an extrapolation of the dose recommended for humans (4 g of powder/day for an average 65-kg human × 1 week).27 We extrapolated the dose by using a 10-fold increase for mice according to skin to body ratio difference for mice and humans. We multiplied the dose by 23%, as this was the average efficiency of Soxhlet extraction. The gavage dose volume was 0.18 mL of extract suspension per 20 g of mouse body weight. On the fourth day, all mice were injected intraperitoneally with 0.5 mL of 20% washed sRBC (Remel, Lenexa, KS) in Hanks’ balanced salt solution (HBSS) (GIBCOreg;, Invitrogen Corp., Carlsbad, CA) to induce an immune response. Our preliminary observation found that sRBC-injected mice did not display significant immunological changes as measured in this study when compared to those animals receiving an injection of HBSS except that there were some changes in the percentages of leukocyte composition in the spleen. Thus, in this study all mice were treated equally with an sRBC injection to maintain the same experimental condition.
Sample collection
The mice were weighed at the beginning and the end of the experimental treatments. At 12–15 hours after the last gavage, the mice were euthanized by CO2 asphyxiation, and immune samples were collected immediately. Blood was collected by heart puncture using a heparin-containing syringe. An aliquot of blood was taken to perform hematological assay by using the Hemavet 850 Hematology Analyzer (Drew Scientific, Inc., Oxford, CT). The remaining blood was diluted 1:10 with AIM-V media, supplemented with 2 mM glutamine, 25 mM HEPES buffer, and 50 μg/mL gentamicin (AIM-V media), for use in a whole blood proliferation assay.
The spleens were aseptically removed from the mice and placed in AIM-V media. The spleen weight was recorded to assess spleen/body weight ratio. The spleen was then dissociated into a single-cell suspension by gentle grinding between the frosted ends of two sterile microscope slides. The splenocytes were enumerated and diluted to 5 × 10⁶ cells/mL in RPMI 1640 medium (GIBCO, Invitrogen Corp.) supplemented with 2 mM glutamine, 25 mM HEPES buffer, 50 μg/mL gentamicin, and 10% heated-inactivated fetal bovine serum (FBS) (complete media) to use in immune function assays. A separate aliquot of splenocytes was diluted in HBSS containing 25 mM HEPES buffer, 50 μg/mL gentamicin, and 6% FBS (HBSS-6% FBS) for antibody staining for CD19+ and CD49+ subsets.
Flow cytometric assay of lymphocyte subsets
Fluorescent-labeled monoclonal antibodies were used to identify lymphocyte subsets in the spleen. Freshly isolated splenocytes from mice were simultaneously stained with phycoerythrin (PE)-labeled anti-mouse CD49b monoclonal antibody (pan NK cells) and biotin-labeled anti-mouse CD19 monoclonal antibody (B cells) (Pharmingen, San Diego, CA). PE rat IgMκ and biotinylated rat IgG2ακ (Pharmingen) were used for the negative isotypic controls. Streptavidin-cychrome (Pharmingen) was used as a fluorescent tag for biotinylated antibodies. Splenocytes (5 × 10⁵ cells) in HBSS-6% FBS were diluted with 100 μL of ice-cold phosphate-buffered saline (PBS)/0.1 % NaN3 (azide). One microgram of anti-CD49b or 0.2 μg of anti-CD19 as well as 4 μL of normal mouse serum for blocking were added. An equal amount of isotypic antibodies and normal mouse serum was added to the corresponding control tubes. After incubation for 40 minutes in an ice-water bath, red blood cells were lysed using ice-cold ammonium chloride solution. Cells were washed with PBS/azide, and streptavidin-cychrome was then added to tubes containing biotinylated antibodies. The cells were incubated again in an ice-water bath. After one more wash the cells were fixed with PBS containing 1% formaldehyde. The cells were analyzed within 72 hours using a Beckman Coulter Epics® XL-MCL™ flow cytometer.
NK cell cytotoxicity
Splenic NK cell cytotoxicity was assessed by the chromium (51Cr) release assay as previously described,28 but with a small modification. Briefly, recombinant human interleukin (IL)-2 (5 ng, Sigma, St. Louis, MO) and splenocytes were plated to a flat-bottom 96-well plate (Corning Inc., Corning, NY) and incubated at 37°C in a 7% CO2 incubator overnight. YAC-1 cells (American Type Culture Collection, Manassas, VA) were used as targets and were labeled with 200 μCi of 51Cr as sodium chromate (PerkinElmer, Boston, MA) at 37°C for 70 minutes. Washed target cells were plated at 104 per well in all experimental, spontaneous, and maximum wells, and the plates were incubated for an additional 4.5 hours at 37°C. Three effector/target cell ratios, 25:1, 50:1, and 100:1, were assessed in triplicate. Total incubation time including IL-2 activation and target killing was 24 hours. Following addition of trichloroacetic acid (10%) to maximum release wells to lyse the targets, the plate was centrifuged at 500 rpm for 5 minutes. An aliquot of cell-free supernatant was removed and counted in a gamma Trac 1191 counter (TM Analytic, Inc., Elk Grove Village, IL).
Percent cytotoxicity of experimental samples was calculated using the following formula:
PFC assay
B-cells making antigen-specific antibodies to sRBC were quantitated using a PFC assay. Guinea pig complement (Cedarlane Laboratories Ltd., Hornby, ON, Canada) adsorbed against packed sRBC, 4% sRBC, and mouse splenocytes were mixed in equal volume. An aliquot (40 μL) was immediately transferred into two sides of a Cunningham chamber.29 Slide chambers were sealed with melted paraffin and incubated for 1 hour at 37°C in a humidified incubator. Plaques were counted under low power on a microscope.
Cell proliferation assay
Mitogen-induced proliferation assay was performed using whole spleen cells and whole blood cells. Concanavalin A (Con A) and Escherichia coli lipopolysaccharide (LPS) (Sigma) were used as nonspecific T-lymphocyte mitogen and B-lymphocyte mitogen, respectively.
Splenocyte proliferation was performed using 5 × 10⁵ cells per well in triplicate in a 96-well Costar (Cambridge, MA) plate and a final concentration of LPS of 10 μg/mL and Con A of 1 and 3 μg/mL. After co-incubation for 28 hours, all wells were pulsed with [3H]thymidine (1 μCi per well) (PerkinElmer) and continued to incubate at 37°C in 7% CO2. Following 48 hours of total incubation, the cultures were harvested using a Skatron (Sterling, VA) Cell Harvester, and the [3H]thymidine incorporation was determined by using a liquid scintillation analyzer (Mode Tricarb 2100TR, Packard Instrument Co., Downers Grove, IL).
The blood cell proliferation assay was conducted by using a similar protocol as described in the splenocyte proliferation assay. Diluted blood was incubated without or with LPS (10 μg/mL) or Con A (20 μg/mL) for 52 hours, and all wells were then pulsed with 1 μCi per well of [3H]thymidine and incubated for 20 hours. The cultures were harvested, and the [3H]thymidine incorporation was determined.
Enzyme-linked immunosorbent assay (ELISA) of cytokine production
The levels of cytokines were measured in the cultures of mitogen-stimulated mouse splenocytes ex vivo. Five hundred microliters of spleen cells was added to a 24-well flat-bottom Costar plate containing 500 μL of media or mitogen (LPS or Con A, 20 μg/mL) and incubated for 24–72 hours at 37°C in 7% CO2. Following incubation, the culture supernatants were harvested and frozen at −20°C for later analysis by ELISA (OptEIA ELISA mouse kits, BD Bio-sciences, San Diego). ELISAs for IL-1β, IL-2, IL-4, IL-6, IL-10, IL-12 (p40), IFN-γ, and tumor necrosis factor (TNF)-α were conducted according to the manufacturer’s protocol with the exception that the plates were read at 655 nm in a plate reader (Bio-Rad, Hercules, CA) 30 minutes after the addition of substrate. The cytokine levels were determined by comparison to a standard curve generated from serial dilutions of purified recombinant mouse cytokines.
Statistical analysis
Statistix software (version 8.0, Analytical Software, Tallahasee, FL) was used for the statistical analysis. Differences between Echinacea groups or the no gavage control and the vehicle control were tested by two-way analysis of variance (group × experiment) with subsequent a priori contrasts used to compare all three Echinacea treatments to the vehicle control. For analysis of NK cell data a factor for effector/target ratio was included in the model. For the PFC cell assay the model contained a factor for covariance based on the percentage of CD19+ cells, and for the NK cell activity the model contained a factor for covariance based on the percentage of CD49+ cells. A value of P < .05 was considered statistically significant.
RESULTS
HPLC analysis
The levels of phytochemical constituents were quantified using HPLC and are listed in Table 1. Amounts and types of identifiable amides and caffeic acid derivatives were quite distinct mong the three species. Total identifiable constituents in the preparations of E. angustifolia, E. pallida, and E. purpurea were 107.7, 29.5, and 87.4 μg/mg of extract, respectively. Most phytochemicals detected were lipophilic amides, especially in E. angustifolia and E. purpurea preparations, in which amides represent approximately 94.5% and 91.2% of all phytochemicals, respectively. A minor part of the phytochemicals was caffeic acid derivatives. Echinacoside was found to be the main caffeic acid derivative in preparations of both E. angustifolia and E. pallida, whereas no echinacoside was detected in the E. purpurea preparation. Cichoric acid was measurable in both E. pallida and E. purpurea preparations and was the main caffeic acid derivative of the E. purpurea preparation. Cynarin was detected in the E. angustifolia preparation, chlorogenic acid in the E. angustifolia and E. pallida preparations, and caftaric acid in the E. purpurea and E. pallida preparations. None of the phytochemical constituents was detectable in the vehicle.
Table 1.
Concentration and Percentage of Known Amides and Caffeic Acid Derivatives in Echinacea Preparations
| E. angustifolia
|
E. pallida
|
E. purpurea
|
|||||||
|---|---|---|---|---|---|---|---|---|---|
| μg/mg of extracta | % metabolitesb | μg/mouse/dayc | μg/mg of extracta | % metabolitesb | μg/mouse/dayc | μg/mg of extracta | % metabolitesb | μg/mouse/dayc | |
| Amide 1 | 1.620 | 1.50 | 5.447 | ND | 6.708 | 7.86 | 22.550 | ||
| Amide 2 | 1.161 | 1.08 | 3.904 | 6.443 | 21.83 | 21.660 | 12.471 | 14.27 | 41.921 |
| Amide 3 | 3.319 | 3.08 | 11.158 | 1.626 | 5.51 | 5.466 | 12.532 | 14.34 | 42.127 |
| Amide 4 | 0.488 | 0.45 | 1.639 | 1.403 | 4.75 | 4.715 | 6.148 | 7.08 | 20.789 |
| Amide 5 | 2.531 | 2.36 | 8.507 | 0.704 | 2.38 | 2.367 | 2.483 | 2.84 | 8.347 |
| Amide 7 | ND | ND | 3.619 | 4.14 | 12.167 | ||||
| Amide 8 | 55.425 | 51.47 | 196.319 | ND | 21.573 | 24.69 | 75.521 | ||
| Amide 9 | 7.685 | 7.14 | 25.835 | 6.885 | 23.32 | 23.146 | 12.477 | 12.28 | 41.942 |
| Amide 10 | 5.334 | 4.95 | 17.931 | 0.431 | 1.46 | 1.449 | 0.905 | 1.04 | 3.042 |
| Amide 11 | 13.306 | 12.36 | 44.730 | 0.713 | 2.42 | 2.398 | 0.782 | 0.90 | 2.630 |
| Amide 12 | 4.055 | 3.77 | 13.631 | ND | ND | ||||
| Amide 13 | 3843 | 3.56 | 12.888 | ND | ND | ||||
| Amide 14 | 3.011 | 2.80 | 10.121 | ND | ND | ||||
| Total amides | 101.769 | 94.499 | 342.110 | 18.206 | 61.673 | 61.200 | 79.734 | 91.256 | 268.036 |
| Caftaric acid | ND | 0.543 | 1.84 | 1.824 | 1.184 | 1.36 | 3.980 | ||
| Chlorogenic acid | 0.473 | 0.44 | 1.590 | 1.357 | 4.60 | 4.563 | ND | ||
| Cynarin | 1.929 | 1.79 | 6.48. | ND | ND | ||||
| Echinacoside | 3.523 | 3.27 | 11.84. | 8.350 | 28.29 | 28.069 | ND | ||
| Cichoric acid | ND | 1.064 | 3.60 | 3.577 | 6.456 | 7.39 | 21.702 | ||
| Total caffeic acid derivatives | 5.924 | 5.50 | 19.916 | 11.314 | 38.33 | 38.033 | 7.640 | 8.74 | 25.682 |
| Total metabolites | 107.694 | 100 | 362.025 | 29.520 | 100 | 99.234 | 87.374 | 100 | 293.719 |
ND, not detected.
Average of duplicate determinations.
% metabolites = (concentration of individual metabolite/concentration of total metabolites) × 100.
Intake of individual metabolite for each mouse on each day of oral Echinacea administration.
General animal observation
Adverse effects or obvious changes in behavior of the animals were not seen throughout the 7-day treatment course. No difference in body weight of the animals was found between the vehicle control and any of the other groups before or after experimental treatment. The mean body weights of the five groups before and after treatment were 25.8 ± 2.0 g and 25.6 ± 1.8 g, respectively.
Peripheral blood and spleen cell subpopulations
Peripheral blood hematological parameters were measured following the 7-day Echinacea treatment. No significant changes to leukocyte number, red blood cell number, hemoglobin level, or other hematological parameters were associated with oral administration of any of the three Echinacea preparations as compared to the vehicle control and the no gavage control (data not shown). However, the three Echinacea preparations significantly increased the percentage of lymphocytes in peripheral blood over the vehicle control group and the no gavage control (62.7% vs. 58.0%; P = .001). For other leukocyte subpopulations (neutrophil, monocyte, eosinophil, and basophil), no significant difference was observed between the Echinacea treatment groups and the two control groups.
There were no significant differences in spleen weight, spleen-to-body weight ratio, and total spleen cell number per mouse between the vehicle control and any of the other four groups. However, Echinacea treatment groups demonstrated a significant increase in the percentage of the lymphocyte subpopulation when compared to the vehicle control plus the no gavage control (83.3% vs. 81.1%; P = .004). Meanwhile, the Echinacea treatment induced a marginal decrease in the percentage of splenic neutrophils as compared to the vehicle and no gavage controls (10.1% vs. 11.5%; P = .084). There was no significant change in any of the other splenocyte subpopulations measured.
Based on the noted increase in the general percentage of splenic lymphocytes, specific lymphocyte subsets were further analyzed by flow cytometry for the expression of the CD49 and CD19 markers (Fig. 1). After 7 days of oral administration of vehicle (5% ethanol), there was a significant decrease in the percentages of both CD49+ and CD 19 + splenocytes when compared with the no gavage control (P = .002 and P = .017, respectively). However, groups that received Echinacea preparations by gavage did not exhibit the decrease in these subpopulations, as the Echinacea treatments are not significantly different than the no gavage control. Individual comparisons of the Echinacea treatment groups demonstrated that the percentage of both CD49+ and CD 19+ cells was significantly increased in the E. purpurea treatment group compared with the vehicle control. The percentage of CD49+ cells, but not of CD 19+ cells, was significantly increased in the E. angustifolia group compared with the vehicle control. No significant effect of E. pallida on splenic CD49+ and CD19+ subsets was seen.
FIG. 1.
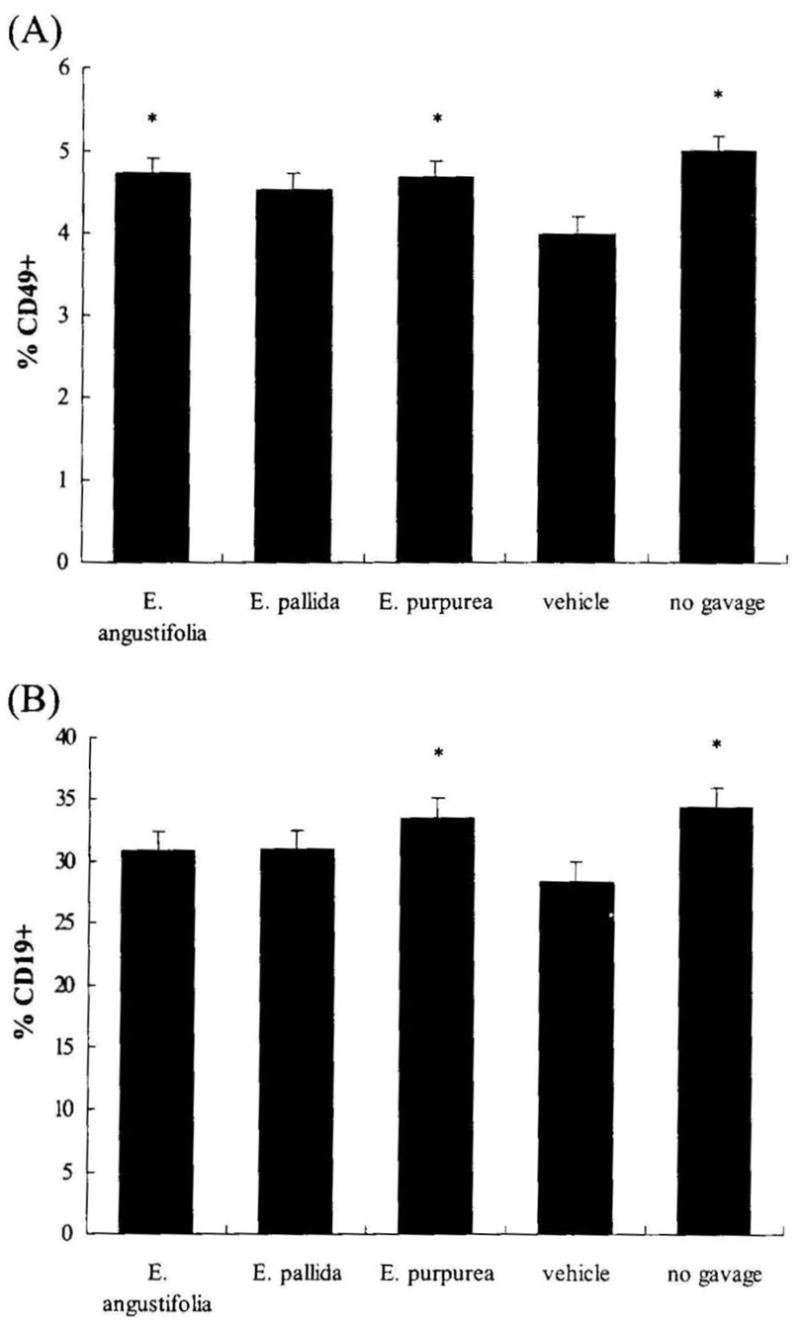
Effect of Echinacea preparations on the percentages of (A) splenic CD49+ and (B) CD19+ subsets. Male BALB/c mice were orally administered one of three Echinacea preparations, 130 mg/kg daily for 7 consecutive days. The vehicle control mice received an equal volume of 5% ethanol vehicle. Spleen cells were isolated to analyze the expression of the CD49 (NK cell subset) and CD19 (B-cell subset) markers by flow cytometry as described in Materials and Methods. Results are presented as mean ± SE values of two independent experiments (n = 6). *Significant group difference from vehicle control at P < .05.
NK cell killing
The capacity of NK cells to lyse the target YAC-1 tumor cells in vitro was assayed by 51Cr release assay. Since Echinacea treatment altered the CD49+ subset in spleen, NK cell cytotoxicity analysis was covaried for the percentage of CD49+ cells measured in each individual (Fig. 2). No difference was seen among the three Echinacea treatment groups and the no gavage control. When compared to the vehicle control, both the Echinacea treatment and the no gavage control showed a higher NK cell killing (P < .03 and P < .035, respectively). If the three Echinacea treatment groups were compared to the vehicle control separately, only the E. pallida group demonstrated a significant increase in NK cell cytotoxicity (P < .035).
FIG. 2.
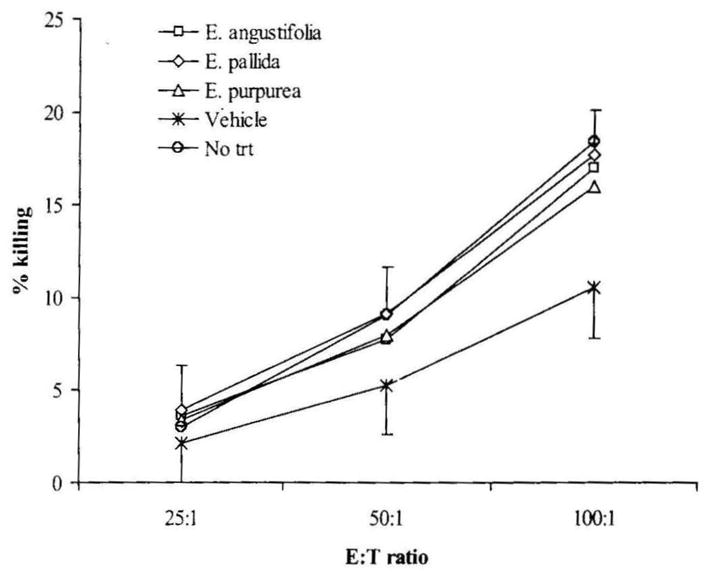
Effect of Echinacea preparations on NK cytotoxity after covarying for the percentage of CD49+ splenocytes in each animal. NK cell cytotoxicity was measured as described in Materials and Methods and expressed as percentage cytolysis of target cells. Results are presented as mean ± SE values of two independent experiments (n = 6). E:T, effector:target cell ratio; trt, treatment.
PFC response against sRBC
B cells specific for sRBC were enumerated using a PFC assay. Since the Echinacea treatment groups displayed significant effects on the percentage of B cells as measured by CD19+ splenocytes, statistical analysis of PFCs was adjusted by covariance with the percentage of CD19+ cells (Fig. 3). No significant difference in antibody response against sRBC was found between the two control groups, nor was there a significant difference among the three Echinacea treatment groups. However, the PFC counts of the three Echinacea treatment groups were significantly higher than those of the two control groups (P = .003). Individual comparisons demonstrated that all three Echinacea species had an increased PFC response to sRBC (all P < .035).
FIG. 3.
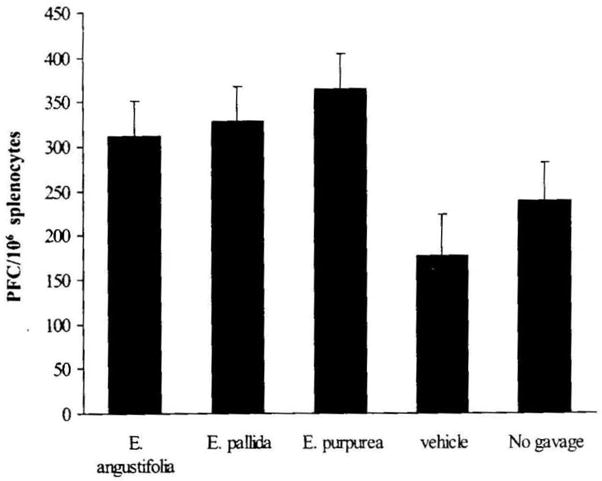
Effect of Echinacea preparations on splenic PFC response after covariance for the percentage of CD19+ splenocytes in each animal. PFC response was assayed as described in Materials and Methods and expressed as PFCs per 106 splenocytes. Results are presented as mean ± SE values of two independent experiments (n = 6).
Mitogen-stimulated lymphocyte proliferation
Splenic lymphocyte and blood lymphocyte proliferation was assayed by [3H]thymidine incorporation in the presence or in the absence of LPS or Con A. For splenic lymphocytes, the two mitogens produced a significant increase in cell proliferation (both P < .0001) (Fig. 4A). In the absence of mitogen, there was no significant difference among the five groups for splenic lymphocyte proliferation. In the presence of LPS, splenic lymphocyte proliferation was not affected by any of the three Echinacea treatments. With Con A at a low concentration of 1 μg/mL, the three Echinacea treatments demonstrated a marginal enhancement of splenic lymphocyte proliferation (P = .065). Individual comparisons demonstrated that E. pallida had a significant enhancing effect on splenic lymphocyte proliferation when compared with the vehicle control (P = .046). When the Con A concentration was increased to 3 μg/mL in the cultures, the three Echinacea treatments were significantly increased over the vehicle control (P = .034), which was due to both E. angustifolia and E. pallida having significantly higher splenic lymphocyte proliferation than the vehicle control (P = .032 and P = .015, respectively). Under all conditions, no difference in lymphocyte proliferation was observed between the vehicle control and the no gavage control.
FIG. 4.
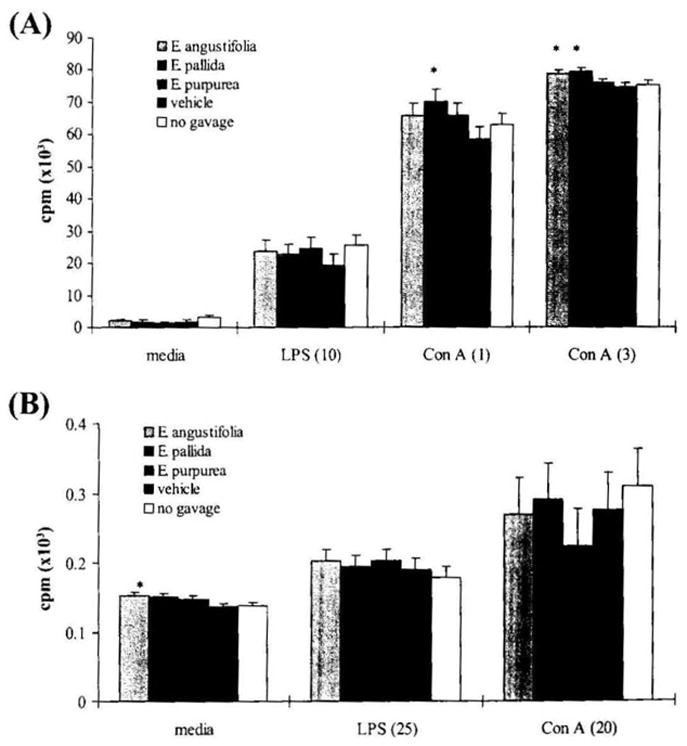
Effect of Echinacea preparations on (A) splenic and (B) blood lymphocyte proliferation. The lymphocyte proliferation assay was conducted as described in Materials and Methods. Results were expressed as cpm (3H incorporation) × 103 and are presented as mean ± SE values of two independent experiments (n = 6). Numbers in parentheses are the concentration of each mitogen (in μg/mL). *Significant difference from vehicle control at P < .05.
In blood cultures (Fig. 4B), there was a significant stimulation of baseline blood lymphocyte proliferation by the Echinacea treatment in comparison to both controls (P = .014). E. angustifolia and E. pallida were both significantly different than controls (both P < .043), while E. purpurea was only marginally different (P = .091). However, in the presence of Con A and LPS, Echinacea did not enhance blood lymphocyte proliferation. For the blood cultures there was no difference in lymphocyte proliferation between the vehicle control and the no gavage control.
Cytokine production
Cytokines are recognized as immune transmitters that regulate interactive effects among immune cells. A specialized cytokine can stimulate certain types of immune cells, but inhibits others. Cytokine concentrations were assessed in cultures of unstimulated and mitogen-stimulated splenocytes derived from the gavage and no gavage treatment groups.
TH2 cells secrete a number of cytokines, such as IL-4, IL-6, and IL-10, that drive humoral immunity but inhibit macrophages and are considered anti-inflammatory. E. angustifolia and E. pallida showed increased IL-4 and IL-10 production over the vehicle control in Con A-stimulated spleen cells; however, the enhancement reached significance only for the increased IL-4 production (P = .046) (Fig. 5). The increase in IL-10 was only marginally significant for cultures from E. angustifolia and E. pallida when compared to the vehicle control group (P = 0.057). For spleen cells without mitogen stimulation, E. angustifolia significantly increased IL-4 production compared to the vehicle control group (P = .013). The three Echinacea preparations had no effect on IL-6 release.
FIG. 5.
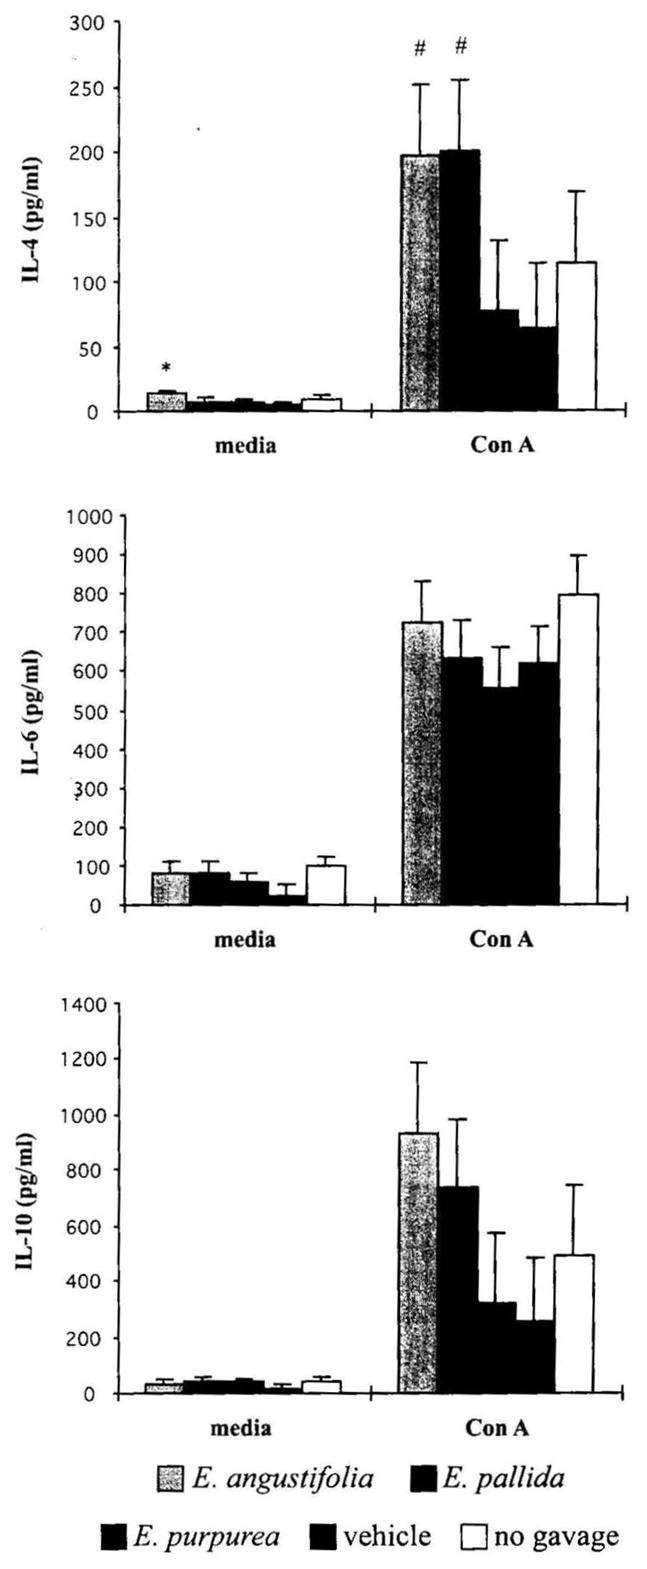
Effect of Echinacea preparations on TH2 cytokine production by mouse splenocytes stimulated in vitro without or with mitogen. Spleen cells were incubated without or with Con A at 10 μg/mL for 72 hours. Cytokine levels were determined as described in Materials and Methods. Results are presented as mean ± SE values of two independent experiments (n = 6). *Significant difference from vehicle control at P < .05. #Significant difference for the combination of corresponding Echinacea treatment groups from vehicle control.
TH1 cells secrete IL-2 and IFN-γ that activate cell-mediated immunity, including NK cells and macrophages. The Echinacea treatment significantly increased IL-2 and IFN-γ production in baseline cultures of splenocytes (both P < .035) and IFN-γ production by Con A-stimulated splenocytes (P = .005) (Fig. 6). Individual comparison of Echinacea treatment groups showed that only E. angustifolia produced a significant increase in IL-2 production in Con A-stimulated splenocytes (P = .037). It is of interest to note that IFN-γ production in the vehicle control group was suppressed in comparison to the no gavage control group (P = .054).
FIG. 6.

Effect of Echinacea preparations on TH1cytokine production by mouse splenocytes stimulated in vitro without or with mitogen. Spleen cells were incubated without or with Con A at 10 μg/mL for 48 hours. Cytokine levels were determined as described in Materials and Methods. Results are presented as mean ± SE values of two independent experiments (n = 6). *Significant difference from vehicle control at P <.05. #Significant difference for the combination of corresponding Echinacea treatment groups from vehicle control.
Macrophages produce numerous inflammatory mediators, among them the cytokines TNF-α, IL-1β, and IL-12. In comparison to the vehicle control group, the three Echinacea preparations significantly decreased the production of IL-1β (P = .007) and TNF-α (P = .004) by LPS-stimulated splenocytes, but had no significant effect on IL-12 production (Fig. 7). It is interesting to note that the vehicle control group demonstrated a significantly enhanced production of the inflammatory cytokine TNF-α compared to the no gavage group (P = .004), while IL-1β demonstrated a nonsignificant trend towards an increase. However, for baseline spleen cells without mitogen stimulation, E. purpurea induced a significant increase in IL-1β production compared to the vehicle control (P = .006).
FIG. 7.
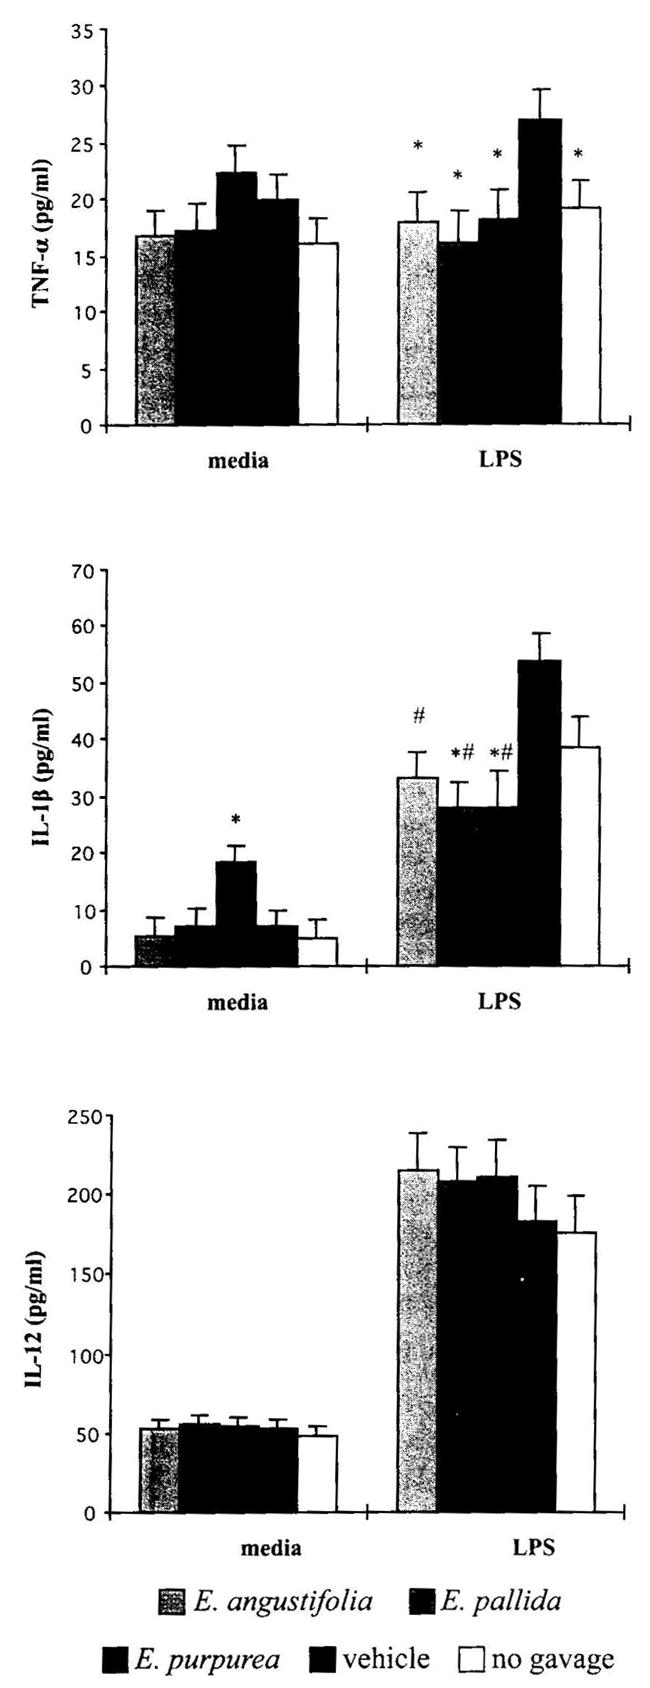
Effect of Echinacea preparations on macrophage cytokine production in vitro without or with mitogen. Spleen cells were incubated without or with LPS at 10 μg/mL for 24 hours at 37°C in a 7% CO2 incubator. Cytokine levels were determined as described in Materials and Methods. Results are presented as mean ± SE values of two independent experiments (n = 6). *Significant difference from vehicle control at P <.05. #Significant difference for the combination of corresponding Echinacea treatment groups from vehicle control.
DISCUSSION
According to accumulated data, Echinacea exerts its pharmacological action via the modulation of nonspecific innate immune parameters such as macrophage phagocytosis and pro-inflammatory cytokine production.6,7 Thus, Echinacea is thought of as a nonspecific immunomodulalor. “Nonspecific” may also mean that the herb promotes overall immune system function. The results from the present study provide information supporting the latter concept as oral administration of Echinacea resulted in multiple immunological changes, including the activation of NK cell activity, the enhancement of B-cell response to sRBC, increased T-cell proliferation in response to mitogens, and increased production of some T-cell cytokines. Also, this study demonstrates that the preparations from three common Echinacea species did not display opposing influences on immune system function; however, the magnitude of the effects differed depending the immune parameter measured and species of Echinacea.
For the experimental animals, the 7-day orogastric gavage and daily handling are doubtlessly stressors that lead to stress-induced changes of immunity.30,31 In addition, the 5% ethanol vehicle could also contribute to some immune changes. It has been shown that a short-term consumption of low-dose dietary ethanol (4–7%) for 1–2 weeks could inhibit cell-mediated immune responses and sensitize the host to infection.32,33 In order to control these “stress” effects and highlight the effects of Echinacea on the immune system, both the vehicle control and the no gavage control were tested in this study. The observed differences in the vehicle control from the no gavage control reflect the immunological changes induced by stress and vehicle. Under the same stress condition, the difference between the Echinacea treatment groups and the vehicle control mirrors the immunological changes caused by Echinacea. We found that as compared with the no gavage control, Echinacea treatment groups did not differ in all of the immune parameters we measured, but it did differ significantly from the vehicle control. In comparison to the no gavage control, the vehicle control displayed a weakened immune capacity as evidenced by a decrease in splenic CD19+ cells and CD49+ cells, as well as NK cell cytotoxicity. Conversely, the gavage with vehicle induced an increase in TNF-α and IL-1β production as compared to the no gavage control, suggesting that the 7-day handling and gavage with 5% ethanol altered host immune responsiveness. Interestingly, all these altered immune parameters could be returned to their normal levels by treatment with Echinacea. These results are of particular significance under clinical aspects, since the weakened immune system ranks high among the main indications for herbal immunomodulants.17 For this purpose, the immunostimulating effects of Echinacea have been investigated in several nonpathogenic, immunosuppressed animal models (i.e., old age or hydrocortisone-treated animals).8,12,13,17,34 In this respect, mild handling stress- and/or low-dose ethanol-induced immunosuppression is likely to be another ideal model to observe the immunological potential of Echinacea with greater similarities to daily human stressful conditions.
Previous research demonstrated that Echinacea increases the numbers of circulating leukocytes, including total cell count and subpopulations (i.e., neutrophil, NK cell, and T lymphocyte).8,10,18 We found an increased percentage of lymphocytes not only in peripheral blood but also in the spleens of mice following 7-day oral treatment with our Echinacea preparations, so that extends the previous findings. Cundell et al.8 observed a sustained, significant increase in the percentage of circulating mononuclear cells (lymphocytes and monocytes) associated with a significant decrease in the percentage of circulating neutrophils in aging rats fed with Echinacea for 8 weeks. In healthy horses Echinacea increased the number of peripheral lymphocytes, but decreased the neutrophil count on day 35 during a 42-day feeding with E. angustifolia extract.10 The present study observed a significant increase in the percentage of total lymphocytes in animals gavaged with Echinacea compared to vehicle-treated animals, suggesting that other leukocyte types must be decreased. Although the percentage of neutrophils in both blood and spleen was not significantly different among the animals from the Echinacea and vehicle-treated groups, this population exhibited a small, nonsignificant, decrease in Echinacea-treated animals. Other studies have suggested that the decrease in the percentage of neutrophils may be due to increases in granulocyte migration into the tissues.9,10 As lymphocytes consist of NK cells, T cells, and B cells, Echinacea-induced changes in the percentage of lymphocyte subpopulations indicated Echinacea might modulate both innate and adaptive immune functions.
NK cells play a critical role in clearing viral infections through the processes of cytotoxicity and production of cytokines, such as IFN-γ. It has been demonstrated that Echinacea increased NK cytotoxic function in vitro in human peripheral blood lymphocytes of both healthy individuals and patients with chronic fatigue syndrome or acquired immunodeficiency syndrome.34 Currier and Miller12,13 observed a significant activation of NK cells and an increase in NK cell numbers in aging mice fed with a diet containing commercially prepared root extract of E. purpurea. Our present study found the three Echinacea preparations induced similar effects on NK cell activity. In comparison to the no gavage control, gavage with vehicle resulted in a decrease in the NK cell cytotoxicity, which is likely due to both stress effects of daily handling and 5% ethanol. It is interesting that Echinacea could attenuate the decreased NK cell activity. Moreover, analysis of data using covariance indicated that Echinacea increased NK cell activity over a simple increase in the cell count.
Changes in B cell responses by a glycerine extract of E. purpurea have been noted.15 To discern an effect on B cells we measured PFC response against sRBC, the percentage CD19+ cells in spleen, and B-cell proliferation in LPS-stimulated spleen cells. Gavage with Echinacea extracts led to a significant increase in PFC response against sRBC. Echinacea also affected the percentage of lymphocytes as well as the percentage of CD 19+ cells in the spleen. As with the effects on NK cell activity, the vehicle control decreased the number of CD19+ cells in spleen cells when compared with the no gavage control. However, the vehicle-induced decrease in CD 19+ cells was attenuated in animals receiving Echinacea, with a greater increase in animals gavaged with E. purpurea, suggesting that Echinacea may affect B-lymphocyte development or migration in vivo.
It is well known that both subsets of TH cells are usually activated in immune response to complex antigens. In response to viral infection, antigen-specific T-helper and T-cytotoxic cells proliferate and secrete cytokines, and the T-cytotoxic cells kill virally infected cells. Historical use of Echinacea in the treatment of viral infection has lead to the reasoning that Echinacea acts on T cells.22 Morazzoni et al.19 observed anti-CD3-treated murine T-cell proliferation by LPS-free E. angustifolia root extract and suggested Echinacea activity on the immune system involves the interaction with T cells. Our results demonstrated that Con A-induced splenic T-cell proliferation could be enhanced by in vivo treatment with E. angustifolia or E. pallida. In addition, it was found that E. angustifolia administered in vivo stimulated lymphocyte proliferation in the absence of mitogens. The effects of Echinacea on T-cell cytokine production were measured, including both TH1 cytokines (IFN-γ and IL-2) and TH2 cytokines (IL-4, IL-6, and IL-10). Echinacea extracts were found to have enhancing effects on IFN-γ and IL-2 production, and IL-4 and IL-10 levels showed a three- to fourfold increase by spleen cells from animals gavaged with E. angustifolia and E. pallida. These results indicate that E. angustifolia and E. pallida modulate both the TH1- and TH2-cell immune function. E. purpurea, in contrast to the other two Echinacea species, showed a relatively weaker effect on the TH1-cell cytokine productions.
TH1-cell activation will in turn activate macrophages that protect against intracellular pathogens. The effects of Echinacea on phagocytosis and cytokine production by macrophages have been extensively investigated in vitro and in vivo, but the results were rather inconsistent (see reviews by Barrett6 and Percival7). Macrophages are important as a first line of defense against infections. Upon activation, they may secrete many pro-inflammatory cytokines, such as TNF-α, IL-1β, IL-12, and IL-6. However, inflammatory processes subsequently need to be down-regulated to allow healing. These divergent and, at times, seemingly contradictory effects reflect the dichotomy of macrophages as both pro- and anti-inflammatory effectors in response to host environmental changes. Recently one study25 reported opposing effects of Echinacea on cytokine gene expression when used in vitro versus oral administration in vivo. The in vitro data found a short-term (6-h) exposure of human monocytic cell line THP-1 cells to E. purpurea stimulates the expression of inflammation-related genes, such as IL-1β, TNF-α, IL-8, intracellular adhesion molecule-1, and cyclooxygenase-2. However, oral administration of Echinacea in vivo induced a reduction in the expression of inflammation-related genes, but increased the IFN-α expression in healthy individuals.25 The effects of Echinacea on cytokine production vary considerably, depending on the experimental conditions used (e.g., animal model, cell culture model, and the treatment scheme). Our animal model in this study demonstrated Echinacea exerted a strong inhibition on the TNF-α and IL-1β production by macrophages in the presence of LPS, suggesting that Echinacea has anti-inflammatory activity, as demonstrated previously.3,4 The down-regulation of these two important inflammatory mediators might be associated with increased production of IL-4. IL-4 supports the differentiation of CD4+ into TH2-type cells and simultaneously suppresses the development of TH1-type cells. On macrophages, IL-4 acts in an anti-inflammatory manner to inhibit the production of pro-inflammatory cytokines, i.e., IL-1β and TNF-α.35,36
Undoubtedly, the observed differential effects of these three Echinacea species on certain immune parameters are associated with their variation in phytochemical composition. Among the phytochemicals, amides, echinacoside, and cichoric acid are thought of as the main active compounds responsible for the immunomodulatory action of alcohol extracts of Echinacea.24,37,38 E. purpurea has been reported to have a mix of constituents different from the other two species.24,38 Chromatographic analysis of our preparations showed that E. purpurea lacks echinacoside, but contains cichoric acid. Most, though not all, amides were present in the three Echinacea preparations and made up a major part of all identifiable phytochemicals, especially for E. angustifolia and E. purpurea preparations. Among the three Echinacea species, E. purpurea is believed to have the strongest potency on the immune system.39 It is unexpected that E. purpurea displayed a weaker potential to stimulate TH2- and TH1-type cytokine production than E. angustifolia and E. pallida, especially since the HPLC results demonstrated that the E. purpurea extract contained high levels of amides and cichoric acid, with the latter proven to have stronger immunostimulatory effects than echinacoside.38 So in this study, other phytochemicals, but not amides and cichoric acid, in the E. angustifolia and E. pallida preparations may be responsible for the strong immunomodulatory effects on T lymphocytes. Echinacoside and chlorogenic acid were the main caffeic acid derivatives in both E. angustifolia and E. pallida preparations we used. Echinacoside has been studied for its antioxidant, anti-inflammatory, and cicatrizing activities.3,4,23,37 Data on the immunomodulatory effect of chlorogenic acid and cynarin, a characteristic component of E. angustifolia, are few. Given the use of the crude extracts in the present study and the minor proportion of measurable constituents in total extracts (<10.8%), we could not answer which chemical makes the major contribution to the modulatory effect on immune function and if there are other undetected active phytochemicals in the extracts.
In conclusion, the present orogastric administration studies with three different Echinacea species have proven them to be effective immunomodulators. We found that three different species of Echinacea exhibit multiple modulating effects on immune function. They stimulate not only nonspecific, innate immune response, but also specific, adaptive immune function, suggesting that Echinacea possesses an immunomodulating potential for the overall immune system. The effects of Echinacea were more robust in immune responses that were suppressed by the daily handling in the vehicle control group as compared to the no gavage group. To our knowledge, this is the first study that demonstrates the relevance of Echinacea’s immune-enhancing effects in conjunction with a mild stress.
Acknowledgments
This study was supported by the National Institute of Environmental Health Sciences (grant P01ESO12020) and the Office of Dietary Supplements, National Institutes of Health. This work was performed as part of the Center for Research on Dietary Botanical Supplements at Iowa State University and the University of Iowa. The authors are grateful to Dr. Chalermpol J. Lekcharoensuk for his technical assistance and statistical analyses and Dr. Diane Birt for good suggestions during review of the manuscript.
References
- 1.Caruso TJ, Gwaltney JM., Jr Treatment of the common cold with Echinacea: a structured review. Clin Infect Dis. 2005;40:807–810. doi: 10.1086/428061. [DOI] [PubMed] [Google Scholar]
- 2.Islam J, Carter R. Use of Echinacea in upper respiratory tract infection. South Med J. 2005;98:311–318. doi: 10.1097/01.SMJ.0000154783.93532.78. [DOI] [PubMed] [Google Scholar]
- 3.Speroni E, Govoni P, Guizzardi S, Renzulli C, Guerra MC. Anti-inflammatory and cicatrizing activity of Echinacea pallida Nutt root extract. J Ethnopharmacol. 2002;79:265–272. doi: 10.1016/s0378-8741(01)00391-9. [DOI] [PubMed] [Google Scholar]
- 4.Raso GM, Pacilio M, Di Carlo G, Esposito E, Pinto L, Meli R. In-vivo and in-vitro anti-inflammatory effect of Echinacea purpurea and Hypericum perforation. J Pharm Pharmacol. 2002;54:1379–1383. doi: 10.1211/002235702760345464. [DOI] [PubMed] [Google Scholar]
- 5.Currier NL, Miller SC. The effect of immunization with killed tumor cells, with/without feeding of Echinacea purpurea in an erythroleukemic mouse model. J Altern Complement Med. 2002;8:49–58. doi: 10.1089/107555302753507177. [DOI] [PubMed] [Google Scholar]
- 6.Barrett B. Medicinal properties of Echinacea: a critical review. Phytomedicine. 2003;10:66–86. doi: 10.1078/094471103321648692. [DOI] [PubMed] [Google Scholar]
- 7.Percival SS. Use of Echinacea in medicine. Biochem Pharmacol. 2000;60:155–158. doi: 10.1016/s0006-2952(99)00413-x. [DOI] [PubMed] [Google Scholar]
- 8.Cundell DR, Matrone MA, Ratajczak P, Pierce JD., Jr The effect of aerial parts of Echinacea on the circulating white cell levels and selected immune functions of the aging male Sprague-Dawley rat. Int Immunopharmacol. 2003;3:1041–1048. doi: 10.1016/S1567-5769(03)00114-0. [DOI] [PubMed] [Google Scholar]
- 9.Roesler J, Steinmuller C, Kiderlen A, Emmendorffer A, Wagner H, Lohmann-Matthes ML. Application of purified polysaccharides from cell cultures of the plant Echinacea purpurea to mice mediates protection against systemic infections with Listeria monocytogenes and Candida albicans. Int J Immunopharmacol. 1991;13:27–37. doi: 10.1016/0192-0561(91)90022-y. [DOI] [PubMed] [Google Scholar]
- 10.O’Neill W, McKee S, Clarke AF. Immunological and haematinic consequences of feeding a standardised Echinacea (Echinacea angustifolia) extract to healthy horses. Equine Vet J. 2002;34:222–227. doi: 10.2746/042516402776186001. [DOI] [PubMed] [Google Scholar]
- 11.Goel V, Chang C, Slama J, Barton R, Bauer R, Gahler R, Basu T. Echinacea stimulates macrophage function in the lung and spleen of normal rats. J Nutr Biochem. 2002;13:487–492. doi: 10.1016/s0955-2863(02)00190-0. [DOI] [PubMed] [Google Scholar]
- 12.Currier NL, Miller SC. Natural killer cells from aging mice treated with extracts from Echinacea purpurea are quantitatively and functionally rejuvenated. Exp Gerontol. 2000;35:627–639. doi: 10.1016/s0531-5565(00)00106-6. [DOI] [PubMed] [Google Scholar]
- 13.Currier NL, Miller SC. Echinacea purpurea and melatonin augment natural-killer cells in leukemic mice and prolong life span. J Alern Complement Med. 2001;7:241–251. doi: 10.1089/107555301300328115. [DOI] [PubMed] [Google Scholar]
- 14.Alban S, Classen B, Brunner G, Blaschek W. Differentiation between the complement modulating effects of an arabinogalactan-protein from Echinacea purpurea and heparin. Planta Med. 2002;68:1118–1124. doi: 10.1055/s-2002-36339. [DOI] [PubMed] [Google Scholar]
- 15.Freier DO, Wright K, Klein K, Voll D, Dabiri K, Cosulich K, George R. Enhancement of the humoral immune response by Echinacea purpurea in female Swiss mice. Immunopharmacol Immunotoxicol. 2003;25:551–560. doi: 10.1081/iph-120026440. [DOI] [PubMed] [Google Scholar]
- 16.Rehman J, Dillow JM, Carter SM, Chou J, Le B, Maisel AS. Increased production of antigen-specific immunoglobulins G and M following in vivo treatment with the medicinal plants Echinacea angustifolia and Hydrastis canadensis. Immunol Lett. 1999;68:391–395. doi: 10.1016/s0165-2478(99)00085-1. [DOI] [PubMed] [Google Scholar]
- 17.Bodinet C, Lindequist U, Teuscher E, Freudenstein J. Effect of an orally applied herbal immunomodulator on cytokine induction and antibody response in normal and immunosuppressed mice. Phytomedicine. 2002;9:606–613. doi: 10.1078/094471102321616418. [DOI] [PubMed] [Google Scholar]
- 18.Mishima S, Saito K, Maruyama H, Inoue M, Yamashita T, Ishida T, Gu Y. Antioxidant and immune-enhancing effects of Echinacea purpurea. Biol Pharm Bull. 2004;27:1004–1009. doi: 10.1248/bpb.27.1004. [DOI] [PubMed] [Google Scholar]
- 19.Morazzoni P, Cristoni A, Di Pierro F, Avanzini C, Ravarino D, Stornello S, Zucca M, Musso T. In vitro and in vivo immune stimulating effects of a new standardized Echinacea angustifolia root extract (Polinacea™) Fitoterapia. 2005;76:401–411. doi: 10.1016/j.fitote.2005.02.001. [DOI] [PubMed] [Google Scholar]
- 20.Stimpel M, Proksch A, Wagner H, Lohman-Matthes ML. Macrophage activation and induction of macrophage cytotoxicity by purified fractions from the plant Echinacea purpurea. Infect Immun. 1984;46:845–849. doi: 10.1128/iai.46.3.845-849.1984. [DOI] [PMC free article] [PubMed] [Google Scholar]
- 21.Burger RA, Torres AR, Warren RP, Caldwell VD, Hughes BG. Echinacea-induced cytokine production by human macrophages. Int J Immunopharmacol. 1997;19:371–379. doi: 10.1016/s0192-0561(97)00061-1. [DOI] [PubMed] [Google Scholar]
- 22.Senchina DS, McCann DA, Asp JM, Johnson JA, Cunnick JE, Kaiser MS, Kohut ML. Changes in immunomodulatory properties of Echinacea spp. root infusions and tinctures stored at 4 degrees C for four days. Clin Chim Acta. 2005;355:67–82. doi: 10.1016/j.cccn.2004.12.013. [DOI] [PubMed] [Google Scholar]
- 23.Sloley BD, Urichuk LJ, Tywin C, Coutts RT, Pang PK, Shan JJ. Comparison of chemical components and antioxidants capacity of different Echinacea species. J Pharm Pharmacol. 2001;53:849–857. doi: 10.1211/0022357011776009. [DOI] [PubMed] [Google Scholar]
- 24.Hu C, Kitts DD. Studies on the antioxidant activity of Echinacea root extract. J Agric Food Chem. 2000;48:1466–1472. doi: 10.1021/jf990677+. [DOI] [PubMed] [Google Scholar]
- 25.Randolph RK, Gellenbeck K, Stonebrook K, Brovelli E, Qian Y, Bankaitis-Davis D, Cheronis J. Regulation of human immune gene expression as influenced by a commercial blended Echinacea product: preliminary studies. Exp Biol Med (Maywood) 2003;228:1051–1056. doi: 10.1177/153537020322800910. [DOI] [PubMed] [Google Scholar]
- 26.Wu L, Bae J, Kraus G, Wurtele ES. Diacetylenic isobutylamides of Echinacea: synthesis and natural distribution. Phytochemistry. 2004;65:2477–2484. doi: 10.1016/j.phytochem.2004.06.027. [DOI] [PubMed] [Google Scholar]
- 27.Zink T, Chaffin J. Herbal ‘health’ products: what family physicians need to know. Am Fam Physician. 1998;58:1133–1140. [PubMed] [Google Scholar]
- 28.Cunnick JE, Sakamoto K, Chapes SK, Fortner GW, Takemoto DJ. Induction of tumor cytotoxic immune cells using a protein from the bitter melon (Momordica charantia) Cell Immunol. 1990;126:278–289. doi: 10.1016/0008-8749(90)90321-h. [DOI] [PubMed] [Google Scholar]
- 29.Cunningham AJ, Szenberg A. Further improvements in the plaque technique for detecting single antibody-forming cells. Immunology. 1968;14:599–600. [PMC free article] [PubMed] [Google Scholar]
- 30.Balcombe JP, Barnard ND, Sandusky C. Laboratory routines cause animal stress. Contemp Top Lab Anim Sci. 2004;43:42–51. [PubMed] [Google Scholar]
- 31.Hale KD, Weigent DA, Gauthier DK, Hiramoto RN, Ghanta VK. Cytokine and hormone profiles in mice subjected to handling combined with rectal temperature measurement stress and handling only stress. Life Sci. 2003;72:1495–1508. doi: 10.1016/s0024-3205(02)02415-3. [DOI] [PubMed] [Google Scholar]
- 32.Jayasinghe R, Gianutsos G, Hubbard AK. Ethanol-induced suppression of cell-mediated immunity in the mouse. Alcohol Clin Exp Res. 1992;16:331–335. doi: 10.1111/j.1530-0277.1992.tb01386.x. [DOI] [PubMed] [Google Scholar]
- 33.Saad AJ, Domiati-Saad R, Jerrells TR. Ethanol ingestion increases susceptibility of mice to Listeria monocytogenes. Alcohol Clin Exp Res. 1993;17:75–85. doi: 10.1111/j.1530-0277.1993.tb00729.x. [DOI] [PubMed] [Google Scholar]
- 34.See DM, Broumand N, Sahl L, Tilles JG. In vitro effects of Echinacea and ginseng on natural killer and antibody-dependent cell cytotoxicity in healthy subjects and chronic fatigue syndrome or acquired immunodeficiency syndrome patients. Immunopharmacology. 1997;35:229–235. doi: 10.1016/s0162-3109(96)00125-7. [DOI] [PubMed] [Google Scholar]
- 35.Etter H, Althaus R, Eugster HP, Santamaria-Babi LF, Weber L, Moser R. IL-4 and IL-13 downregulate rolling adhesion of leukocytes to IL-1 or TNF-alpha-activated endothelial cells by limiting the interval of E-selectin expression. Cytokine. 1998;10:395–403. doi: 10.1006/cyto.1997.0308. [DOI] [PubMed] [Google Scholar]
- 36.D’Andrea A, Ma X, Aste-Amezaga M, Paganin C, Trinchieri G. Stimulatory and inhibitory effects of interleukin (IL)-4 and IL-13 on the production of cytokines by human peripheral blood mononuclear cells: priming for IL-12 and tumor necrosis factor alpha production. J Exp Med. 1995;181:537–546. doi: 10.1084/jem.181.2.537. [DOI] [PMC free article] [PubMed] [Google Scholar]
- 37.Dalby-Brown L, Barsett H, Landbo AK, Meyer AS, Molgaard P. Synergistic antioxidative effects of alkamides, caffeic acid derivatives, and polysaccharide fractions from Echinacea purpurea on in vitro oxidation of human low-density lipoproteins. J Agric Food Chem. 2005;53:9413–9423. doi: 10.1021/jf0502395. [DOI] [PubMed] [Google Scholar]
- 38.Pellati F, Benvenuti S, Magro L, Melegari M, Soragni F. Analysis of phenolic compounds and radical scavenging activity of Echinacea spp. J Pharm Biomed Anal. 2004;35:289–301. doi: 10.1016/S0731-7085(03)00645-9. [DOI] [PubMed] [Google Scholar]
- 39.Bodinet C, Willigmann I, Beuscher N. Host-resistance increasing activity of root extracts from Echinacea species. Planta Med. 1993;59(Suppl):A672–A673. [Google Scholar]