

Abstract
Earlier work from our laboratory provided evidence for myelin abnormalities (decreased quantities of proteins associated with myelin compaction, decreased sheath thickness) in cortex and hippocampus of Aldh5a1−/− mice, which have a complete ablation of the succinate semialdehyde dehydrogenase protein [1]. In the current report, we have extended these findings via comprehensive analysis of brain phospholipid fractions, including quantitation of fatty acids in individual phospholipid subclasses and estimation of hexose-ceramide in Aldh5a1−/− brain. In comparison to wild-type littermates (Aldh5a1+/+), we detected a 20% reduction in the ethanolamine glycerophospholipid content of Aldh5a1−/− mice, while other brain phospholipids (choline glycerophospholipid, phosphatidylserine and phosphatidylinositol) were within normal limits. Analysis of individual fatty acids in each of these fractions revealed consistent alterations in n-3 fatty acids, primarily increased 22:6n-3 levels (docosahexaenoic acid; DHA). In the phosphatidyl serine fraction there were marked increases in the proportions of polyunsaturated fatty acids with corresponding decreases of monounsaturated fatty acids. Interestingly, the levels of hexose-ceramide (glucosyl- and galactosylceramide, principal myelin cerebrosides) were decreased in Aldh5a1−/− brain tissue (one-tailed t test, p=0.0449). The current results suggest that lipid and myelin abnormalities in this animal may contribute to the pathophysiology.
Keywords: Succinate semialdehyde dehydrogenase (SSADH), Aldehyde dehydrogenase 5a1 (Aldh5a1), γ-hydroxybutyric acid, γ-aminobutyric acid (GABA), myelin, phospholipids, ethanolamine glycerophospholipid, ethanolamine plasmalogen, galactosylceramide, docosohexaenoic acid (DHA)
INTRODUCTION
Heritable succinate semialdehyde dehydrogenase (SSADH; aldehyde dehydrogenase 5a1 (Aldh5a1) deficiency (OMIM 271980, 610045) is an inborn error of metabolism disrupting the final step in GABA catabolism [2]. The autosomal-recessively inherited defect leads to significant increases in GABA and γ-hydroxybutyric acid (GHB) in body fluids derived from affected patients. Elevated GHB in urine often results in the primary route of identification (via routine organic acid analysis), and represents the metabolic basis for the eponym, γ-hydroxybutyric aciduria [3]. Clinically, the phenotype is that of non-specific mild to severe neurological involvement, including psychomotor retardation, hypotonia, ataxia, reduced to absent speech development, and seizures in some patients [4]. Treatment options are limited, and have been predominantly symptomatic, such as carbamazepine for seizures, haloperidol for psychiatric manifestations, and rytalin for attention-deficit disorder [5]. The most widely employed pharmacotherapy is SabrilR (vigabatrin; γ-vinyl GABA), an inhibitor of the enzymatic reaction preceding SSADH, GABA transaminase. The rationale for vigabatrin intervention derives from its capacity to decrease the production of GHB (Fig. 1) [6]. Nonetheless, since vigabatrin also elevates cerebral GABA [6], its utility in SSADH deficiency may require re-evalauation since this is already a hyperGABAergic syndrome.
Fig. 1.
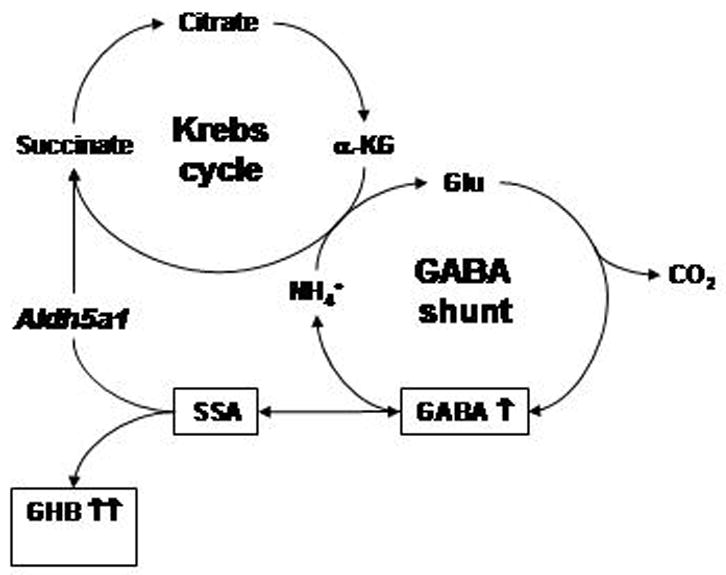
Interactions of the Krebs cycle and GABA shunt in central nervous system. The site of the block in patients with SSADH deficiency (and Aldh5a1−/− mice) is depicted by the italicized enzyme name Aldh5a1. Abbreviations employed: α-KG, α-ketoglutarate; glu, glutamate; GHB, γ-hydroxybutyrate; GABA, γ-aminobutyrate; SSA, succinate semialdehyde. Increased intermediates detected in Aldh5a1−/− mice and SSADH-deficient patients are shown with upward-oriented arrows.
The absence of effective therapies, coupled to inadequate insights into underlying pathophysiology, led Hogema and colleagues [7] to develop a knockout model for this disorder (Aldh5a1−/− mice). These animals are born at the expected Mendelian frequencies (~25%), fail to gain measurable weight, transition from absence seizures at ~ 2 weeks of life to generalized tonic-clonic convulsion at 3–4 weeks of life and eventual lethal status-epilepticus thereafter [8–10]. A variety of metabolic disturbances have been detected in Aldh5a1−/− mice in both physiological fluids and tissue extracts. These include significant changes in GABA, GHB, homocarnosine (the GABA-histidine dipeptide), succinate semialdehyde, 4,5-dihydroxyhexanoate, D-2-hydroxyglutarate, guanidinoacetate, guanidinobutyrate, glutamine, neuroactive steroids, monamines and others [11–17]. Alterations in GABAB- and GABAA-receptors levels and isoforms, in the presence of unchanged glutamatergic transmission, suggest that imbalanced inhibitory/excitatory neurotransmission may underlie the mechanism of seizure transition [9, 10]. Early lethality in Aldh5a1−/− mice afforded the opportunity to examine new treatment modalities, with preliminary studies revealing that antagonists of both the GHB- and GABAB-receptors, as well as application of the non-physiological amino acid taurine, led to significant lifespan extension for these mice [11].
Earlier studies from our laboratory utilized microarray gene expression studies in an attempt to identify novel pharmacotherapeutic targets for Aldh5a1−/− mice [1]. Unexpectedly, those investigations led to the discovery of significant alterations in myelin-associated genes in the hippocampus and cortex of these animals. To further dissect these myelin abnormalities, we have performed a comprehensive examination of brain phospholipid mass and composition in Aldh5a1−/− and Aldh5a1+/+ mice, accompanied by analysis of individual phospholipid fatty acid composition. Hexose-ceramides, (e.g., glucosyl-and galactosyleceramides, markers of myelin integrity) were also quantified in the same tissues. Our data suggest that fatty acid anomalies in glycerophospholipid fractions may play a pathophysiological role in this disorder.
METHODS
Animals
Age- and sex-matched wild-type (Aldh5a1+/+) and gene-ablated mice (Aldh5a1−/−) on the C57Bl background (age 17–19 days) were used in all experiments. Both groups of animals were maintained on normal mouse chow. Aldh5a1+/+ and Aldh5a1−/− mice were derived by heterozygote littermate intercrosses. Animals were euthanized by carbon dioxide inhalation and cervical dislocation according to the guidelines "Public Health Service Policy on Humane Care and Use of Laboratory Animals" approved by the IACUC of Oregon Health & Science University (protocol #A-773). Whole intact brains were rapidly excised from the skull and point frozen in dry-ice/liquid nitrogen with long-term storage at −80°C. Brain lipids were extracted quantitatively from pulverized frozen whole brain with hexane-2-propanol (3:2, vol/vol) [21]. For the majority of studies, 5–7 animals each were utilized for analyses, with the exception of hexose ceramide studies which employed n=4 animals for each genotype.
Thin layer chromatography
Individual phospholipid classes and neutral lipids were separated by thin layer chromatography. Whatman silica gel-60 plates (20 × 20 cm, 250 μm) were heat-activated at 110°C for 1 hour and samples streaked onto plates. Phospholipids were separated using chloroform:methanol:acetic acid:water (55:37.5:3:2 by volume [18]. Lipid fractions were identified using authentic standards (Doosan-Serday, Englewood Cliffs, NJ and NuChek Prep, Elysian, MN). Phospholipid mass was determined by assaying for lipid phosphorus content of individual separated lipid classes separated [19]. Neutral lipids were separated in petroleum ether:diethyl ether:acetic acid (75:25:1.3 by vol) [20]. Cholesterol was assayed using an iron binding assay after separation by TLC as described previously [21].
Fatty acid analysis
The ethanolamine glycerophospholipids (EtnGpl), choline glycerophospholipids (ChoGpl), phosphatidylinositol (PtdIns) and phosphatidylserine (PtdSer) fractions were separated by high performance liquid chromatography [22]. Each fraction was subjected to base-catalyzed transesterification, converting the phospholipid acyl chains to fatty acid methyl esters (FAME). To each fraction, 2 mL of 0.5 M KOH dissolved in anhydrous methanol were added [23]. FAME were extracted from the methanol using 2 mL of n-hexane and the n-hexane phase containing the FAME was removed. The lower phase was re-extracted two more times with 3 mL of n-hexane and these washes were combined with the original aliquot.
Individual fatty acids were separated by gas liquid chromatography (GLC) and quantified using flame ionization detection using an SP-2330 column (0.32 mm ID × 30 m length) and a Trace GLC (ThermoElectron, Austin, TX) equipped with dual autosamplers and dual flame ionization detectors (FID). For each fatty acid, peak areas were converted to moles using a standard curve from commercially purchased standards (NuChek Prep, Elysian, MN) and 17:0 as the internal standard.
Hexose-Ceramide Determinations
Tandem mass spectrometry, using multiple reaction monitoring with isotope dilution, was employed for determination of glycosphingolipids, which included sulphatides as well as galactosylceramide and glucosylceramide. The isoforms of hexose ceramide (glucosyl- and galactosylceramide are not differentiated) and sphingomyelin were quantified, and the ratio (hexose-ceramide/sphingomyelin) determined to correct for individual variation. Complete methodological details have been previously reported [24–26].
Statistics
Statistical analysis was performed using Instat 2 from GraphPad (San Diego, CA). Statistical significance was assessed using two-way, unpaired Student’s t-test, with p<0.05 considered significant.
RESULTS
Brain Phospholipid Mass and Composition
The total phospholipid mass was not altered in Aldh5a1−/− mice; however, EtnGpl mass was decreased 20% in these animals (Table 1). This result is consistent with the 30 % decrease in ethanolamine plasmalogen mass previously reported [1]. Thus, Aldh5a1gene ablation in the mouse affected only EtnGpl, and more specifically the ethanolamine plasmalogen subclass.
Table 1.
Brain phospholipid mass in Aldh5a1+/+ and Aldh5a1−/− mice
| Aldh5a1+/+ | Aldh5a1−/− | Aldh5a1+/+ | Aldh5a1−/− | |||||
|---|---|---|---|---|---|---|---|---|
| nmol/g ww | mole% | |||||||
| Mean | SD | Mean | SD | Mean | SD | Mean | SD | |
| Ptd2Gro | 1051 | 142 | 922 | 332 | 2.3 | 0.3 | 2.0 | 0.5 |
| PtdGro | 959 | 175 | 899 | 260 | 2.1 | 0.5 | 2.0 | 0.5 |
| PtdOH | 464 | 128 | 554 | 249 | 0.9 | 0.2 | 1.2 | 0.4 |
| EtnGpl | 11852 | 1025 | 9539 | 1587* | 24.1 | 1.5 | 21.6 | 2.1* |
| PtdIns | 2228 | 217 | 1952 | 402 | 4.7 | 0.5 | 4.4 | 0.4 |
| PtdSer | 4207 | 852 | 4134 | 1155 | 8.6 | 1.5 | 9.2 | 1.1 |
| ChoGpl | 23126 | 2004 | 21883 | 3447 | 48.3 | 2.0 | 49.5 | 2.3 |
| CerPCho | 4357 | 863 | 4482 | 1126 | 9.0 | 1.9 | 10.0 | 1.0 |
| Total | 48244 | 3559 | 44366 | 7986 | ||||
Values are expressed as mole percentage and represent mean ± SD, n = 5–7.
Abbreviations: Ptd2Gro: cardiolipin; PtdGro: phosphatidylglycerol; PtdOH: phosphatidic acid; EtnGpl: ethanolamine glycerophospholipids; PtdIns: phosphatidylinositol; PtdSer: phosphatidylserine; ChoGpl: choline glycerophospholipid; CerPCho: sphingomyelin.
The * indicates a significant difference between groups, p<0.05.
Brain Individual Phospholipid Fatty Acid Composition
The fatty acid composition of the four main brain phospholipids, EtnGpl, choline glycerophospholipid (ChoGpl), phosphatidylserine (PtdSer) and phosphatidylinositol (PtdIns), was analyzed (Tables 2–5). In EtnGpl, the proportion of 18:0 was increased 1.05-fold, while proportions of 20:1n-9 and 22:4n-6 were decreased 37% and 10%, respectively. Although the total n-3 and n-6 fatty acid contents were not statistically different, the n-3 to n-6 ratio was increased 1.1-fold. In ChoGpl, proportions of 22:6n-3 were increased 1.2-fold in Aldh5a1−/− mice, accounting for a significant increase in the n-3 to n-6. In PtdIns, the proportion of 20:4n-6 was decreased 15% affecting the n-3 to n-6 ratio which was increased 1.7-fold, indicating a net increase in n-3 fatty acids relative to n-6. In PtdSer, proportions of 18:1n-9 and 20:1n-9 decreased 20% and 37% respectively, while the proportion of 22:6n-3 was increased 1.1-fold. The increase in n-3 fatty acids was accompanied by decreased n-6 fatty acids, thereby affecting the n-3 to n-6 ratio.
Table 2.
Fatty acid composition of brain ethanolamine glycerophospholipids from Aldh5a1+/+ and Aldh5a1−/− mice
| EtnGpl mole % | Aldh5a1+/+ | Aldh5a1−/− | ||
|---|---|---|---|---|
| FAME | Mean | SD | ||
| 16:0 | 8.6 | 0.9 | 8.5 | 1.1 |
| 18:0 | 26.1 | 0.8 | 27.4 | 0.3* |
| 18:1 n-9 | 8.4 | 1.2 | 7.6 | 0.4 |
| 18:1 n-7 | 1.7 | 0.2 | 1.5 | 0.0 |
| 18:2 n-6 | 0.7 | 0.1 | 0.8 | 0.2 |
| 20:1 n-9 | 0.8 | 0.3 | 0.5 | 0.05* |
| 20:3 n-6 | 0.7 | 0.2 | 0.6 | 0.1 |
| 20:4 n-6 | 23.4 | 0.6 | 22.9 | 0.4 |
| 22:4 n-6 | 5.9 | 0.3 | 5.3 | 0.2* |
| 22:6 n-3 | 23.7 | 1.0 | 25.0 | 1.0 |
| sat | 34.8 | 1.3 | 35.9 | 1.4 |
| unsat | 65.2 | 1.3 | 64.1 | 1.4 |
| MUFA | 10.9 | 1.6 | 9.6 | 0.4 |
| PUFA | 54.4 | 1.0 | 54.6 | 1.3 |
| n-3 | 23.7 | 1.0 | 25.0 | 1.0 |
| n-6 | 30.7 | 0.6 | 29.6 | 0.5 |
| n-3/n6 | 0.77 | 0.04 | 0.84 | 0.03* |
| unsat/sat | 1.88 | 0.10 | 1.79 | 0.11 |
| PUFA/MUFA | 5.13 | 0.90 | 5.71 | 0.28 |
| MUFA/sat | 0.31 | 0.06 | 0.27 | 0.02 |
| PUFA/sat | 1.57 | 0.06 | 1.52 | 0.09 |
| n=7 | n=5 | |||
Values are expressed as mole percentage and represent mean ± SD, n = 5–7. The * indicates a significant difference between groups, p<0.05. Abbreviations employed for Tables 2–6: FAME, fatty acid methyl esters; n-3, n-6, n-7, n-9, etc-refers to omega-3, omega-6, etc; sat, saturated; unsat, unsaturated; MUFA, monounsaturated fatty acids; PUFA, polyunsatured fatty acids; chol, cholesterol; PL, phospholipids
Table 5.
Fatty acid composition of brain phosphatidylserine from Aldh5a1+/+ and Aldh5a1−/− mice
| PtdSer mole % | Aldh5a1+/+ | Aldh5a1−/− | ||
|---|---|---|---|---|
| FAME | Mean | SD | ||
| 16:0 | 3.8 | 0.3 | 3.7 | 0.4 |
| 18:0 | 42.1 | 0.6 | 41.9 | 0.9 |
| 18:1 n-9 | 10.1 | 1.3 | 8.0 | 0.5* |
| 18:1 n-7 | 1.3 | 0.1 | 1.1 | 0.0 |
| 18:2 n-6 | 0.5 | 0.1 | 0.4 | 0.1 |
| 20:1 n-9 | 0.8 | 0.2 | 0.5 | 0.04* |
| 20:3 n-6 | 0.8 | 0.3 | 0.7 | 0.2 |
| 20:4 n-6 | 5.8 | 0.4 | 5.3 | 0.3 |
| 22:4 n-6 | 4.7 | 0.3 | 4.8 | 0.3 |
| 22:6 n-3 | 30.1 | 1.2 | 32.9 | 0.8* |
| sat | 46.0 | 0.6 | 45.6 | 1.0 |
| unsat | 54.0 | 0.6 | 54.4 | 1.0 |
| MUFA | 12.2 | 1.6 | 9.6 | 0.5* |
| PUFA | 41.8 | 1.4 | 44.8 | 0.7* |
| n-3 | 30.1 | 1.2 | 32.9 | 0.8* |
| n-6 | 11.7 | 0.6 | 11.8 | 1.3 |
| n-3/n6 | 2.59 | 0.16 | 2.82 | 0.34 |
| unsat/sat | 1.18 | 0.03 | 1.19 | 0.05 |
| PUFA/MUFA | 3.49 | 0.64 | 4.65 | 0.22* |
| MUFA/sat | 0.27 | 0.04 | 0.21 | 0.01* |
| PUFA/sat | 0.91 | 0.03 | 0.98 | 0.04* |
Values are expressed as mole percentage and represent mean ± SD, n = 5–7. The * indicates a significant difference between groups, p<0.05.
Brain Neutral Lipid Mass
Because brain is highly enriched in cholesterol, the effects of Aldh5a1 deletion on brain cholesterol mass were determined (Table 6). Aldh5a1−/− mice did not have a significant change in brain cholesterol mass as compared to wild-type. Because neither the brain total phospholipid content nor the brain cholesterol content was change, there was no change in the cholesterol to phospholipid ratio.
Table 6.
Total brain cholesterol and phospholipid mass in Aldh5a1+/+and Aldh5a1−/−mice
| Aldh5a1+/+ | Aldh5a1+/+ | Aldh5a1−/− | Aldh5a1−/− | |
|---|---|---|---|---|
| nmol/gww | Mean | SD | Mean | SD |
| Chol | 23870 | 4024 | 20495 | 2844 |
| Total PL | 48244 | 3559 | 44366 | 7986 |
| Chol/PL ratio | 0.50 | 0.10 | 0.47 | 0.06 |
Values are expressed as mass (nmol/g ww) and represent mean ± SD, n = 5–7. The * indicates a significant difference between groups, p<0.05.
Brain Glycosphingolipids
Glucosyl- and galactosylceramides (e.g., hexose-ceramides) are major components of myelin in both grey and white matter. Accordingly, these were quantified in extracts of brains derived from Aldh5a1−/− and Aldh5a1+/+ mice (Fig. 2). The ratio of hexose-ceramide to sphingomyelin was employed to correct for variations between individual animals (n=4 animals each genotype: Aldh5a1+/+, 17.9 ± 4.2; Aldh5a1−/−, 10.5 ± 6.0; unpaired one-tailed t-test, p=0.0449). Although we predicted a decrease, ganglioside analysis in the same brain fractions did not reveal significant alterations between genotypes (data not shown).
Fig. 2.
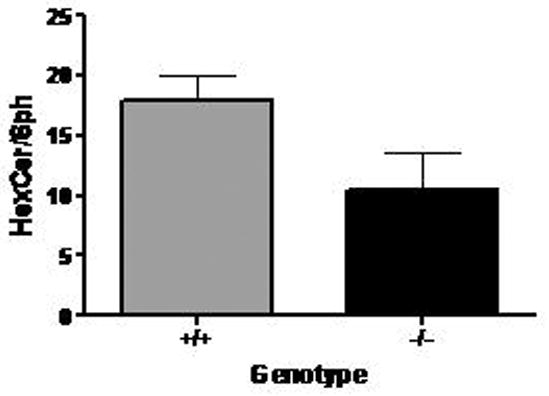
Ratio of hexose-ceramide (including glucosyl- and galactosylceramide) to sphingomyelin in brain tissue derived from wild-type (Aldh5a1+/+) and mutant (Aldh5a1−/−) mice as determined by electrospray tandem mass spectrometry. For each genotype, n=4 animals. See methods for details of quantitation.
DISCUSSION
In the current study, we observed a significant decrease in ethanolamine glycerophospholipid mass that was consistent with the 30 % decrease in ethanolamine plasmalogen reported by Donarum and coworkers [1]. The data of Table I indicate that the loss of Aldh5a1 activity in the mouse affected only the ethanolamine glycerophospholipid fraction of brain, and more specifically the ethanolamine plasmalogen subclass. Ethanolamine plasmalogen is a major constituent of myelin, and certain species of this plasmalogen are unique to the myelin sheath [27]. Isolated decreases in ethanolamine plasmalogen fractions have been detected in other mouse models and human disorders. Ethanolamine plasmalogen was significantly decreased in brain and spinal cord derived from the Quaking mouse, as well as brain derived from the Jimpy mouse [27]. The Quaking mouse has been extensively studied in relation to its neurological phenotype, characterized as severe tremor of voluntary movements with onset at ~ day of life 10. In this animal, an 1 Mb deletion in the qk gene leads to significant oligodendrocyte alterations and CNS dysmyelination [28]. The Jimpy mouse harbors an X-linked mutation in proteolipid protein (PLP) which results in severe CNS dysmyelination affecting glial and neural populations [29]. PLP is a key protein required for maintenance of the multilamellar myelin sheath structure and axonal integrity [1], and its decreased expression in Aldh5a1−/− brain was demonstrated by both microarray and quantitative RTPCR [1]; Western blotting of PLP is in progress to support these initial findings. These observations suggest that myelin abnormalities occurring in the Aldh5a1−/− brain may best be characterized as dysmyelination, although to date there has been no convincing evidence for dysmyelination in patients with SSADH (Aldh5a1) deficiency.
Abnormalities of ethanolamine glycerophospholipids have been observed in human neurological disorders and induced-states in rodents. Decreased ethanolamine glycerophosphatides are detected in gray matter and frontal lobe myelin obtained post-mortem from a 57 year-old patient with Refsum’s disease [30]. In white matter myelin derived from 13/17 patients with multiple sclerosis (MS), the ratio of different molecular species of enthanolamine plasmalogen was comparable to control values but was significantly altered in the remaining 4 MS cases and in samples derived from a patient with subacute sclerosing panencephalitis [31]. Sun and coworkers [32] demonstrated adaptive increases in ethanolamine plasmalogen synthesis in synaptosomes derived from rats treated chronically with ethanol. Conversely, Bichenkov and Ellingson [33] demonstated that ethanolamine plasmalogen synthesis in the CG-4 oligodendrocyte cell line could be both up- and down-regulated dependent upon the developmental time period of acute ethanol exposure. Since ethanol and GHB have many similar pharmacological properties (and synergistic capabilities) [34], it is interesting to speculate that the ethanolamine plasmalogen abnormalities detected in Aldh5a1−/− mice correlate with chronic GHB exposure in the CNS, which is a testable hypothesis in rodent model systems treated chronically with GHB.
Galactosylceramide (hexose-ceramide; galactosecerebroside) represents the major sphingolipid of the myelin membrane [35, 36]. In the current study, galactosylceramide was notably lower in Aldh5a1−/− mice in comparison to wild-type littermates. Quantitation of galactosylceramide is generally considered a sensitive marker for myelin destruction [37]. The ratio of hexose-ceramide to sphingomyelin represents a reliable indicator of whether the hexose-ceramide is actually lower in a particular study group. In our investigation, sphingomyelin was employed as an indicator of overall cellular glycolipid content in lieu of going through more sophisticated assays for absolute galactosylceramide quantitation. It is important to note that sphingomyelin mass was not altered in these mice (Table I). Vanier [38] noted a severe loss of galactosylceramide in Niemann-Pick type C patients exhibiting the severe or late-infantile forms of the disease. Similarly, Hara and Taketomi [39] analyzed cerebral lipids in an infant male with Menkes’ disease, noting a significant decrease in galactosylceramide in myelin sheath associated with defective copper metabolism. Mice unable to produce galactosylceramide exhibit thin, unstable myelin which often leads to progressive demyelination and significant motor coordination defects [35, 40, 41]. For example, in the twitcher mouse (a model of globoid cell leukodystrophy) there is a reduction of C24:1 and C24:1 hydroxylated galactosylceramide species, associated with the acute demylination in this animal model [40]. We hypothesize that the reduced galactosylceramide detected in our studies (Fig. 2) correlates with the reduced myelin sheath thickness quantified in cortical sections of Aldh5a1−/− mice [1].
To extend our findings of decreased ethanolamine glycerophospholipid level in the brain of Aldh5a1−/− mice, we subjected each of the individual phospholipid fractions to exhaustive fatty acid analyses (Tables 2–5). There were significant differences for Aldh5a1−/− mice in comparison to wild-type littermates for a variety of fatty acids; however, the most consistent results were increased n-3 (omega-3) fatty acids, principally 22:6 n-3 (docosahexaenoic acid; DHA). We predict that the alterations detected in omega-3 fatty acids and plasmalogens in the Aldh5a1−/− mice can be tracked to the endoplasmic reticulum and specific alterations in selected desaturase enzymes, a hypothesis that is currently under investigation in the laboratory. The phosphatidylserine fraction derived from Aldh5a1−/− mice showed a significant decrease in monounsaturated fatty acids coupled with a corresponding increased in polyunsaturated fatty acids (Table 5). The resultant ratios of unsaturated to saturated fatty acids were also altered. Similar alterations in unsaturated fatty acids have been detected in cerebral myelin and synaptosomes from phenylketonuric brain and hyperphenylalaninemic chick embryos [42, 43], as well as in cerebral lipids derived from an infantile case of Menkes’ disease [39]; however, it is likely that the mechanisms leading to unsaturated fatty acid anomalies in these disorders are quite different from those in the Aldh5a1 animal model..
Correlation of clinical and biochemical features between Aldh5a1 deficient patients and knockout mice remains challenging. Both patients and mice manifest a neurological phenotype (ataxia in mice and patients, hypotonia and retardation in patients), but a vexing issue is the occurrence of seizures, which is uniform in the mouse model yet only ~ 50% prevalent in human patients. Neuroimaging in patients indicates signal abnormalities in deep grey matter structures (basal ganglia), yet myelin anomalies would indicate white matter alterations. With regard to plasmalogen abnormalities in Aldh5a1−/− mice, it is of interest that the white matter pool of plasmalogens turns over much more slowly than pools associated with grey matter, suggesting that grey matter pools have a signaling role. The processes at play in Aldh5a1 deficiency, however, may have quite different etiologies while simultaneously contributing to the phenotype. For example, increased signal intensity in the basal ganglia may derive from chronic oxidative damage, and recent data has shown that GHB ellicits oxidant stress [44]. GABA is key to the distribution of myelin sheaths in early development [1], and almost certainly plays a role (with GHB) in alterations of inhibitory neurotransmission that have been detected in Aldh5a1−/− mice that underlie the genesis of seizures [9, 10]. Accordingly, the alterations we have seen in myelin (and likely fatty acid profiles) are almost certainly a secondary phenomenon related to primary accumulation of GHB and GABA in brain.
One limitation in the current investigation is that our analyses were focused on a single developmental time point (17–19 days of life), a period of rapid myelination in certain regions of the CNS [1]. Further studies assessing myelin and lipid structures in younger Aldh5a1−/− mice, as well as those who have survived the early-onset seizure activity associated with this disorder, are planned. These studies are currently in progress.
Table 3.
Fatty acid composition of brain choline glycerophospholipids from Aldh5a1+/+ and Aldh5a1−/− mice
| ChoGpl mole % | Aldh5a1+/+ | Aldh5a1−/− | ||
|---|---|---|---|---|
| FAME | Mean | SD | ||
| 16:0 | 51.2 | 1.3 | 51.5 | 0.7 |
| 16:1 | 0.9 | 0.1 | 0.9 | 0.1 |
| 18:0 | 10.7 | 0.5 | 10.6 | 0.3 |
| 18:1 n-9 | 17.1 | 0.2 | 16.7 | 0.1* |
| 18:1 n-7 | 5.1 | 0.2 | 5.0 | 0.1 |
| 18:2 n-6 | 1.3 | 0.5 | 1.2 | 0.1 |
| 20:1 n-9 | 0.6 | 0.1 | 0.6 | 0.1 |
| 20:3 n-6 | 0.4 | 0.0 | 0.5 | 0.1* |
| 20:4 n-6 | 9.0 | 0.6 | 8.5 | 0.3 |
| 22:4 n-6 | 0.6 | 0.1 | 0.7 | 0.1 |
| 22:6 n-3 | 3.3 | 0.4 | 3.9 | 0.3* |
| sat | 61.9 | 1.0 | 62.1 | 0.6 |
| unsat | 38.1 | 1.0 | 37.9 | 0.6 |
| MUFA | 23.6 | 0.3 | 23.2 | 0.1 |
| PUFA | 14.4 | 1.0 | 14.6 | 0.4 |
| n-3 | 3.3 | 0.4 | 3.9 | 0.3* |
| n-6 | 11.1 | 0.9 | 10.8 | 0.2 |
| n-3/n6 | 0.30 | 0.05 | 0.36 | 0.03* |
| unsat/sat | 0.62 | 0.03 | 0.61 | 0.01 |
| PUFA/MUFA | 0.61 | 0.05 | 0.63 | 0.02 |
| MUFA/sat | 0.38 | 0.01 | 0.37 | 0.01 |
| PUFA/sat | 0.23 | 0.02 | 0.24 | 0.01 |
Values are expressed as mole percentage and represent mean ± SD, n = 5–7. The * indicates a significant difference between groups, p<0.05.
Table 4.
Fatty acid composition of brain phosphatidylinositol from Aldh5a1+/+ and Aldh5a1−/− mice
| PtdIns mole % | Aldh5a1+/+ | Aldh5a1−/− | ||
|---|---|---|---|---|
| FAME | Mean | SD | ||
| 16:0 | 12.2 | 1.7 | 13.9 | 2.8 |
| 18:0 | 37.5 | 1.4 | 37.9 | 4.1 |
| 18:1 n-9 | 6.2 | 0.5 | 6.0 | 0.2 |
| 18:1 n-7 | 2.9 | 0.5 | 2.5 | 0.4 |
| 20:4 n-6 | 34.9 | 2.2 | 29.5 | 4.0* |
| 22:4 n-6 | 1.9 | 0.6 | 2.1 | 0.7 |
| 22:6 n-3 | 3.4 | 0.8 | 4.2 | 0.5 |
| sat | 49.7 | 1.5 | 51.9 | 4.7 |
| unsat | 50.3 | 1.5 | 48.1 | 4.7 |
| MUFA | 10.2 | 2.5 | 8.6 | 0.6 |
| PUFA | 40.2 | 3.1 | 37.9 | 5.2 |
| n-3 | 3.4 | 0.8 | 4.8 | 1.2 |
| n-6 | 36.8 | 2.7 | 31.7 | 4.2* |
| n-3/n6 | 0.09 | 0.02 | 0.15 | 0.04* |
| unsat/sat | 1.01 | 0.06 | 0.94 | 0.16 |
| PUFA/MUFA | 4.15 | 0.96 | 4.58 | 0.64 |
| MUFA/sat | 0.20 | 0.05 | 0.20 | 0.08 |
| PUFA/sat | 0.81 | 0.08 | 0.74 | 0.15 |
Values are expressed as mole percentage and represent mean ± SD, n = 5–7. The * indicates a significant difference between groups, p<0.05.
Acknowledgments
The authors are indebted to Carole L. Haselton for excellent technical assistance in lipid analyses. Supported in part by NIH NS 40270 (KMG) and IP20-RR17699-01 (EJM).
Footnotes
Publisher's Disclaimer: This is a PDF file of an unedited manuscript that has been accepted for publication. As a service to our customers we are providing this early version of the manuscript. The manuscript will undergo copyediting, typesetting, and review of the resulting proof before it is published in its final citable form. Please note that during the production process errors may be discovered which could affect the content, and all legal disclaimers that apply to the journal pertain.
References
- 1.Donarum EA, Stephan DA, Larkin K, Murphy EJ, Gupta M, Senephansiri H, Switzer RC, Pearl PL, Snead OC, Jakobs C, Gibson KM. Expression profiling reveals multiple myelin alterations in murine succinate semialdehyde dehydrogenase deficiency. J Inher Metab Dis. 2006;29:143–156. doi: 10.1007/s10545-006-0247-6. [DOI] [PubMed] [Google Scholar]
- 2.Gibson KM, Jakobs C, Pearl PL, Snead OC. Murine succinate semialdehyde dehydrogenase (SSADH) deficiency, a heritable disorder of GABA metabolism with epileptic phenotype. IUBMB Life. 2006a;57:639–644. doi: 10.1080/15216540500264588. [DOI] [PubMed] [Google Scholar]
- 3.Gibson KM, Jakobs C. Disorders of beta- and gamma- amino acids in free and peptide-linked forms. In: Scriver CR, Beaudet AL, Sly WS, Valle D, editors. The Metabolic and Molecular Bases of Inherited Disease. 8. McGraw-Hill Publishing Company; 2001. pp. 2079–2105. Chapter 91. [Google Scholar]
- 4.Pearl PL, Capp PK, Novotny EJ, Gibson KM. Inherited disorders of neurotransmitters in children and adults. Clin Biochem. 2005;38:1051–1058. doi: 10.1016/j.clinbiochem.2005.09.012. [DOI] [PubMed] [Google Scholar]
- 5.Gibson KM, Hoffmann GF, Hodson AK, Bottiglieri T, Jakobs C. 4-Hydroxybutyric acid and the clinical phenotype of succinic semialdehyde dehydrogenase deficiency, an inborn error of GABA metabolism. Neuropediatrics. 1998;29:14–22. doi: 10.1055/s-2007-973527. [DOI] [PubMed] [Google Scholar]
- 6.Gibson KM, Jakobs C, Ogier H, Hagenfeldt L, Eeg-Olofsson KE, Eeg-Olofsson O, Aksu F, Weber HP, Rossier E, Vollmer B, Lehnert W. Vigabatrin therapy in six patients with succinic semialdehyde dehydrogenase deficiency. J Inher Metab Dis. 1995;18:143–146. doi: 10.1007/BF00711750. [DOI] [PubMed] [Google Scholar]
- 7.Hogema BM, Gupta M, Senephansiri H, Burlingame TG, Taylor M, Jakobs C, Schutgens RB, Froestl W, Snead OC, Diaz-Arrastia R, Bottiglieri T, Grompe M, Gibson KM. Pharmacologic rescue of lethal seizures in mice deficient in succinate semialdehyde dehydrogenase. Nature Genet. 2001;29:212–216. doi: 10.1038/ng727. [DOI] [PubMed] [Google Scholar]
- 8.Cortez MA, Wu Y, Gibson KM, Snead OC. Absence seizures in succinic semialdehyde dehydrogenase deficient mice: a model of juvenile absence epilepsy. Pharmacol Biochem Behav. 2004;79:547–553. doi: 10.1016/j.pbb.2004.09.008. [DOI] [PubMed] [Google Scholar]
- 9.Buzzi A, Wu Y, Frantseva MV, Perez Velazquez JL, Cortez MA, Liu CC, Shen LQ, Gibson KM, Snead OC. Succinic semialdehyde dehydrogenase deficiency: GABA(B) receptor-mediated function. Brain Res. 2006;1090:15–22. doi: 10.1016/j.brainres.2006.02.131. [DOI] [PubMed] [Google Scholar]
- 10.Wu Y, Buzzi A, Frantseva M, Velazquez JP, Cortez M, Liu CC, Shen L, Gibson KM, Snead OC. Status epilepticus in mice deficient for succinate semialdehyde dehydrogenase: GABAA receptor-mediated mechanisms. Ann Neurol. 2006;59:42–52. doi: 10.1002/ana.20686. [DOI] [PubMed] [Google Scholar]
- 11.Gupta M, Greven R, Jansen EE, Jakobs C, Hogema BM, Froestl W, Snead OC, Bartels H, Grompe M, Gibson KM. Therapeutic intervention in mice deficient for succinate semialdehyde dehydrogenase (Gamma-hydroxybutyric aciduria) J Pharmacol Exper Therap. 2002;302:180–187. doi: 10.1124/jpet.302.1.180. [DOI] [PubMed] [Google Scholar]
- 12.Gupta M, Hogema BM, Grompe M, Bottiglieri TG, Concas A, Biggio G, Sogliano C, Rigamonti AE, Pearl PL, Snead OC, 3rd, Jakobs C, Gibson KM. Murine succinate semialdehyde dehydrogenase deficiency. Ann Neurol. 2003;54:S81–90. doi: 10.1002/ana.10625. [DOI] [PubMed] [Google Scholar]
- 13.Gupta M, Polinsky M, Senephansiri H, Snead OC, Jansen EEW, Jakobs C, Gibson KM. Seizure evolution and amino acid imbalances in murine succinate semialdehyde dehydrogenase (SSADH) deficiency. Neurobiol Dis. 2004;16:556–562. doi: 10.1016/j.nbd.2004.04.008. [DOI] [PubMed] [Google Scholar]
- 14.Gibson KM, Gupta M, Senephansiri H, Jansen EEW, Montine TJ, Hyland K, Switzer RC, Snead OC, Jakobs C. Oxidant stress and neurodegeneration in murine succinic semialdehyde dehydrogenase (SSADH) deficiency. In: Hoffmann GF, editor. Diseases of Neurotransmission-from bench to bed. Heilbronn: SPS Verlagsgesellschaft; 2006b. pp. 199–212. [Google Scholar]
- 15.Jansen EEW, Verhoeven NM, Jakobs C, Schulze A, Senephansiri H, Gupta M, Snead OC, Gibson KM. Increased guanidino species in murine and human succinate semialdehyde dehydrogenase (SSADH) deficiency. Biochim Biophys Acta. 2006;1762:494–498. doi: 10.1016/j.bbadis.2006.01.006. [DOI] [PubMed] [Google Scholar]
- 16.Gibson KM, Schor DSM, Gupta M, Guerand WS, Senephansiri H, Burlingame TG, Bartels H, Hogema BM, Bottiglieri T, Froestl W, Snead OC, Grompe M, Jakobs C. Focal neurotransmitter alterations in mice deficient for succinate semialdehyde dehydrogenase. J Neurochem. 2002;81:71–79. doi: 10.1046/j.1471-4159.2002.00784.x. [DOI] [PubMed] [Google Scholar]
- 17.Struys EA, Verhoeven NM, Jansen EEW, ten Brink HJ, Gupta M, Burlingame TG, Quang LS, Maher T, Rinaldo P, Snead OC, Goodwin AK, Weerts EM, Brown PR, Murphy TC, Picklo MJ, Jakobs C, Gibson KM. Metabolism of γ-hydroxybutyrate to D-2-hydroxyglutarate in mammals: further evidence for D-2-hydroxyglutarate transhydrogenase. Metabolism Clin Exper. 2006;55:353–358. doi: 10.1016/j.metabol.2005.09.009. [DOI] [PubMed] [Google Scholar]
- 18.Jolly CA, Hubbell T, Behnke WD, Schroeder F. Fatty acid binding protein: stimulation of microsomal phosphatidic acid formation. Arch Biochem Biophys. 1997;341:112–121. doi: 10.1006/abbi.1997.9957. [DOI] [PubMed] [Google Scholar]
- 19.Rouser G, Siakotos A, Fleischer S. Quantitative analysis of phospholipids by thin layer chromatography and phosphorus analysis of spots. Lipids. 1969;1:85–86. doi: 10.1007/BF02668129. [DOI] [PubMed] [Google Scholar]
- 20.Marcheselli VL, Scott BL, Reddy TS, Bazan NG. Quantitative analysis of acyl group composition of brain phospholipids, neutral lipids, and free fatty acids. In: Boulton AA, Baker GB, Horrocks LA, editors. Neuromethods 7 Lipids and Related Compounds. Humana Press; Clifton, NJ: 1988. pp. 83–110. [Google Scholar]
- 21.Hara A, Radin NS. Lipid extraction of tissues with a low-toxicity solvent. Anal Biochem. 1978;90:420–426. doi: 10.1016/0003-2697(78)90046-5. [DOI] [PubMed] [Google Scholar]
- 22.Dugan LL, Demediuk P, Pendley CE, II, Horrocks LA. Separation of phospholipids by high pressure liquid chromatography: all major classes including ethanolamine and choline plasmalogens, and most minor classes, including lysophosphatidylethanolamine. J Chromatogr. 1986;378:317–327. doi: 10.1016/s0378-4347(00)80728-8. [DOI] [PubMed] [Google Scholar]
- 23.Brockerhoff H. Determination of the positional distribution of fatty acids in glycerolipids. Methods Enzymol. 1975;35:315–325. doi: 10.1016/0076-6879(75)35171-9. [DOI] [PubMed] [Google Scholar]
- 24.Mills K, Johnson A, Winchester B. Synthesis of novel internal standards for the quantitative determination of plasma ceramide trihexoside in Fabry disease by tandem mass spectrometry. FEBS Lett. 2002;515:171–176. doi: 10.1016/s0014-5793(02)02491-2. [DOI] [PubMed] [Google Scholar]
- 25.Mills K, Vellodi A, Morris P, Cooper D, Morris M, Young E, Winchester B. Monitoring the clinical and biochemical response to enzyme replacement therapy in three children with Fabry disease. Eur J Pediatr. 2004;163:595–603. doi: 10.1007/s00431-004-1484-z. [DOI] [PubMed] [Google Scholar]
- 26.Mills K, Morris P, Lee P, Vellodi A, Waldek S, Young E, Winchester B. Measurment of urinary CDH and CTH by tandem mass spectrometry in patients hemizygous and heterozygous for Fabry disease. J Inherit Metab Dis. 2005;28:35–48. doi: 10.1007/s10545-005-5263-4. [DOI] [PubMed] [Google Scholar]
- 27.Hack MH, Helmy FM. The diminution of the myelin ethanolamine plasmalogen in brain of the Jimpy mouse and brain and spinal cord of the Quaking mouse as visualized by thin-layer chromatography. J Chromatogr. 1978;145:307–310. doi: 10.1016/s0378-4347(00)81353-5. [DOI] [PubMed] [Google Scholar]
- 28.Lorenzetti D, Bishop CE, Justice MJ. Deletion of the Parkin coregulated gene causes sterility in the quakingviable mouse mutant. Proc Natl Acad Sci. 101:8402–8407. doi: 10.1073/pnas.0401832101. [DOI] [PMC free article] [PubMed] [Google Scholar]
- 29.Harsan L, Jalabi W, Grucker D, Ghandour MS. New insights on neuronal alterations in Jimpy mutant brain. Neurochem Res. 2004;29:943–952. doi: 10.1023/b:nere.0000021238.00299.93. [DOI] [PubMed] [Google Scholar]
- 30.MacBrinn MC. O’Brien JS (1968) Lipid composition of the nervous system in Refsum’s disease. J Lipid Res. 2004;9:552–561. [PubMed] [Google Scholar]
- 31.Boggs JM, Stamp D, Moscarello MA. Comparison of two molecular species of ethanolamine plasmalogen in multiple sclerosis and normal myelin. Neurochem Res. 1982;7:953–964. doi: 10.1007/BF00965135. [DOI] [PubMed] [Google Scholar]
- 32.Sun GY, Huang HM, Chandrascekhar R, Lee DZ, Sun AY. Effects of chronic ethanol administration on rat brain phospholipids metabolism. J Neurochem. 1987;48:974–980. doi: 10.1111/j.1471-4159.1987.tb05612.x. [DOI] [PubMed] [Google Scholar]
- 33.Bichenkov E, Ellingson JS. Effects of transient ethanol exposure on the incorporation of [(3)H]ethanolamine into plasmalogen in the differentiating CG-4 oligodendrocyte cell line. Biochem Pharmacol. 2000;60:1703–1711. doi: 10.1016/s0006-2952(00)00473-1. [DOI] [PubMed] [Google Scholar]
- 34.Wong CG, Chan KF, Gibson KM, Snead OC. Gamma-hydroxybutyric acid: neurobiology and toxicology of a recreational drug. Toxicol Rev. 2004;23:3–20. doi: 10.2165/00139709-200423010-00002. [DOI] [PubMed] [Google Scholar]
- 35.Zoller I, Bussow H, Gieselmann V, Eckhardt M. Oligodendrocyte-specific ceramide galactosyltransferase (CGT) expression phenotypically rescues CGT-deficient mice and demonstrates that CGT activity does not limit brain galactosylceramide level. Glia. 2005;52:190–198. doi: 10.1002/glia.20230. [DOI] [PubMed] [Google Scholar]
- 36.Bradl M. Myelin dysfunction/degradation in the central nervous system: why are myelin sheaths susceptible to damage? J Neural Trans Suppl. 1999;55:9–17. doi: 10.1007/978-3-7091-6369-6_2. [DOI] [PubMed] [Google Scholar]
- 37.Thuillier Y, Lubetzki C, Goujet-Zalc C, Galli A, Lhermitte F, Zalc B. Immunological determination of galactosylceramide level in blood as a serum index of active demyelination. J Neurochem. 1988;51:380–384. doi: 10.1111/j.1471-4159.1988.tb01049.x. [DOI] [PubMed] [Google Scholar]
- 38.Vanier MT. Lipid changes in Niemann-Pick disease type C brain: personal experience and review of the literature. Neurochem Res. 1999;24:481–489. doi: 10.1023/a:1022575511354. [DOI] [PubMed] [Google Scholar]
- 39.Hara A, Taketomi T. Cerebral lipid and protein abnormalities in Menkes’ steely-hair disease. Jpn J Exp Med. 1986;56:277–284. [PubMed] [Google Scholar]
- 40.Esch SW, Williams TD, Biswas S, Chakrabarty A, Levine SM. Sphingolipid profile in the CNS of the twitcher (globoid cell leukodystrophy) mouse: a lipidomics approach. Cell Mol Biol. 2003;49:779–787. [PubMed] [Google Scholar]
- 41.Marcus J, Honigbaum S, Shroff S, Honke K, Rosenbluth J, Dupree JL. Sulfatide is essential for the maintenance of CNS myelin and axon structure. Glia. 2006;53:372–381. doi: 10.1002/glia.20292. [DOI] [PubMed] [Google Scholar]
- 42.Johnson RC, McKean CM, Shah SN. Fatty acid composition of lipids in cerebral myelin and synaptosomes in phenylketonuria and Down syndrome. Arch Neurol. 1977;34:288–294. doi: 10.1001/archneur.1977.00500170042008. [DOI] [PubMed] [Google Scholar]
- 43.Alejandre MJ, Marco C, Ramirez H, Segovia JL, Garcia-Peregrin E. Lipid composition of brain myelin from normal and hyperphenylalaninemic chick embryos. Comp Biochem Physiol B. 1984;77:329–332. doi: 10.1016/0305-0491(84)90338-9. [DOI] [PubMed] [Google Scholar]
- 44A.Sgaravatti M, Sgarbi MB, Testa CG, Durigon K, Pederzolli CD, Prestes CC, Wyse ATS, Wannmacher CMD, Wajner M, Dutra-Filho CS. Gamma-hydroxybutyric acid induces oxidative stress in cerebral cortex of young rats. Neurochem Intl. doi: 10.1016/j.neuint.2006.11.007. in press. [DOI] [PubMed] [Google Scholar]