

Abstract
Objective
To investigate the response decrements of visual evoked responses (VER) in newborns and assess the applicability of this paradigm to fetuses in magnetoencephalographic (MEG) recordings.
Methods
Twelve newborns with no known risks or complications participated at chronological ages between six and 22 days. They constituted the follow-up group to a prenatal study conducted on a sample of 25 fetuses whose gestational age (GA) varied between 29 and 37 weeks at the time of recording. Trains of four light flashes with an interstimulus interval of 2 s followed by 10 s without stimulation were delivered to record VER.
Results
Nine of the 12 newborns responded to the stimulation and showed response decrements in amplitude from the first to the last light flash. Furthermore, the response latency increased significantly from the first to the last stimulus. The remaining three recordings were discontinued early. Even though the prenatal visual evoked response rate was only 29%, the fetuses exhibited a response decrement after the first stimulus.
Conclusions
The amplitude of VERs can be used to elicit a response decrement in newborns and, with limitations, even in fetuses. This paradigm might be a useful tool for a direct non-invasive assessment of neonatal and prenatal brain development and CNS functioning.
Significance
The proposed method might be a first step towards an early detection of developmental deficits in newborns and fetuses.
Keywords: evoked responses, habituation, response decrement, fetus, prenatal development, newborn, neonatal development, magnetoencephalography
1. INTRODUCTION
The developing prenatal and neonatal brain is more vulnerable to physiological insult than the more mature brain of older subjects. Moreover, events in these early periods can negatively affect brain development and therefore lead to motor, sensory and cognitive disabilities. Hence, detecting brain impairment at very early stages could contribute to the prevention of subsequent developmental delays and the implementation of intervention methods. Habituation is one of the primary phenomena utilized to assess neurological integrity of the newborn and normal central nervous system (CNS) functioning (Leader et al., 1984; Madison et al., 1986). It is defined as the decrease of an elicited response as a result of repeated stimulation (Thompson and Spencer, 1966). Several ultrasound studies have shown fetuses to exhibit habituation (Madison et al., 1986; Kuhlman et al., 1988; Shalev et al., 1989; Smith et al., 1991; Groome et al., 1993; Van Heteren et al., 2001; Bellieni et al., 2005). Moreover, there is evidence that younger fetuses (below 28 weeks GA) habituate at a slower rate than those at advanced gestational ages (older than 32 weeks GA) (Kuhlman et al., 1988; Groome et al., 1993; Doherty and Hepper, 2000). However, some studies could not reproduce this gestational age dependency (Madison et al., 1986; Bellieni et al., 2005).
In the past, habituation paradigms performed with ultrasound have been used to differentiate also between high and low risk conditions in the fetus (Leader et al., 1982; Leader et al., 1988; Hepper and Shahidullah, 1992). Maternal conditions such as diabetes (Doherty and Hepper, 2000), depression (Allister et al., 2001) and stress (Sandman et al., 1995) have been shown to affect the fetal habituation in a negative way, indicating developmental delays which may be linked to impaired function of the cerebral cortex (Morokuma et al., 2004). Therefore, the prenatal detection of adverse habituation could be used as an indicator for the re-evaluation of maternal high-risk conditions. Regarding normal brain development, the degree of habituation has been shown to be a possible predictor of postpartum cognitive development (Madison et al., 1986; Gaultney et al., 2005).
Previous studies on prenatal habituation used mostly vibroacoustic (Leader et al., 1982; Madison et al., 1986; Smith et al., 1991; Groome et al., 1993; Kuhlman et al., 1988; Leader et al., 1982; Groome et al., 1994; Doherty and Hepper 2000; Van Heteren et al., 2001; Gaultney et al., 2005; Bellieni et al., 2005) or sound stimulation (Shalev et al., 1989; Hepper and Shahidullah, 1992) to elicit a response. The outcome measures were mainly fetal body movements (Madison et al., 1986; Groome et al., 1993; Doherty and Hepper 2000; Van Heteren et al., 2001) or blink-startle reflex (Bellieni et al., 2005) observed by ultrasound and/or heart rate acceleration (Smith et al., 1991; Goldkrand and Litvack, 1991). These measures are based on reflexes of the motor system, and are believed to indicate cortical stimulus perception (Hepper, 1995; Bellieni et al., 2005; Morokuma et al, 2004). However, all of these responses are indirect observations of brain responses, and have to be interpreted carefully since it is not clear whether the development of fetal motor skills influences these observations (Hepper et al., 1997). These studies used a long-term habituation paradigm in which the stimulus was presented repeatedly until response cessation. The number of stimuli leading to a termination of the response is called the habituation rate.
No previous study has investigated habituation in fetuses via direct detection of brain response. In adult electroencephalography (EEG) and MEG studies, habituation has been tested with a paradigm called short-term habituation (Rosburg et al., 2006; Vanhanen et al., 1996; Noguchi et al., 2004; Lasky et al., 1996). Lasky (1997) conducted this paradigm with auditory stimulation on newborns and adults. It differs from the above-mentioned long-term habituation as follows. First, the number of stimuli presented is fixed from the beginning, and therefore independent of the strength of an elicited response. Second, the interstimulus interval (ISI) is usually shorter. Third, in order to enforce dishabituation, the train of stimuli is followed by a longer break or a deviant stimulus. Hence, the criterion for the occurrence of habituation is the decrease in response latency and/or amplitude from the first to the second stimulus rather than cessation of the response. In case a paradigm does not fulfill all the criteria to distinguish habituation from receptor fatigue (Thompson and Spencer, 1966), it is more appropriate to call the phenomenon “response decrement” (Kuhlman et al., 1988). Nevertheless, studies using this paradigm on adults have shown its usefulness in the initiation of habituation in healthy adults (Amochaev et al., 1989; Lasky et al., 1996) as well as in the differentiation between cognitively impaired and normal subjects (Vanhanen et al., 1996).
Previous studies with a fetal magnetoencephalography (fMEG) system called SARA (SQUID Array for Reproductive Assessment, VSM Med Tech Ltd., Canada) have shown its capability to detect neonatal and fetal evoked brain responses elicited by visual and auditory stimulation (Eswaran et al., 2002; Lowery et al., 2006). Therefore, this device could add a new perspective on fetal habituation. It enables the direct observation of brain responses, their latencies, amplitudes and response patterns in normal and abnormal development.
This study is designed to investigate the usefulness of MEG technology for the application of a short-term habituation paradigm in newborns and fetuses to assess response decrement with visual stimulation. Since there are no known reports of response decrement of neonatal evoked responses to flash stimuli assessed with MEG technology, our first step was to evaluate the results of this visual paradigm on newborns before assessing its applicability to fetuses. In the next step, we investigated the application of this paradigm to the results from the same subjects during their fetal stage of life. The investigation on the fetuses was planned as an observational study.
Overall, this study might be the first step towards an improved assessment of human pre- and postnatal brain development, and therefore contribute to a more accurate detection of early developmental delays.
2. METHODS
2.1 Subjects and Methods
In order to investigate the newborns and further assess the applicability of the habituation paradigm on the fetuses, we recruited the subjects at the fetal stage of life and performed follow-up recordings after birth. The mothers were advised to bring the newborns for a follow-up study within three weeks after delivery. The study was approved by the local Institutional Review Board and each mother or their legal representative signed an informed consent form. Two mothers were under the age of 18, and their parents accordingly signed the informed consent on their behalf.
Twenty-five healthy pregnant women with fetuses ranging in GA from 29 to 37 completed weeks participated in the prenatal study. Fetal MEG measurements were conducted between one and three times per subject at different GA’s. Nine fetuses were recorded once, nine twice, and seven of them three times. The interval between studies on the same subject was at least two weeks, except for one subject who was recorded at a GA of 35 weeks and again at 36 weeks. In summary, 48 datasets were collected from 25 subjects.
Twelve of these mothers brought the babies back for a neonatal follow-up study. All of them were part of the antecedent fetal study described below. The newborn recordings were conducted between six and 22 days after delivery.
The stimulation paradigm was the same for the pre- and postnatal studies, except the duration of the recording was shorter in the follow-up. Although other existing stimulation paradigms for newborns could have been applied, we chose a specific paradigm that is applicable to fetuses as well. The paradigm consisted of a train of four light flashes (duration 500 ms) with an ISI of 2 s, followed by a 10 s break (Figure 1e). In the neonatal study, this sequence was repeated 60 times (three times per minute). This added up to a 20-minute recording with a total of 240 stimuli, or 60 for each of the four light flashes. For the prenatal study, the duration of the recording was increased to 30 minutes. This led to a total of 360 stimuli or 90 presentations of each one of the four light flashes.
Figure 1.
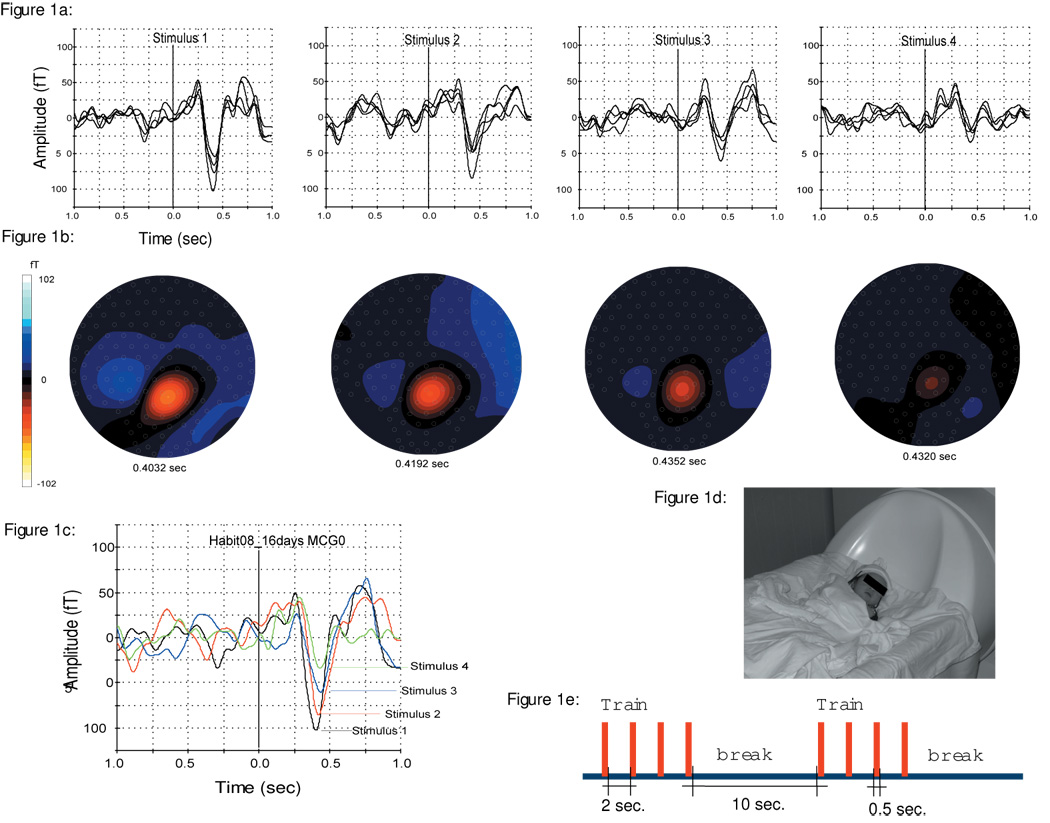
1a: Averaged evoked response (57 triggers) to each of the four stimuli on a 16 days (41 weeks GA) old newborn. An overlay of the selected channels over the head is shown.
1b: Illustration of the isofield map of the magnetic field corresponding to Figure 1a.
1c: Overlay of single channel responses (MCG0) for all four stimuli: Shows the relative decrease in response amplitudes from the first (−102.5 fT) to the fourth flash (−33.9 fT).
1d: Illustration of the Neonatal head position during the recording.
1e: The succession of stimuli in our study paradigm: Train of four sequential light flashes, followed by a break. The ISI within the train was 2 s and the intertrain ISI was 10 s. Stimulus duration was 0.5 s.
Stimulus presentation was controlled by software called STIMPRO (UAMS, Little Rock, AR). The light-stimulus system consisted of a 3.4 m fiber optic cable which terminated in a 3 × 5 cm woven panel (StockerYale, Salem). The input end of the cable was split into four sub-bundles illuminated by individual high-power LED arrays. A light output of 35 mW at 630 nm (red) was measured at the panel. No artifacts from the LEDs have been observed in our previous studies with the same light stimulus (McCubbin et al., 2007). The light source was located outside the magnetically shielded room (MSR) (Vacuumschmelze, Germany) in which the recording was performed.
For the prenatal study, the woven panel was placed on the surface of the maternal abdomen. The mother then leaned forward onto the sensor array, covering the flash from her own view. For the neonatal recording, the cable was fastened to the ceiling at a distance of at least 75 cm above the infant’s head.
2.2 Data acquisition and recording
The recording of the evoked responses was performed with the SARA system, which consists of an array of 151 primary magnetic sensors (Lowery et al., 2006). From a sitting position, the mother leans forward into the sensor array, which is shaped to fit the gravid abdomen. The sensors are arranged so that during the prenatal recordings, the maternal abdomen is covered from the pubic symphysis to the costal arch.
For the neonatal study, the mother’s seat was replaced by a cradle attachment that enables the newborn to lie with the head resting on the lower center of the sensor array. In this report, all babies were lying on their back and facing the light panel above their head. This position minimized the distance of the infant’s occipital lobe to the SQUID sensors. A marking system based on four localizing coils was used to indicate the location of the newborn’s head. The coils were fixed to a cap in order to facilitate study preparation and minimize disturbance of the infant. One of the coils was located at the baby’s forehead and the three reference coils marked the right, back and left side of the head. Before the recording was conducted, these coils were activated at a certain frequency to compute their location in relation to the MEG sensors. The infant’s mother or father was seated next to the cradle inside the shielded room, and the recording session was monitored by a camera. This allowed the investigator to note down the neonate’s state, movements and parental intervention in a qualitative way. The recording session was discontinued when the babies started to cry or if extensive movements occurred.
Prior to prenatal data collection, an ultrasound was performed in order to estimate fetal weight, size, position and level of activity. The subject was then taken to the MSR for the fMEG measurement. After seating the mother comfortably in front of the sensor array, a portable ultrasound exam was performed to determine fetal position so that the fiber optic light stimulus panel could be placed on the maternal abdomen directly over the fetal head. In most cases, the light stimulus was placed right above one or both of the fetal eyes. However, in some cases the eye was not visible from the maternal abdomen due to the fetal position, e.g. if the fetus was facing towards the mother’s back. If this was the case, the light was placed over the temporal lobe or the part of the head that was closest to the fetal eye. A notation was made of the orientation of the fetal head. Three localization coils were then attached around the maternal waist and one localization coil over the light panel. This marking system recorded the position of the mother and the fetal head in relation to the MEG sensors at the start and end of the fMEG measurement and allowed the location of the fetal head to be indicated in the dataset. Upon completion of the study, the ultrasound exam was repeated to determine if the fetal head position had changed during the recording.
In both studies, participants were instructed to sit as still as possible. In the neonatal recording, the mother or father was told to intervene only if the baby became agitated. For the prenatal study, the mother was told to communicate any discomforts immediately through the speaker system located in the MSR.
2.3 Data analysis
The magnetic field signals were recorded with a sampling rate of 312.5 Hz in continuous mode. After attenuation of the neonatal or the maternal and fetal heart signals by orthogonal projection (Vrba et al., 2004; McCubbin et al., 2006), respectively, the dataset was split into four separate trial classes based on the sequence number of the stimulus (first, second, third and fourth). Each segment had a window length of 1 s pre- and 1 s post stimulus interval. Automatic threshold detection was applied in order to mark trials containing artifacts (MEG amplitude single channel threshold 2 pT), which were excluded from further analysis. Averages for the different trial classes were computed. In order to identify an elicited brain response, the activity in the 1 s prestimulus interval was visually compared to the activity after stimulus onset. We considered a wave form as a cortical response, if all of the following conditions were met (1) the baseline activity was smooth, (2) a peak of at least 8 fT occurred between 150 ms and 600 ms after stimulus onset, and (3) no such peak was visible in the plus-minus average. This manual comparison between the conventional and the plus-minus averaging estimates the signal to noise ratio and thus the reliability of the signals. In addition, if a peak on one of the subsequent triggers appeared 100 ms earlier or later than the response to the first trigger; it was considered a different component and therefore disregarded.
The responses for each one of the four stimuli were determined separately as described below. Based on the response to the first light flash, six channels with the best signal to noise ratio were selected, and latency as well as peak amplitude of their signal was determined. In MEG data, those peaks can either be of positive or negative value. This polarity is based on the dipole pattern of magnetic fields and therefore cannot be interpreted by means of different positive or negative components. To quantify the peak amplitude, we calculated the root mean square (RMS) over all six channels at the peak latency. Based on the assumption that the evoked responses to each one of the four light flashes are elicited in the same brain region, the same channels were selected for all the triggers.
The raw amplitude is strongly affected by the distance between the head and the MEG sensors. To adjust for this, we analyzed neonatal amplitude data three ways: (1) For each recording session, Spearman’s coefficient of rank correlation between amplitude and flash number was calculated; for this, amplitudes below detection threshold were treated as left-censored at 8 fT. The distribution of the rank correlation coefficients across sessions was summarized as the median, quartiles, and range. A non-parametric 95% confidence limit on the median rank correlation was also calculated. (2) The raw amplitudes from each recording session were analyzed via mixed-models repeated-measures ANOVA. In order to minimize bias in this parametric procedure, amplitudes below detection threshold were treated as missing. ANOVA post-hoc testing was conducted via orthogonal polynomial contrasts (polynomial-contrast analysis) designed to decompose trends with flash number into linear versus non-linear (higher-order polynomial) components. (3) In each recording session, the amplitudes for second, third, and fourth flash were divided by the first-flash amplitude, and the resulting relative amplitudes were subjected to mixed-models analysis for calculation of repeated-measures-adjusted means and 95% confidence limits. Latencies from each recording session were also analyzed via mixed-models repeated-measures ANOVA, and also analyzed in post-hoc testing via polynomial-contrast analysis. For both amplitudes and latencies, covariance structures for the repeated measures were fit to the data using the Akaike Information Criterion. All statistical analyses were performed using SAS version 9 (The SAS Institute, Cary, NC).
3. RESULTS
A total of 12 neonatal measurements from 12 newborns and 48 fetal recordings from 25 subjects were conducted. Overall, nine recordings from nine neonates and 11 recordings from seven fetuses showed responses to, at least, the first light flash.
One of the 12 newborn datasets was excluded due to technical interference during the study. Two other newborn recordings were terminated before the halfway point because of infant crying and these datasets were also excluded. All of the nine remaining neonates responded to the light flash. The RMS values of the amplitudes, their rank correlations with flash number, and the latencies of the responses for the neonatal data are shown in Table 1.
Table 1.
Neonatal age (“Age”; in days), number of triggers (“Tri”) recorded, response amplitudes (“Amp”; RMS values in fT) with each numbered flash, Spearman’s rank correlations (“Rank Corr”) of amplitude with flash number, and latencies (“Lat”; in ms) with each numbered flash.
| Pat ID | Age | Tri | Amp 1st | Amp 2nd | Amp 3rd | Amp 4th | Rank Corr** | Lat 1st | Lat 2nd | Lat 3rd | Lat 4th |
|---|---|---|---|---|---|---|---|---|---|---|---|
| Subject 06 | 22 | 60 | 111.70 | 96.78 | 134.60 | 92.55 | −0.400 | 0.301 | 0.318 | 0.314 | 0.316 |
| Subject 08 | 16 | 57 | 66.00 | 49.52 | 36.83 | 20.18 | −1.000 | 0.416 | 0.43 | 0.451 | 0.444 |
| Subject 09 | 14 | 60 | 112.82 | 90.30 | 95.33 | 89.75 | −0.800 | 0.307 | 0.318 | 0.329 | 0.319 |
| Subject 10 | 12 | 54 | 27.03 | 16.07 | 13.02 | 15.00 | −0.800 | 0.286 | 0.285 | 0.283 | 0.318 |
| Subject 11 | 12 | 30 | 26.12 | 18.59 | <8* | <8* | −0.949 | 0.355 | 0.404 | --- | --- |
| Subject 12 | 17 | 24 | 44.28 | 19.27 | 24.10 | <8* | −0.800 | 0.441 | 0.477 | 0.44 | --- |
| Subject 16 | 14 | 60 | 17.05 | 13.88 | 12.04 | <8* | −1.000 | 0.218 | 0.234 | 0.230 | --- |
| Subject 22 | 9 | 30 | 118.84 | 92.62 | 95.44 | 36.86 | −0.800 | 0.242 | 0.244 | 0.266 | 0.262 |
| Subject 23 | 6 | 60 | 18.68 | <8* | 12.46 | <8* | −0.632 | 0.24 | --- | 0.242 | --- |
Amplitudes below the detection threshold of 8fT were left-censored at 8fT.
Rank correlations were calculated using averaging for ties by treating left-censored amplitudes as equal to the left-censoring value of 8fT.
The rank correlations between VER amplitude and flash number were uniformly negative, ranging from −1.00 to −0.40, and had a median of −0.80, and lower and upper quartiles of −0.949 and −0.800, respectively. The non-parametric 95% confidence limits on the median stretched from −1.0 to −0.632, showing that the median rank correlation was significantly below both 0.0 and −0.5. Together, these observations strongly indicate that the newborn VER amplitude decreased with successive light flashes.
The behavior of the amplitude decreases were examined in more detail via repeated-measures analysis both before and after normalizing to the amplitude of the first flash: Figure 1a shows the averaged evoked response (19 trials) to each of the four stimulus trains on a 16 day old (41 weeks GA) newborn. An overlay of the selected channels over the head is shown. Also, the corresponding isofield map (Figure 1b) of the magnetic field and the head location are illustrated. Figure 1c shows an overlay of single channel response for all the four stimuli. From this figure the relative decrease in the amplitudes of the response from the first (−102.5 fT) to the fourth flash (−33.9 fT) is clearly observable. Figure 1d shows the neonatal head positioning during the recording. Figure 1e demonstrates the succession of train and break intervals of the stimuli presented.
Raw amplitudes for neonates were analyzed via repeated-measures ANOVA using a mixed model with heterogeneous autoregressive covariance structure for the repeated flashes. The fitted model yielded means (95% confidence limits) in fT of 60.3 (31.7–88.8) for the first flash, 45.7 (20.3–71.0) for the second flash, 48.7 (14.3–83.0) for the third flash, and 30.1 (0.5–59.6) for the fourth flash; the first-order autoregressive correlation coefficient was 95.0% between amplitudes measured on adjacent flashes. Polynomial-contrast analysis of the downward trend in raw amplitude with flash number disclosed that the trend was statistically significant for a linear component (linear contrast F=9.74, DFs=(1,18); P=0.0059), with non-significant evidence for deviation from linearity (higher-order- polynomials contrast F=2.42, DFs=(2,18); P=0.12). After normalizing each subject’s subsequent amplitudes to their first, the resulting relative amplitudes (Figure 3) were also analyzed via repeated-measures ANOVA. In all neonates, the second, third, and fourth amplitudes were significantly smaller than the first, with means (95% confidence limits) relative to first flash of 71.5% (55.9%–87.2%) for the second flash, 72.6% (57.0%–88.3%) for the third flash, and 52.7% (34.1%–71.3%) for the fourth flash; the autoregressive correlation coefficient was 54% between relative amplitudes calculated on adjacent flashes. Figure 3 illustrates the persistence of the downward trend in relative amplitude after the first flash. Polynomial-contrast analysis on the downward trend among normalized, relative amplitudes through all four flashes yielded strongly significant evidence for a linear component (linear contrast F=26.42, DFs=(1,10); P=0.0004), along with a non-significant deviation from strict linearity (higher-order-polynomials contrast F=3.27, DFs=(2,10); P=0.081).
Figure 3.
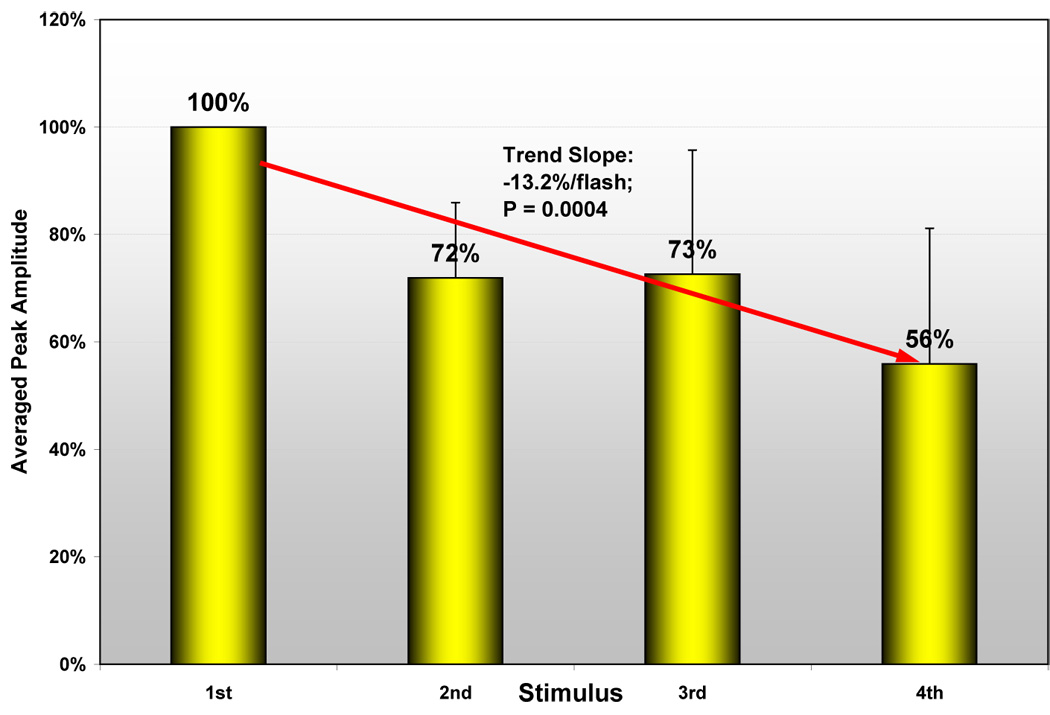
Illustrates the decrease of relative response amplitudes from the first to the second trigger in the neonates.
Latencies for neonates were analyzed via repeated-measures ANOVA using a mixed model with compound-symmetry covariance structure for the repeated flashes. The fitted model yielded means (95% confidence limits) in milliseconds of 312 (254–370) for the first flash, 329 (271–387) for the second flash, 327 (269–385) for the third flash, and 335 (276–394) for the fourth flash; the compound-symmetry correlation was 98% among repeated latency measures from the same fetus. Under polynomial-contrast analysis, the trend toward longer latency with later flashes was statistically significant for a linear component (linear contrast F=9.28, DFs=(1,18); P=0.0069), but statistically insignificant for non-linear components (higher-order-polynomials contrast F=1.80, DFs=(2,18); P=0.19).
Ten out of the 48 fetal recordings were excluded from the analysis because the study was stopped before the last trial was finished. The reasons for early termination included increased maternal heart rate and/or discomfort. Out of the 38 fetal recordings that were included, eleven (29 %) responded at least to the first light stimulus. In the remaining 27 datasets no evident response could be detected either to the first, second, third or fourth trigger.
A representative response from a 36 week GA fetus is shown in Figure 2a. It shows an averaged response of 30 trials for each of the four triggers. The corresponding isofield maps are shown in Figure 2b. The decrease in amplitude after the first trigger can be described as response cessation after the initial response, since the responses to the second, third and the fourth stimulus are not evident, and are possibly below the noise level of the instrument (5fT/sqrt(Hz)). This is also observable in Figure 2c, which illustrates an overlay of single channel tracings of all four triggers. The fetal head position as determined by ultrasound is demonstrated in Figure 2d.
Figure 2.
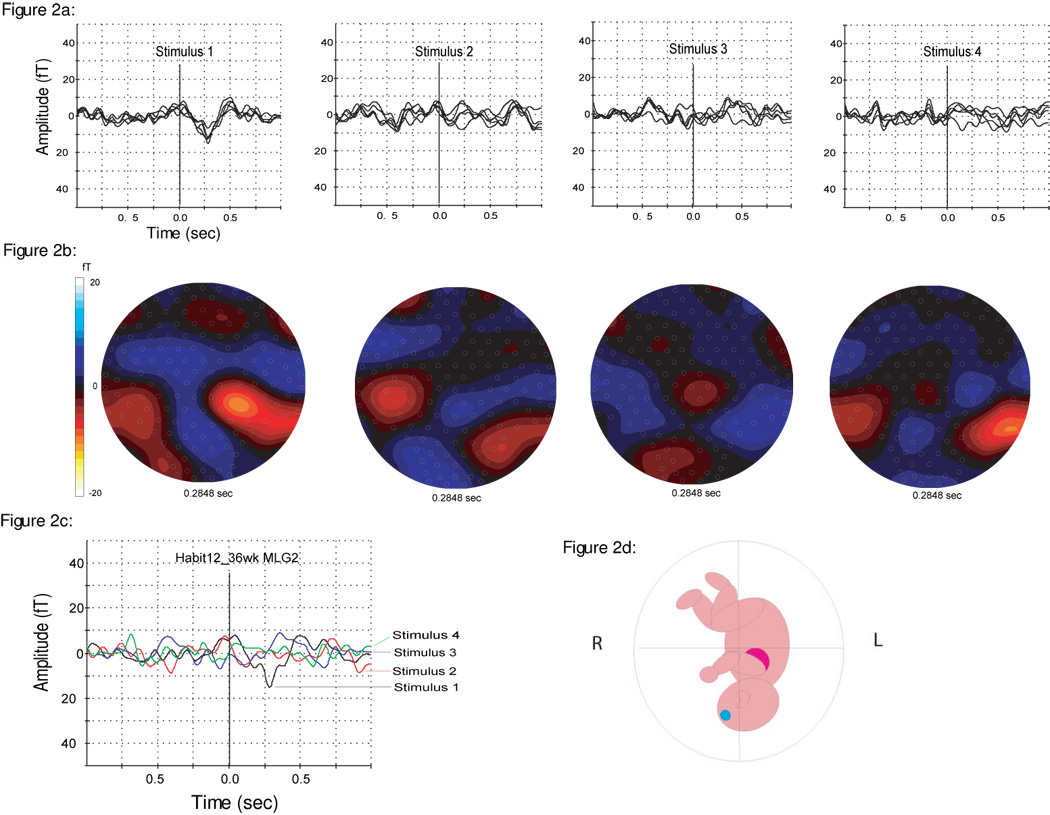
2a: Averaged evoked response (90 triggers) to each of the four stimuli on a fetus (36 weeks GA). An overlay of the selected channels over the head is shown.
2b: Illustration of the isofield map of the magnetic field corresponding to Figure 2a.
2c: Overlay of single channel responses (MLG2) for all four stimuli: Shows the decrease in response amplitude from the first (−15.1 fT) to the subsequent flashes, which are all on the noise level.
2d: Schematic drawing showing the fetal head position during the recording as determined by ultrasound.
The RMS values of the peak amplitudes and the latencies of the responses are shown in Table 2. The peak amplitudes of fetal VERs with an average of 15.35 fT (range: 8.85 fT – 28.22 fT) were small compared to the neonatal averages. In only two cases we were able to observe a response to the second light flash. In both cases, the peak amplitude to the second stimulus was smaller than the first response. In the remaining nine fetal recordings, a response could only be detected at the first light stimulus. The other fields in the table are indicated with the notation “<8*”. Because of the small response rate and the high number of missing values in the prenatal study, no further statistical analysis was conducted. Nevertheless, the fact that most of the fetuses responding to the first light flash failed to do so at the subsequent ones indicates a possible response decrement into the noise level of the instrument.
Table 2.
Fetal GA (“GA”; in weeks), number of triggers recorded (“Tri”), response amplitudes (“Amp”; RMS values) and mean latencies (“Lat”; in ms).
| Pat ID | GA | Tri | Amp 1st | Amp 2nd | Amp 3rd | Amp 4th | Lat 1st | Lat 2nd | Lat 3rd | Lat 4th |
|---|---|---|---|---|---|---|---|---|---|---|
| Subject 01 | 32 | 90 | 12.63 | 9.49 | <8* | 8.18 | 0.516 | 0.483 | --- | 0.483 |
| Subject 01 | 34 | 90 | 10.28 | <8* | <8* | <8* | 0.190 | --- | --- | --- |
| Subject 01 | 36 | 90 | 17.05 | <8* | <8* | <8* | 0.338 | --- | --- | --- |
| Subject 11 | 30 | 90 | 27.21 | 9.06 | <8* | <8* | 0.316 | 0.316 | --- | --- |
| Subject 12 | 34 | 90 | 11.80 | <8* | <8* | <8* | 0.368 | --- | --- | --- |
| Subject 12 | 36 | 90 | 11.86 | <8* | <8* | <8* | 0.281 | --- | --- | --- |
| Subject 17 | 32 | 90 | 10.59 | <8* | <8* | <8* | 0.465 | --- | --- | --- |
| Subject 18 | 35 | 90 | 10.12 | <8* | <8* | <8* | 0.437 | --- | --- | --- |
| Subject 18 | 36 | 90 | 20.25 | <8* | <8* | <8* | 0.476 | --- | --- | --- |
| Subject 21 | 34 | 90 | 28.22 | <8* | <8* | <8* | 0.291 | --- | --- | --- |
| Subject 22 | 36 | 90 | 8.85 | <8* | <8* | <8* | 0.209 | --- | --- | --- |
Amplitudes below the detection threshold of 8fT were left-censored at 8fT.
The response to the first light flash occurred at an average (range) latency of 0.350 s (0.190 s – 0.516 s) after stimulus onset. Latencies for subsequent stimuli have not been calculated due to the high number of missing values.
4. DISCUSSION
The results indicate that the paradigm is appropriate to detect response decrement in newborns. All the neonates with a detectable VER revealed a decrease in response amplitude from the first to the last stimulus, as shown by the rank correlations and by repeated-measures ANOVA on both raw and relative amplitudes. Post-ANOVA polynomial-contrast analysis showed that the decrease had a significant linear component. The fetal data revealed response cessation after one stimulus rather than continuous response decrement. Furthermore, the response rate in the fetal recordings was much lower than in the neonates (29% compared to 100%). Both these observations might have a common reason: the reduced signal-to-noise-ratio for fetal recordings. The fetal evoked response to the first stimulus starts with a low peak amplitude. Therefore, any reduction of response amplitude might not be detectable because it is below the noise level of the device. But despite their limitations, the fetal datasets might indicate a decrease in response amplitude as well.
A major advantage of this study is the use of amplitudes on data collected with the fetal MEG system. The amplitude is influenced by the distance from the signal source to the sensors as well as by the fetal position. Therefore, an interindividual assessment of amplitudes has not been possible in the past. In this study, the paradigm is set up so the fetal position and distance to the sensors do not influence the outcome measure. Even if the fetus changed its position during the recording, this would have affected the amplitude of the four triggers equally. Therefore, the use of amplitudes is made possible by intraindividual comparison within the same time frame. This shows that the decrement of brain responses can be recorded directly with current technology.
The fetal response rate of 29% in our study is much lower than the findings in our previous fMEG studies on VERs (Eswaran et al., 2004). This is most likely affected by the low number of stimuli available for averaging. In fact, our previous VER studies averaged 180 light flashes, whereas this paradigm adds up to only half as many stimulus presentations. A lower number of averaged stimuli leads to a decreased signal to noise ratio. Considering the naturally small amplitude of fetal brain responses, the number of detectable responses could be affected even by slight changes in the signal-to-noise ratio. In future studies, the 10 s interval between the light flash sequences could be replaced by a train of deviant stimuli to increase the stimulus number and to keep the recording time constant at 30 minutes.
This study did not encompass the task of identifying which part of the response decrement occurred due to habituation versus receptor fatigue. In order to investigate this, a criterion called dishabituation (Thompson and Spencer, 1966) has to be shown. But as stated in the introduction, this study was conducted in order to evaluate a simpler paradigm as a first step. This provides the basis for a subsequent study paradigm that tests dishabituation as well. By applying the same alterations to the paradigm as described above, dishabituation could be proved and therefore receptor fatigue determined. Until this is investigated in a future study, the phenomenon observed here was called response decrement instead of habituation.
Despite its challenges, the authors feel that fetal habituation is worth further study. Maternal diabetes (Doherty and Hepper, 2000), depression (Allister et al., 2001) and stress (Sandman et al., 1995) have been shown to affect fetal habituation in a negative way. Therefore, a prenatal detection of adverse habituation could be used as an indicator for the re-evaluation of maternal high-risk conditions. A diabetic mother might need to improve her blood sugar control; the symptoms of maternal depression might need to be better evaluated or addressed with a multi-faceted treatment that includes behavioral as well as other interventions. A mother with a high level of stress in her life might need to address this (e.g. seek social support for her everyday life and learn relaxation techniques) in order to avoid adverse effects through high maternal β-Endorphin levels on her baby. Obviously, these suggestions are hypothetical and need to be addressed in futures studies. But knowing about abnormal habituation performance before delivery might encourage more research that focuses on possible prenatal interventions.
This is the first time a visual short-term habituation paradigm has been applied on human fetuses and neonates. The study has shown that it is a promising approach for the detection of response decrements in newborns and – with limitations – even in fetuses. The non-invasive recording contains no risks for mother and baby. Furthermore, it allows the direct collection of elicited brain responses. Future investigations using MEG have the potential to yield greater knowledge and insight into the course of normal in-utero cognitive maturation which could then be applied toward the development of new strategies to assess fetal well-being. This could allow an early detection of cortical deficits; help to improve the unborn’s developmental conditions and therefore prevent further damage.
Acknowledgments
Supported by grants: NIH/NINDS 5R01-NS36277-05; NIH/NIBIB R33-EB00978.
Footnotes
Publisher's Disclaimer: This is a PDF file of an unedited manuscript that has been accepted for publication. As a service to our customers we are providing this early version of the manuscript. The manuscript will undergo copyediting, typesetting, and review of the resulting proof before it is published in its final citable form. Please note that during the production process errors may be discovered which could affect the content, and all legal disclaimers that apply to the journal pertain.
References
- Amochaev A, Salamy A, Alvarez W, Peeke H. Topographic mapping and habituation of event related EEG alpha band desynchronization. Int J Neurosci. 1989;49:151–155. doi: 10.3109/00207458909084823. [DOI] [PubMed] [Google Scholar]
- Bellieni CV, Severi F, Bocchi C, Caparelli N, Bagnoli F, Buonocore G, Petraglia F. Blink-startle reflex habituation in 30–40-week low-risk fetuses. J Perinat Med. 2005;33:33–37. doi: 10.1515/JPM.2005.005. [DOI] [PubMed] [Google Scholar]
- Budd TW, Barry RJ, Gordon E, Rennie C, Michie PT. Decrement of the N1 auditory event-related potential with stimulus repetition: habituation vs. refractoriness. Int J Psychophysiol. 1998;31(1):51–68. doi: 10.1016/s0167-8760(98)00040-3. [DOI] [PubMed] [Google Scholar]
- Doherty NN, Hepper PG. Habituation in fetuses of diabetic mothers. Early Hum Dev. 2000;59:85–93. doi: 10.1016/s0378-3782(00)00089-x. [DOI] [PubMed] [Google Scholar]
- Eswaran H, Wilson JD, Preissl H, Robinson SE, Rose DF, Vrba J, Murphy P, Lowery CL. Magnetoencephalographic recordings of visual evoked brain activity in the human fetus. The Lancet. 2002;360:779–780. doi: 10.1016/s0140-6736(02)09905-1. [DOI] [PubMed] [Google Scholar]
- Eswaran H, Lowery CL, Wilson JD, Murphy P, Preissl H. Functional development of the visual system in human fetus using magnetoencephalography. Exp Neurol. 2004;190:52–58. doi: 10.1016/j.expneurol.2004.04.007. [DOI] [PubMed] [Google Scholar]
- Gaultney JF, Gingras JL. Fetal rate of behavioral inhibition and preference for novelty during infancy. Early Hum Dev. 2005;81(4):379–386. doi: 10.1016/j.earlhumdev.2004.09.007. [DOI] [PubMed] [Google Scholar]
- Goldkrand JW, Litvack BL. Demonstration of fetal habituation and patterns of fetal heart rate response to vibroacoustic stimulation in normal and high-risk pregnancies. J Perinatol. 1991;11(1):25–29. [PubMed] [Google Scholar]
- Groome LJ, Gotlieb SJ, Neely CL, Waters MD. Developmental trends in fetal habituation to vibroacoustic stimulation. Am J Perinatol. 1993;10(1):46–49. doi: 10.1055/s-2007-994700. [DOI] [PubMed] [Google Scholar]
- Hepper PG, Shahidullah S. Habituation in normal and Down's syndrome fetuses. Q J Exp Psychol B. 1992;44(3–4):305–317. doi: 10.1080/02724999208250617. [DOI] [PubMed] [Google Scholar]
- Hepper PG, Shahdulla S. Development of fetal hearing. Arch Dis Childhood. 1994;11:25–29. doi: 10.1136/fn.71.2.f81. [DOI] [PMC free article] [PubMed] [Google Scholar]
- Hepper PG. The behaviour of the foetus as an indicator of neural functioning. In: Lecanuet J-P, Fifer W, Krasnegor N, Smotherman W, editors. Fetal development. A psychobiological perspective. Hillsdale, NJ: Lawrence Erlbaum; 1995. pp. 405–417. [Google Scholar]
- Hepper PG. Fetal memory: does it exist? What does it do? Acta Paediatr Suppl. 1996;416:16–20. doi: 10.1111/j.1651-2227.1996.tb14272.x. [DOI] [PubMed] [Google Scholar]
- Hepper PG. Fetal habituation: another Pandora's box? Dev Med Child Neurol. 1997;39(4):274–278. doi: 10.1111/j.1469-8749.1997.tb07426.x. [DOI] [PubMed] [Google Scholar]
- Herschkowitz N. Brain development in the fetus, neonate and infant. Biol Neonate. 1988;54(1):1–19. doi: 10.1159/000242818. [DOI] [PubMed] [Google Scholar]
- Kisilevsky BS. Vibroacoustic stimulation can pose risks. JOGNN / NAACOG. 1990;19(6):469–470. doi: 10.1111/j.1552-6909.1990.tb01665.x. [DOI] [PubMed] [Google Scholar]
- Kisilevsky BS, Killen H, Muir DW, Low JA. Maternal and ultrasound measurements of elicited fetal movements: a methodologic consideration. Obstet Gynecol. 1991;77(6):889–892. [PubMed] [Google Scholar]
- Kuhlman KA, Burns KA, Depp R, Sabbagha RE. Ultrasonic imaging of normal fetal response to external vibratory acoustic stimulation. Am J Obstet Gynecol. 1988;158:47–51. doi: 10.1016/0002-9378(88)90773-9. [DOI] [PubMed] [Google Scholar]
- Lasky RE. Rate and adaptation effects on the auditory evoked brainstem response in human newborns and adults. Hear Res. 1997;111:165–176. doi: 10.1016/s0378-5955(97)00106-8. [DOI] [PubMed] [Google Scholar]
- Lasky RE, Maier MM, Hecox K. Auditory evoked brain stem responses to trains of stimuli in human adults. Ear Hear. 1996;17:544–551. doi: 10.1097/00003446-199612000-00010. [DOI] [PubMed] [Google Scholar]
- Leader LR, Baillie P, Martin B, Vermeulen E. The assessment and significance of habituation to a repeated stimulus by the human fetus. Early Hum Dev. 1982;7:211–219. doi: 10.1016/0378-3782(82)90084-6. [DOI] [PubMed] [Google Scholar]
- Leader LR, Baillie P, Martin B, Vermeulen E. Fetal habituation in high-risk pregnancies. Br J Obstet Gynaecol. 1982;89:441–446. doi: 10.1111/j.1471-0528.1982.tb03633.x. [DOI] [PubMed] [Google Scholar]
- Leader LR, Baillie P, Martin B, Molteno C, Wynchank S. Fetal responses to vibrotactile stimulation, a possible predictor of fetal and neonatal outcome. Aust NZ J Obstet Gynaecol. 1984;24(4):251–256. doi: 10.1111/j.1479-828x.1984.tb01505.x. [DOI] [PubMed] [Google Scholar]
- Leader LR, Baillie P. The changes in fetal habituation patterns due to a decrease in inspired maternal oxygen. Br J Obstet Gynaecol. 1988;95(7):664–668. doi: 10.1111/j.1471-0528.1988.tb06527.x. [DOI] [PubMed] [Google Scholar]
- Lowery CL, Eswaran H, Murphy P, Preissl H. Fetal magnetoencephalography. Semin Fetal Neonatal Med. 2006;11(6):430–436. doi: 10.1016/j.siny.2006.09.002. [DOI] [PubMed] [Google Scholar]
- Madison LS, Adubato SA, Madison JK, Nelson RM, Anderson JC, Erickson J, Kuss LM, Goodlin RC. Fetal response decrement: true habituation? J Dev Behav Pediatr. 1986;7(1):14–20. doi: 10.1097/00004703-198602000-00003. [DOI] [PubMed] [Google Scholar]
- Madison LS, Madison JK, Adubato SA. Infant behavior and development in relation to fetal movement and habituation. Child Dev. 1986;57:1475–1482. [PubMed] [Google Scholar]
- McCubbin J, Robinson SE, Cropp R, Moiseev A, Vrba J, Murphy P, Preissl H, Eswaran H. Optimal reduction of MCG in fetal MEG recordings. IEEE Trans Biomed Eng. 2006;53(8):1720–1724. doi: 10.1109/TBME.2006.876619. [DOI] [PubMed] [Google Scholar]
- McCubbin J, Murphy P, Eswaran H, Preissl H, Yee T, Robinson SE, Vrba J. Validation of flash evoked response from fetal MEG. Phys Med Biol. 2007;52:5803–5813. doi: 10.1088/0031-9155/52/19/005. [DOI] [PMC free article] [PubMed] [Google Scholar]
- Morokuma S, Fukushima K, Kawai N, Tomonaga M, Satoh S, Nakano H. Fetal habituation correlates with functional brain development. Behav Brain Res. 2004;153(2):459–463. doi: 10.1016/j.bbr.2004.01.002. [DOI] [PubMed] [Google Scholar]
- Rosburg T, Trautner P, Boutros NN, Korzyukov OA, Schaller C, Elger EC, Kurthen M. Habituation of auditory evoked potentials in intracranial and extracranial recordings. Psychophysiology. 2006;43:137–144. doi: 10.1111/j.1469-8986.2006.00391.x. [DOI] [PubMed] [Google Scholar]
- Shalev E, Benett MJ, Megory E, Wallace RM, Zuckerman H. Fetal habituation to repeated sound stimulation. Isr J Med Sci. 1989;25:77–80. [PubMed] [Google Scholar]
- Shalev E, Weiner E, Serr DM. Fetal habituation to sound stimulus in various behavioral states. Gynecol Obstet Invest. 1990;29:115–117. doi: 10.1159/000293315. [DOI] [PubMed] [Google Scholar]
- Smith CV, Davis SR, Rayburn WF, Nelson RM. Fetal habituation to vibroacoustic stimulation in uncomplicated term pregnancies. Am J Perinatol. 1991;8:380–382. doi: 10.1055/s-2007-999420. [DOI] [PubMed] [Google Scholar]
- Thompson RF, Spencer WA. Habituation: a model phenomenon for the study of neuronal substrates of behavior. Psychol Rev. 1966;73(1):16–43. doi: 10.1037/h0022681. [DOI] [PubMed] [Google Scholar]
- Uusitalo MA, Williamson SJ, Seppa MT. Dynamical organization of the human visual system revealed by lifetimes of activation traces. Neurosci let. 1996;213(3):149–153. doi: 10.1016/0304-3940(96)12846-9. [DOI] [PubMed] [Google Scholar]
- Vanhanen M, Karhu J, Koivisto K, Paakkonen A, Partanen J, Laakso M, Riekkinen P., Sr ERPs reveal deficits in automatic cerebral stimulus processing in patients with NIDDM. Neuroreport. 1996;7:2767–2771. doi: 10.1097/00001756-199611040-00072. [DOI] [PubMed] [Google Scholar]
- Van Heteren CF, Boekkooi PF, Jongsma HW, Nijhuis JG. Fetal learning and memory. The Lancet. 2000;356:1169–1170. doi: 10.1016/S0140-6736(00)02766-5. [DOI] [PubMed] [Google Scholar]
- Van Heteren CF, Boekkooi PF, Jongsma HW, Nijhuis JG. Fetal habituation to vibroacoustic stimulation in relation to fetal states and fetal heart rate parameters. Early Hum Dev. 2001;61(2):135–145. doi: 10.1016/s0378-3782(00)00130-4. [DOI] [PubMed] [Google Scholar]
- Van Heteren CF, Boekkooi PF, Schiphorst RH, Jongsma HW, Nijhuis JG. Fetal habituation to vibroacoustic stimulation in uncomplicated postterm pregnancies. Eur J Obstet Gynecol Reprod Biol. 2001;97(2):178–182. doi: 10.1016/s0301-2115(00)00543-1. [DOI] [PubMed] [Google Scholar]
- Vrba J, Robinson SE, McCubbin J, Lowery CL, Eswaran H, Wilson JD, Murphy P, Preissl H. Fetal MEG redistribution by projection operators. IEEE Trans Biomed Eng. 2004 July;51(7):1207–1218. doi: 10.1109/TBME.2004.827265. [DOI] [PubMed] [Google Scholar]