

Abstract
CYP4F enzymes, including CYP4F2 and CYP4F3B, were recently shown to be the major enzymes catalyzing the initial oxidative O-demethylation of the antiparasitic prodrug pafuramidine (DB289) by human liver microsomes. As suggested by a low oral bioavailability, DB289 could undergo first-pass biotransformation in the intestine, as well as in the liver. Using human intestinal microsomes (HIM), we characterized the enteric enzymes that catalyze the initial O-demethylation of DB289 to the intermediate metabolite, M1. M1 formation in HIM was catalyzed by cytochrome P450 (P450) enzymes, as evidenced by potent inhibition by 1-aminoben-zotriazole and the requirement for NADPH. Apparent Km and Vmax values ranged from 0.6 to 2.4 μM and from 0.02 to 0.89 nmol/min/mg protein, respectively (n = 9). Of the P450 chemical inhibitors evaluated, ketoconazole was the most potent, inhibiting M1 formation by 66%. Two inhibitors of P450-mediated arachidonic acid metabolism, HET0016 (N-hydroxy-N′-(4-n-butyl-2-methylphenyl)formamidine) and 17-octadecynoic acid, inhibited M1 formation in a concentration-dependent manner (up to 95%). Immunoinhibition with an antibody raised against CYP4F2 showed concentration-dependent inhibition of M1 formation (up to 92%), whereas antibodies against CYP3A4/5 and CYP2J2 had negligible to modest effects. M1 formation rates correlated strongly with arachidonic acid ω-hydroxylation rates (r2 = 0.94, P < 0.0001, n = 12) in a panel of HIM that lacked detectable CYP4A11 protein expression. Quantitative Western blot analysis revealed appreciable CYP4F expression in these HIM, with a mean (range) of 7 (3–18) pmol/mg protein. We conclude that enteric CYP4F enzymes could play a role in the first-pass biotransformation of DB289 and other xenobiotics.
Effective treatment of human protozoan parasitic diseases and opportunistic fungal infections remains a challenging public health issue, particularly in underdeveloped countries (Werbovetz, 2006). Such diseases can be fatal if left untreated and include visceral leishmaniasis, African trypanosomiasis (or African sleeping sickness), and Pneumocystis jiroveci (formerly Pneumocystis carinii) pneumonia (or PCP). The aromatic dication pentamidine is a traditional agent used to treat these diseases. Although effective, this agent can lead to serious side effects, including nephrotoxicity, severe hypoglycemia or hyperglycemia, and a variety of blood disorders (Doua and Yapo, 1993; Werbovetz, 2006; Barrett et al., 2007). In addition to toxicity concerns, this agent must be administered parenterally (because of a low oral bioavailability), which can be especially problematic in remote areas of endemic countries. Taken together, an orally active agent with a low potential for toxicity would have great clinical benefit.
Furamidine (DB75), an analog of pentamidine, is effective against a number of eukaryotic pathogens in vitro, including Leishmania spp., Trypanosoma brucei, and P. jiroveci (Das and Boykin, 1977; Bell et al., 1990; Tidwell et al., 1990). However, like pentamidine, DB75 exists as a dication at physiological pH and has poor permeation through the intestinal epithelium (Zhou et al., 2002). As a result, DB75 suffers from poor systemic exposure when given p.o. Pafuramidine (DB289) is a methylamidoxime prodrug of DB75 that has improved oral efficacy and reduced acute toxicity in animal models of Pneumocystis pneumonia and African trypanosomiasis (Boykin et al., 1996). In addition, an early clinical trial involving patients with first-stage African trypanosomiasis treated with p.o. DB289 had a 95% cure rate (C. Olson, Immtech Pharmaceuticals Inc., personal communication). Although this and other clinical trials have shown DB289 as a promising antiparasitic agent, an initial single-dose escalation study in six healthy men given p.o. 14C-DB289 characterized the compound as having variable absorption and elimination properties as evidenced by coefficients of variation of approximately 50% for Cmax, area under the curve, and terminal half-life (C. Olson, Immtech Pharmaceuticals Inc., personal communication). A large interindividual variation in the systemic exposure of DB289, as well as DB75, could have clinical and/or toxicological implications. Accordingly, an understanding of the factors contributing to this large variation is essential. One such factor could include interindividual variation in the extent of conversion of DB289 to DB75.
DB289 is biotransformed to DB75 in rats, monkeys, and humans by sequential O-demethylation and N-dehydroxylation reactions (Zhou et al., 2004; Saulter et al., 2005; Wang et al., 2006; Midgley et al., 2007). Recent studies in rats and monkeys showed that 14C-DB289 was well absorbed after p.o. administration (~50–70%) and was effectively converted to DB75 (Midgley et al., 2007). A low oral bioavailability (10–20%) further indicated that DB289 was subject to first-pass metabolism, a potentially desirable property for a prodrug. Taken together, interindividual variation in the extent of presystemic metabolism could represent a potential source of the large interindividual variation in DB289 systemic exposure observed in clinical trials.
We recently characterized the hepatic enzymes responsible for the initial O-demethylation of DB289 (to M1) using recombinant cytochrome P450 (P450) and a panel of human liver microsomes (HLM) (Wang et al., 2006). Results indicated that members of the CYP4F subfamily, including CYP4F2 and CYP4F3B, were the primary catalysts of this reaction (Wang et al., 2006). However, M1 formation rates in the panel of HLM varied only 4-fold (Wang et al., 2006). Thus, if this reaction is the rate-limiting step in the biotransformation of DB289, then variation in hepatic metabolism may have a minor contribution to the variation in the systemic exposure of DB289.
An alternative source of the variation in DB289 systemic exposure could involve variation in intestinal first-pass metabolism. It has been well established that enteric CYP3A contributes significantly to the low and variable oral bioavailability of a number of drugs. Other P450s (CYP1A1, CYP2C9, CYP2C19, CYP2D6, CYP2J2, and CYP4F12) are known to be expressed in the human intestine, but their clinical relevance remains to be determined (Paine et al., 2006). Accordingly, using a panel of human intestinal microsomes (HIM), the primary objective of the current work was to evaluate the potential contribution of enteric P450s, including CYP4F, to the presystemic O-demethylation of DB289 to M1. A secondary objective was to characterize the interindividual variation in enteric CYP4F expression.
Materials and Methods
Chemicals
DB289 was synthesized by Medichem (Woodlake, IL) using previously described methods (Das and Boykin, 1977; Boykin et al., 1996). The intermediate Phase I metabolites (M1, M2, and M3), the active diamidine DB75, and deuterium-labeled DB289 (DB289-d8) (internal standard) were a gift from Dr. David W. Boykin (Georgia State University, Atlanta, GA). Hydroxyeicosatetraenoic acids (HETE) [5-, 8-, 9-, 11-, 12-, 15-HETE, and 20-hydroxy-5Z,8Z,11Z,14Z-eicosatetraenoic acid (20-HETE)], epoxyeicosatrienoic acids (EET) (5,6-, 8,9-, 11,12-, and 14,15-EET), deuterium-labeled 20-HETE (20-HETE-d6), 17-octadecynoic acid (17-ODYA), HET0016, and arachidonic acid were purchased from Cayman Chemical Co. (Ann Arbor, MI). 19-HETE was a gift from Dr. John R. Falck (University of Texas Southwestern Medical Center, Dallas, TX). Ebastine was purchased from Toronto Research Chemicals Inc. (North York, ON, Canada). 1′-Hydroxymidazolam was purchased from BD Gentest (Woburn, MA). High-performance liquid chromatography (HPLC)-grade water and acetonitrile were obtained from Fisher Scientific (Pittsburgh, PA). Analytical-grade ammonium formate, formic acid, magnesium chloride, dimethyl sulfoxide, potassium dihydrogen phosphate, disodium hydrogen phosphate anhydrous, NADPH, midazolam, alprazolam, α-naphthoflavone (α-NF), fluvoxamine, furafylline, coumarin, thioTEPA, sulfaphenazole, trimethoprim, omeprazole, quinidine, diethyldi-thiocarbamate, ketoconazole, troleandomycin, lauric acid, and 1-aminobenzotriazole (ABT) were purchased from Sigma-Aldrich (St. Louis, MO). All the chemicals were of the highest purity available and were used without further purification.
HIM, Antibodies, and Recombinant Human P450s
Pooled HIM (n = 8, mixed gender), a polyclonal antibody raised against CYP3A4/5, and preimmune immunoglobulin (IgG) from rabbit were purchased from XenoTech, LLC (Lenexa, KS). A panel of 11 HIM was prepared from the proximal portion of human small intestines obtained from unrelated organ donors as described previously (Paine et al., 2006). Five of these HIM (donors 1, 2, 23A, 31, and 32) were characterized previously (Paine et al., 2006). Polyclonal antibodies raised against CYP4A11 and CYP4F2 were purchased from Research Diagnostics, Inc. (Concord, MA) (1 mg of IgG/ml). A monoclonal antibody raised against CYP2J2, MAb-1 (6-2-16-1, lot A1), and a control monoclonal antibody against egg lysozyme were generated in mouse hybridoma cells as described previously (Xiao et al., 2004) and were used for the immunoinhibition study. A rabbit polyclonal antibody raised against the CYP2J2-specific peptide HMDQNFGNRPVTPMR (amino acids 103–117, anti-CYP2J2pep1) (King et al., 2002) was used for Western blot analysis. The goat anti-rabbit secondary antibody was purchased from LI-COR Biosciences (Lincoln, NE). Supersomes prepared from baculovirus-infected insect cells expressing human P450 enzymes and NADPH-P450 reductase were purchased from BD Gentest (Woburn, MA).
Standard Incubation Conditions
Standard incubation conditions and the preparation of chemical inhibitor solutions were described previously (Wang et al., 2006). Briefly, incubation mixtures contained 100 mM phosphate buffer, pH 7.4, 3.3 mM MgCl2, and 1 mM NADPH unless indicated otherwise. All the incubation mixtures contained <0.9% (v/v) organic solvent. Reactions were initiated by the addition of NADPH (or substrate for incubations with mechanism-based inhibitors). Reactions were terminated with 2 volumes of ice-cold acetonitrile containing 0.1% formic acid (v/v) and 15 or 30 nM internal standard (DB289-d8) unless indicated otherwise. The mixtures were vortex-mixed, and precipitated proteins were removed by centrifugation (~1400g) for 15 min. The supernatant fractions were analyzed by HPLC/tandem mass spectrometry (MS/MS) (described below). For all the incubations, the amount of product formed was linear with respect to the incubation time (up to 30 min) and the amount of enzyme (up to 0.2 mg/ml HIM).
Incubations with Pooled HIM
Incubation mixtures (1 ml) contained 10 μM DB289 and 0.2 mg/ml HIM. After a 5-min equilibration period at 37°C, reactions were initiated by the addition of NADPH. Aliquots (50 μl) of the reaction mixtures were removed at 0, 15, 30, and 120 min and mixed with 25 μl of ice-cold acetonitrile to quench the reaction. The mixtures were processed (described under Standard Incubation Conditions) and analyzed immediately by HPLC/UV (described below). Metabolites were identified by comparing retention times with those of synthetic standards. Control incubations were prepared as described above except NADPH, microsomal protein, or DB289 was absent.
Enzyme Kinetic Experiments
Under initial rate conditions (<20% substrate consumption), primary metabolite (M1) formation by pooled and nine individual HIM (0.1 or 0.2 mg/ml) was evaluated at concentrations of DB289 ranging from 0.05 to 25 μM. The other two individual HIM were not available at the time of analysis. After a 5-min equilibration period at 37°C, reactions (250 μl, final) were initiated by the addition of NADPH. After 5 min, reactions (100-μl aliquot) were terminated and processed as described under Standard Incubation Conditions. The amount of M1 formed was determined by HPLC/MS/MS analysis (described below).
Chemical Inhibition Assays
P450 chemical inhibitors were added to standard incubation mixtures (250 μl) containing 0.2 mg/ml pooled HIM and 3 μM DB289. Reactions were carried out for 5 min. The selection and concentrations of chemical inhibitors used were described previously (Wang et al., 2006). Control incubations contained methanol [0.4% (v/v), final] in place of chemical inhibitors.
In a subsequent experiment, ebastine (a CYP2J2, CYP4F12, and CYP3A4 substrate), arachidonic acid (a CYP4F2, CYP4F3B, and CYP2J2 substrate), HET0016 (an arachidonic acid ω-hydroxylase inhibitor), and 17-ODYA (a nonselective mechanism-based arachidonic acid ω-hydroxylase and epoxygenase inhibitor) were evaluated for their ability to inhibit the conversion of DB289 to M1 by the pooled HIM in a manner similar to that described above. Varying concentrations of these inhibitors were used to assess concentration-dependent inhibition, generally covering from 0.1 up to 100 times their reported Km or IC50 values. The amount of M1 formed was determined by HPLC/MS/MS analysis (described below).
Immunoinhibition Assays
Immunoinhibitory antibodies against CYP4F2 (1 mg of IgG/ml), CYP3A4/5 (1 mg of IgG/ml), or CYP2J2 (1.1 mg of IgG/ml) (0, 5, 12.5, and 25 μl) were preincubated with HIM (0.2 mg/ml) or recombinant P450 enzymes (10 pmol/ml) at 37°C for 15 min before the addition of DB289 (3 μM, final). Reactions (250 μl) were initiated by addition of NADPH and were carried out for 5 min for all the enzyme preparations except for HIM from donor 23A (15-min incubation as a result of lower activity). Reaction mixtures (100 μl) were processed as described under Standard Incubation Conditions. Control incubations contained the same volume of preimmune rabbit IgG to account for nonspecific protein binding. The amount of M1 formed was determined by HPLC/MS/MS analysis (described below).
Arachidonic Acid ω-Hydroxylation (20-HETE Formation) and Midazolam 1′-Hydroxylation Assays
Stock solutions of arachidonic acid and midazolam were prepared in methanol. Arachidonic acid (20 μM) was incubated with HIM (0.2 mg/ml) for 30 min, and midazolam (4 μM) was incubated with HIM (0.1 mg/ml) for 2 min as described under Standard Incubation Conditions. Reactions (100-μl aliquot) were stopped with 200 μl of ice-cold acetonitrile containing 200 nM 20-HETE-d6 (for arachidonic acid incubations) or 20 ng/ml alprazolam (for midazolam incubations) as internal standard. Concentrations of 20-HETE or 1′-hydroxymidazolam were measured by HPLC/MS/MS as described below.
Western Blot Analysis
HIM proteins (15 or 30 μg) and recombinant P450 proteins (0.01–0.5 pmol) were separated by 10% SDS-polyacrylamide gel electrophoresis and transferred to nitrocellulose membranes. Membranes were immunoblotted with an antibody raised against CYP4F2 (1:500 dilution), CYP4A11 (1:500 dilution), or CYP2J2 (1:1000 dilution). An infrared fluorescent dye-conjugated secondary antibody was used to visualize the proteins of interest using an Odyssey infrared imaging system (LI-COR Biosciences). Quantitative analysis of triplicate determinations was achieved with the instrument software using recombinant P450s as calibration standards.
HPLC/UV Assays
Analyses of DB289 and its metabolites were performed on an Agilent 1100 Series HPLC system (Palo Alto, CA) equipped with a UV diode array detector as described previously (Wang et al., 2006). Samples were separated on an Agilent ZORBAX Bonus-RP column (2.1 × 50 mm, 3.5 μm) with a 0.35-ml/min flow rate. All the samples were monitored at a UV absorbance of 359 nm.
HPLC/MS/MS Assays for the Quantification of M1 and 1′-Hydroxymidazolam
The quantification of both M1 and 1′-hydroxymidazolam was performed on an Applied Biosystems (Foster City, CA) API 4000 triple quadrupole mass spectrometer equipped with a Turbo IonSpray interface (for electrospray ionization) (MDS Sciex, San Francisco, CA). Typically, 4 μl of sample was injected. The conditions for M1 measurement were described in detail previously (Wang et al., 2006), and the calibration curve ranged from 1 to 2500 nM.
1′-Hydroxymidazolam was eluted from an Aquasil C18 analytical column (Thermo Electron, Waltham, MA) and analyzed by HPLC/MS/MS in positive ion mode. HPLC mobile phases consisted of HPLC-grade water containing 0.1% formic acid (A) and methanol containing 0.1% formic acid (B). After a 0.4-min initial hold at 15% B, mobile phase composition began with 15% B and was increased to 80% B over 1.6 min, followed by a 1.0-min hold at a flow rate of 0.5 ml/min. The column was then washed with 95% B for 1.3 min at a flow rate of 1.5 ml/min and was re-equilibrated with 15% B at a flow rate of 0.5 ml/min for 0.5 min before injection of the next sample. The characteristic selected reaction monitoring (SRM) transitions for 1′-hydroxymidazolam and alprazolam were m/z 342.3 → 203.0 and 309.3 → 281.0, respectively. The quantification limit of 1′-hydroxymidazolam was 1 nM. The calibration curve for 1′-hydroxymidazolam ranged from 1 to 1000 nM. The intraday coefficient of variation (CV) and accuracy were determined by measuring the same preparation of three 1′-hydroxymidazolam standards three times on the same day. At 1′-hydroxymidazolam concentrations of 1, 100, and 1000 nM, the intraday CV and average accuracy were 1.8 and 91%, 4.3 and 106%, and 2.6 and 101%, respectively. The interday CV and accuracy were determined by measuring the same preparation of three 1′-hydroxymidazolam standards in triplicate on two consecutive days. At 1′-hydroxymidazolam concentrations of 1, 100, and 1000 nM, the interday CV and average accuracy were 0.4 and 91%, 1.0 and 105%, and 0.1 and 101%, respectively.
HPLC/MS/MS Assay for the Quantification of 20-HETE Formed in HIM
The identification of arachidonic acid metabolites and the quantification of 20-HETE were performed on an Applied Biosystems API 4000 triple quadrupole mass spectrometer equipped with a heated nebulizer interface (for atmospheric pressure chemical ionization). To identify the arachidonic acid metabolites generated by HIM, standards (~0.4 μM in 50% methanol) of arachidonic acid oxidation products (5-, 8-, 9-, 11-, 12-, 15-, 19-, and 20-HETE and 5,6-, 8,9-, 11,12-, and 14,15-EET) were separated on a Hypersil GOLD analytical column (2.1 × 50 mm, 5 μm) (Thermo Electron) and detected by HPLC/MS/MS in positive ion mode using a nonspecific SRM transition (321.3 → 303.3), which resulted from the neutral loss of a water molecule from the parent compound. HPLC mobile phases that were optimized for mass spectrometry consisted of HPLC-grade water containing 0.1% formic acid (A) and methanol containing 0.1% formic acid (B). After a 1.0-min initial hold at 60% B, mobile phase composition began with 60% B and was increased linearly to 70% B over 24 min with a flow rate of 0.5 ml/min. The column was then washed with 100% B at a flow rate of 1.0 ml/min for 2.5 min and was re-equilibrated with 60% B at a flow rate of 0.5 ml/min for 2 min before injection of the next sample.
To quantify 20-HETE formed by HIM after incubation with arachidonic acid, reaction mixtures were separated on an Aquasil C18 analytical column (2.1 × 50 mm, 5 μm) (Thermo Electron) and analyzed by HPLC/MS/MS in positive ion mode. A shorter HPLC gradient was developed to minimize the analysis time. After a 0.4-min initial hold at 50% B, mobile phase composition began with 50% B and was increased to 95% B over 1.6 min, followed by a 1.0-min hold at 95% B with a flow rate of 0.5 ml/min. The column was then washed with 95% B for 1.3 min at a flow rate of 1.5 ml/min and was re-equilibrated with 50% B at a flow rate of 0.5 ml/min for 0.5 min before injection of the next sample. The SRM transitions for 20-HETE and 20-HETE-d6 were m/z 321.3 → 303.3 and 327.3 → 309.3, respectively. The quantification limit of 20-HETE was 25 nM. The calibration curve for 20-HETE ranged from 25 to 5000 nM. The intraday CV and accuracy were determined by measuring the same preparation of three 20-HETE standards four times on the same day. At 20-HETE concentrations of 50, 1000, and 5000 nM, the intraday CV and accuracy were 16 and 94%, 7.6 and 99%, and 0.8 and 99%, respectively. The interday CV and accuracy were determined by measuring the same preparation of three 20-HETE standards in triplicate on three different days. At 20-HETE concentrations of 50, 1000, and 5000 nM, the interday CV and average accuracy were 15 and 97%, 2.7 and 100%, and 0.8 and 100%, respectively.
Data Analysis
Because of the limited quantities of some individual HIM, data are presented as the means of duplicate determinations unless indicated otherwise. For inhibition studies, the amount of M1 formed in control incubations was set to 100%, to which the amount of M1 formed in the presence of chemical inhibitors or inhibitory antibodies was normalized. Statistical analysis of α-NF activation data was performed by comparing the average M1 formation rate in the presence of α-NF with that in the presence of methanol for each pooled microsomal preparation and recombinant P450 using the Student’s t test (unpaired, two-tailed) (Prism 4.0, GraphPad Software, San Diego, CA); a P value <0.05 was considered significant. Eadie-Hofstee plots were generated from V0 versus V0/[DB289] data. For those HIM that exhibited monophasic Eadie-Hofstee plots, KMapp(1) and Vmax(1) values were obtained by fitting the Michaelis-Menten equation with the initial rate (V0) of M1 formation versus substrate concentration data by nonlinear regression analysis (Prism 4.0, GraphPad Software). Intrinsic clearance [CL′int(1)] was calculated by dividing Vmax(1) by KMapp(1). For those HIM that exhibited biphasic Eadie-Hofstee plots, the corresponding data were fitted to a function that was composed of two terms (Obach, 1997): V = ((Vmax(1) · [S]/(KMapp(1) + [S])) + CL′int(2) · [S]).
For the correlation analysis, M1 formation rates (3 μM DB289, 0.2 mg/ml HIM, 5-min incubation), 20-HETE formation rates, and 1′-hydroxymidazolam formation rates were measured in 11 individual HIM and one pooled HIM. Pearson correlation coefficients (r) were determined by plotting M1 formation rate versus 20-HETE or 1′-hydroxymidazolam formation rate; a P value <0.05 was considered significant.
Results
Phase I Biotransformation of DB289 in HIM
DB289 was incubated with pooled HIM in the presence of NADPH, and the Phase I metabolites were identified by HPLC/UV analysis with comparison to synthetic standards. Three metabolites (M1, M2, and M3) were identified, whereas M4 and the active diamidine DB75 were not detected up to 120 min (Fig. 1). Less than 10% of M1 was further metabolized within the first 15 min of incubation. Neither DB289 consumption nor metabolite formation was observed in control incubations without NADPH or HIM (data not shown).
Fig. 1.
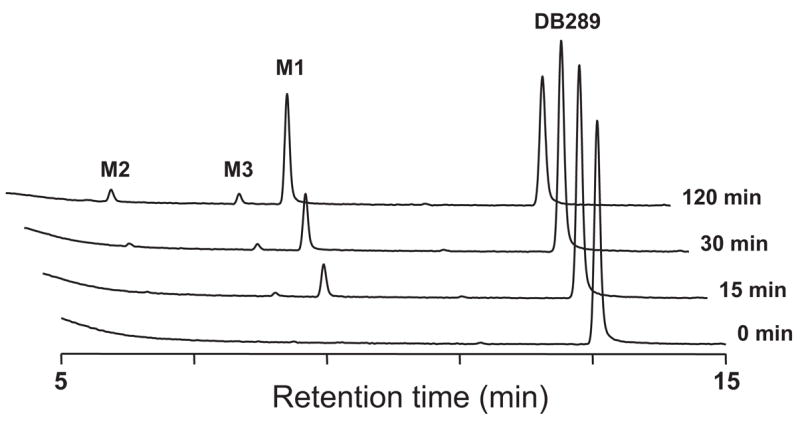
HPLC/UV chromatograms of DB289 (10 μM) incubated with the pooled HIM (0.2 mg/ml) for 0, 15, 30, and 120 min at 37°C in the presence of NADPH.
Kinetics of M1 Formation in HIM
The enzyme kinetics of the initial oxidative O-demethylation of DB289 (M1 formation) in the pooled HIM and nine individual HIM were determined and compared with HLM (Table 1). Because of the limited solubility of DB289 in the incubation buffer, the highest concentration tested was 25 μM. In HIM 32, 7, 30, 3, 12, and 31, the Eadie-Hofstee plots exhibited monophasic kinetics (data not shown). In HIM 2, 1, 23A, and pooled, the Eadie-Hofstee plots exhibited biphasic kinetics (data not shown). For these latter HIM, the corresponding data were fitted to a function comprising the sum of two terms (described under Materials and Methods). One term described the low Km component [KMapp(1) and Vmax(1)], and the other term described the high Km component [CL′int(2)]. The high Km component was best described using CL′ int(2) because of insufficient data to characterize the kinetics at high substrate concentrations. Overall, the KMapp(1) values for the nine individual HIM ranged from 0.6 to 2.4 μM and averaged 1.3 μM, which was comparable with the KMapp(1) value observed for the pooled HIM (0.7 μM) (Table 1). The total intrinsic clearance [CL′int(1) + CL′int(2)] of M1 formation by HIM ranged from 0.01 to 0.73 ml/min/mg protein, which was at most 10% of that observed for the pooled HLM (Table 1).
TABLE 1. Kinetic analysis of M1 formation rates in incubations of DB289 with HIM.
Incubation mixtures contained 0.1 to 0.2 mg/ml HIM and DB289 ranging from 0.05 to 25 μM. Reactions were carried out at 37°C for 5 min for all the HIM or 3 min for HLM. M1 formation rates were determined by HPLC/MS/MS analyses of duplicate incubations as described under Materials and Methods. Apparent kinetic parameters were derived from the equations as described under Materials and Methods. Results for HIM are arranged according to their intrinsic clearance values [CL′int(1)]. For comparison, kinetic parameters for pooled HLM (Wang et al., 2006) are also included.
| HIM
|
HLM Pooled | ||||||||||
|---|---|---|---|---|---|---|---|---|---|---|---|
| 32 | 7 | 2 | 30 | 3 | 1 | 12 | 23A | 31 | Pooled | ||
| KMapp(1) (μM) | 0.6 | 1.3 | 0.7 | 0.6 | 1.3 | 0.8 | 2.3 | 2.4 | 1.4 | 0.7 | 0.5 |
| Vmax(1) (nmol/min/mg protein) | 0.44 | 0.89 | 0.42 | 0.19 | 0.24 | 0.12 | 0.11 | 0.09 | 0.02 | 0.19 | 3.8 |
| CL′int(1) (ml/min/mg protein) | 0.73 | 0.68 | 0.6 | 0.32 | 0.18 | 0.15 | 0.05 | 0.04 | 0.01 | 0.27 | 7.6 |
| CL′int(2) (ml/min/mg protein) | N.D.a | N.D. | 0.01 | N.D. | N.D. | 0.002 | N.D. | 0.003 | N.D. | 0.01 | N.D. |
| Protein concentration (mg/ml) | 0.1 | 0.2 | 0.1 | 0.2 | 0.2 | 0.2 | 0.2 | 0.2 | 0.2 | 0.2 | 0.02 |
N.D., not determined because the corresponding Eadie-Hofstee plot exhibited monophasic enzyme kinetics.
Inhibition with P450 Chemical Inhibitors
The effects of P450 chemical inhibitors on M1 formation were determined with the pooled HIM (Fig. 2A). The pattern of inhibition was similar at a DB289 concentration of 0.3 μM or 3 μM. Therefore, only the results with 3 μM DB289 are shown. The nonselective inhibitor, ABT, inhibited M1 formation by 86%. Ketoconazole inhibited M1 formation by 66%. Diethyldithiocarbamate and troleandomycin marginally inhibited (~25%) M1 formation at the higher concentration examined. The remaining inhibitors had negligible effects on M1 formation, except for α-NF, which appeared to activate M1 formation by 43% (Fig. 2A). The apparent inhibitory/stimulatory effects of α-NF on M1 formation were further examined with a different lot of pooled HIM and compared with pooled HLM and selected recombinant P450s (Fig. 2B). α-NF activated M1 formation by the pooled HIM, CYP3A4, and CYP2J2 by 34, 120, and 55%, respectively (P < 0.05). The effects of α-NF on M1 formation by the pooled HLM, CYP4F2, and CYP4F3B were not significant (P > 0.05).
Fig. 2.
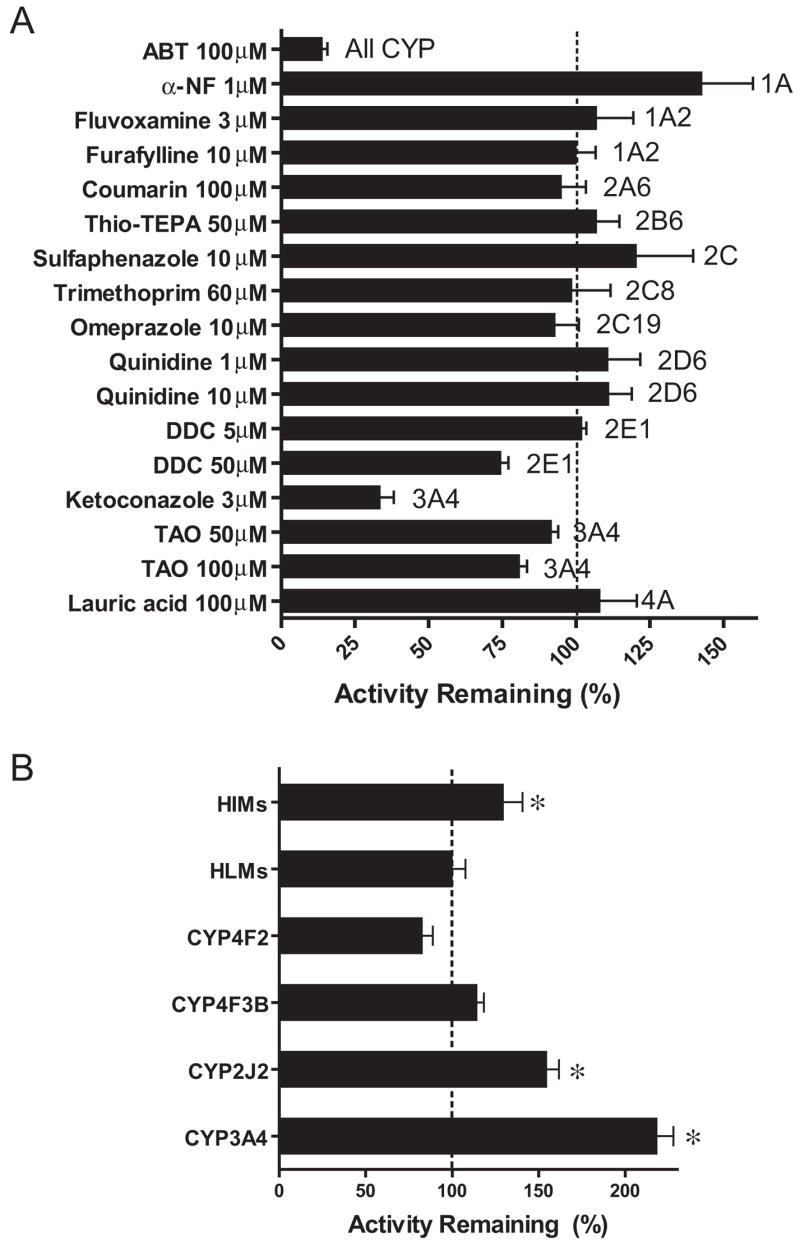
Inhibition of M1 formation in pooled HIM by P450 chemical inhibitors (A) and inhibition/activation of M1 formation in pooled HIM, HLM, recombinant CYP2J2, CYP4F2, CYP4F3B, and CYP3A4 by 1 μM α-NF (B). Incubation mixtures contained 0.2 mg/ml pooled HIM or HLM or 10 pmol/ml recombinant P450s, 3.0 μM DB289, and a chemical inhibitor at the indicated concentration. Reactions were carried out at 37°C for 5 min (15 min for recombinant CYP4F3B and CYP3A4). Control incubations contained methanol [0.4% (v/v)] in place of chemical inhibitors. Bars denote the means of duplicate (A) or triplicate (B) determinations and are expressed as percentage activity remaining relative to the control. Error bars denote the S.D. of triplicate determinations or the half of the difference between duplicate determinations. *, p < 0.05 (versus control).
Immunoinhibition of M1 Formation
The effects of polyclonal antibodies against CYP4F2 or CYP3A4/5 on M1 formation were determined with pooled HIM (Fig. 3A). The effects of a monoclonal antibody against CYP2J2 on M1 formation were also evaluated with pooled HIM (Fig. 3A), individual donor HIM-32 (high CL′int), HIM-2 (mid CL′int), HIM-23A (low CL′int), and recombinant CYP2J2 and CYP4F2 (Fig. 3B). The anti-CYP4F2 antibody, which inhibits both CYP4F2 and CYP4F3B (Wang et al., 2006), inhibited (79–92%) M1 formation by HIM at all three concentrations tested (Fig. 3A). In contrast, the anti-CYP3A4/5 antibody had no effect (Fig. 3A) despite inhibiting M1 formation by recombinant CYP3A4 (data not shown). The anti-CYP2J2 inhibited (95%) M1 formation by recombinant CYP2J2 (Fig. 3B) but not by either CYP4F2 (Fig. 3B) or the pooled HIM (Fig. 3A). When examined with the three individual donor HIM, the anti-CYP2J2 antibody (25 μl) showed minimal to moderate inhibition (14–28%) (Fig. 3B).
Fig. 3.
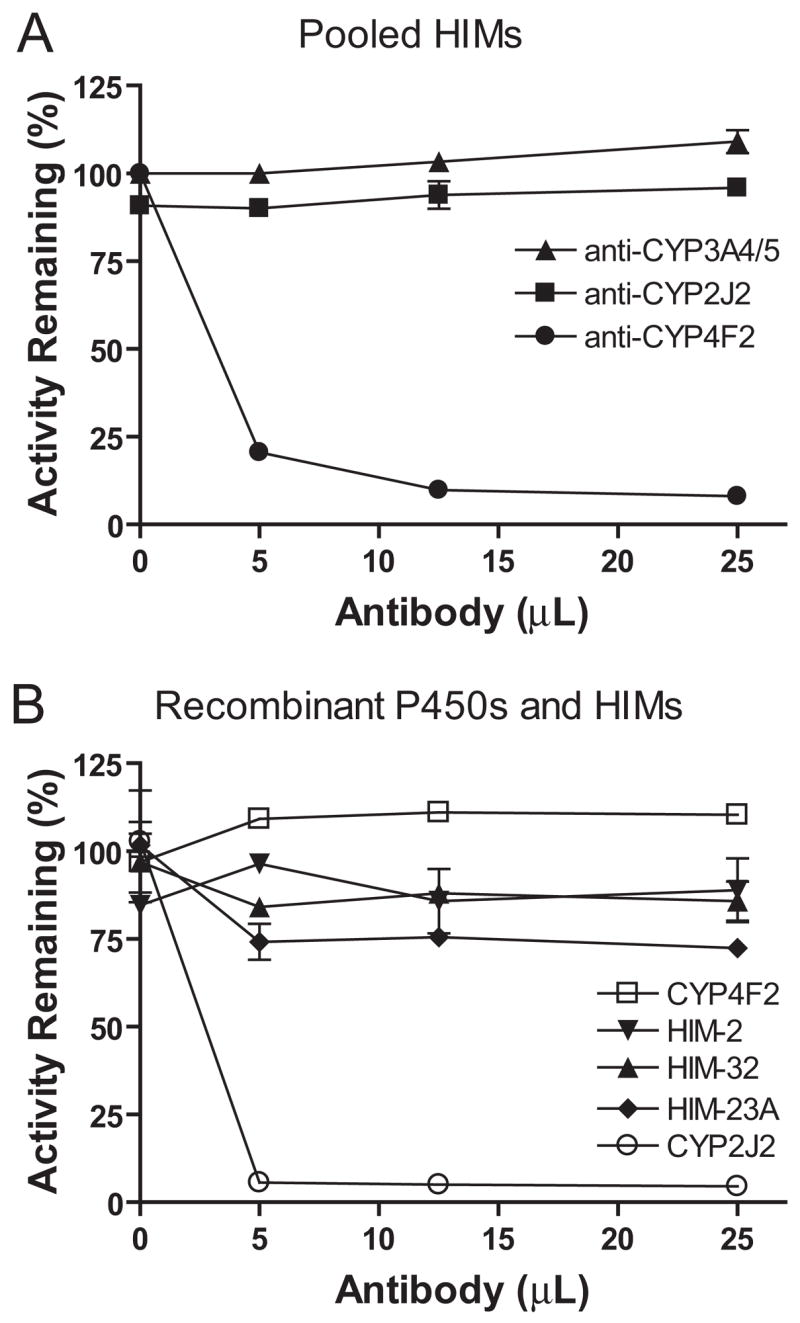
Immunoinhibition of M1 formation in incubations of DB289 with HIM and recombinant P450 enzymes. A, pooled HIM were incubated with a polyclonal antibody against CYP4F2 or CYP3A4/5 and a monoclonal antibody against CYP2J2. B, three individual HIM (2, 23A, and 32) and recombinant P450 enzymes (CYP2J2 and CYP4F2) were incubated with a monoclonal antibody against CYP2J2. Incubation mixtures (250 μl) contained 0.2 mg/ml HIM or 10 pmol/ml recombinant P450 enzyme, 3 μM DB289, and the indicated amounts of inhibitory antibodies. Reactions were carried out at 37°C for 5 min (15 min for donor 23A). Controls were run by substituting inhibitory antibodies with the corresponding volumes of preimmune IgG proteins to account for nonspecific protein binding. Symbols denote the means of duplicate determinations and are expressed as percentage activity remaining relative to the control. Error bars denote the half of the difference between duplicate determinations.
Identification of Metabolites of Arachidonic Acid Formed in HIM
Members of the CYP2 and CYP4 families are the primary mediators of the biotransformation of arachidonic acid to EET and HETE (Kroetz and Xu, 2005). CYP2C and CYP2J catalyze the epoxygenation pathway (EET formation), whereas CYP4A and CYP4F catalyze the ω-hydroxylation pathway (20-HETE formation) (Powell et al., 1998; Christmas et al., 2001; Kroetz and Xu, 2005; Kalsotra and Strobel, 2006). In addition, the Km for the formation of 20-HETE by CYP4A11 was reported to be 10-fold higher than that by CYP4F2 (Powell et al., 1998). Therefore, to evaluate 20-HETE formation as a potential marker reaction for enteric microsomal CYP4F activity, an HPLC/MS/MS assay was developed for the quantification of 20-HETE formed in HIM. Arachidonic acid metabolites formed by HIM (Fig. 4A) in the presence of NADPH were identified by comparing the retention times of products formed with those of authentic standards (Fig. 4, B and C). The predominant HPLC/MS/MS peak (SRM, 321.3 → 303.3) from the incubation mixtures (Fig. 4A) coe-luted with 20-HETE (Fig. 4C) and a peak believed to represent the δ-lactone of 5,6-dihydroxyeicosatrienoic acid (5,6-DHET), a degradation product of 5,6-EET (Zeldin et al., 1993), at 9.5 min (Fig. 4B) but not with any other standards examined, including 19-HETE, which eluted at 8.7 min (Fig. 4C). The identity of the predominant HPLC/MS/MS peak from the incubation mixtures was further confirmed as 20-HETE, not the δ-lactone of 5,6-DHET, because 20-HETE and the δ-lactone of 5,6-DHET eluted at different times (2.2 and 2.5 min, respectively) when analyzed by a shorter method using an Aquasil C18 column (described under Materials and Methods); moreover, no HPLC/MS/MS peak from the incubation mixtures was detected at the retention time of 2.5 min (data not shown). Therefore, the use of the shorter quantification method utilizing a nonspecific fragmentation of 20-HETE as described under Materials and Methods was justified for measuring 20-HETE formation by HIM.
Fig. 4.
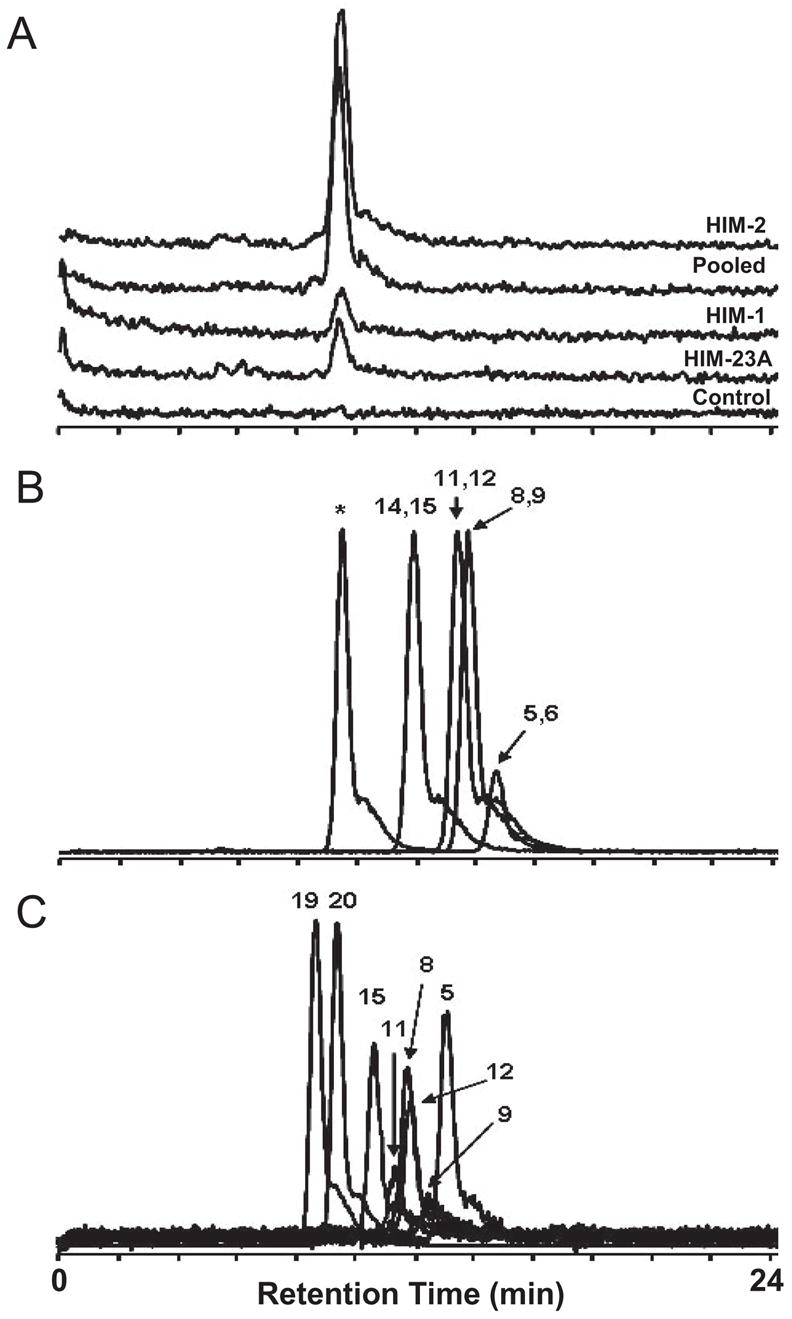
Representative HPLC/MS/MS chromatograms (A, scaled; SRM transition, 327.3 → 309.3) of arachidonic acid incubated with two HIM with high 20-HETE formation activity (pooled and HIM-2) and two HIM with low 20-HETE formation activity (HIM-1 and HIM-23A). Incubation mixtures contained 0.2 mg/ml HIM, 20 μM arachidonic acid, and 1 mM NADPH. Reactions were carried out for 30 min. Controls were run in the absence of NADPH. Arachidonic acid metabolites formed were separated on a Hypersil GOLD analytical column as described under Materials and Methods. Note that the pooled HIM originated from a lot different from that used in Fig. 5. HPLC/MS/MS chromatograms (overlaid; unscaled) of synthetic standards of EET (B) and HETE (C) were generated using the same method as above. The numbers denote the position of epoxy group (B) or hydroxyl group (C) on the synthetic standards. The asterisk denotes a peak that is believed to represent the δ-lactone of 5,6-DHET, a degradation product of 5,6-EET (Zeldin et al., 1993).
Interindividual Variability in M1 Formation by HIM and Correlation with 20-HETE Formation
M1 formation rates varied considerably (~30-fold) among the 11 individual HIM (Fig. 5A, left), ranging from 9.3 to 300 pmol/min/mg protein. The average value was comparable with that obtained with the pooled HIM (113 versus 132 pmol/min/mg protein). 20-HETE formation rates were determined for the same panel of HIM incubated with arachidonic acid (Fig. 5A, right), with an average (range) of 57 (8.6–157) pmol/min/mg protein. 20-HETE formation rate in the pooled HIM was 70 pmol/min/mg protein. M1 formation rates correlated strongly with 20-HETE formation rates (r2 = 0.94, P < 0.0001, n = 12) (Fig. 5B). In contrast, M1 formation rates did not correlate with CYP3A activity as determined by midazolam 1′-hydroxylation rates (r2 = 0.05, P = 0.50, n = 12) (data not shown).
Fig. 5.
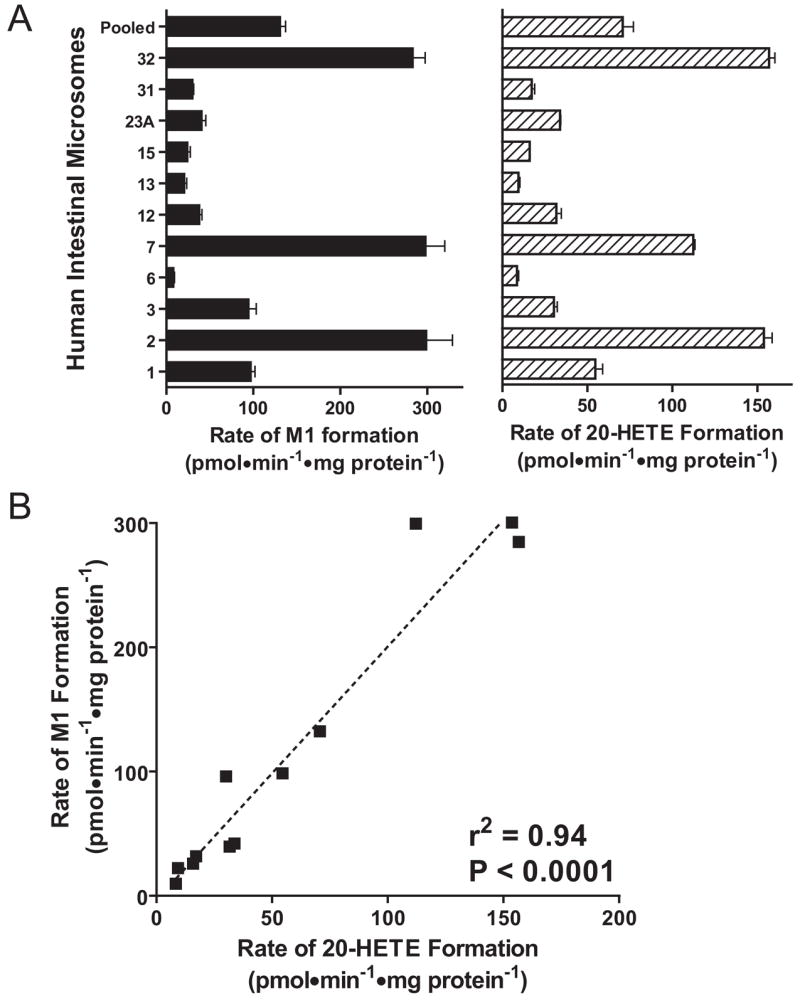
Interindividual variability in M1 formation rates (A, left) and 20-HETE formation rates (A, right) in a panel of 11 individual HIM and a pooled HIM, with the corresponding correlation (B). For M1 formation, incubation mixtures contained 0.2 mg/ml HIM and 3.0 μM DB289. For 20-HETE formation, incubation mixtures contained 0.2 mg/ml HIM and 20 μM arachidonic acid. Bars denote the means of duplicate determinations, and error bars denote half of the difference between duplicate determinations.
Western Blot Analysis of HIM
Immunoblots of the 11 individual donor HIM and one pooled HIM are shown in Fig. 6. A polyclonal antibody raised against CYP4F2 reacted similarly with both recombinant CYP4F2 and CYP4F3B (Fig. 6A, lanes 4 and 5), but it did not react with recombinant CYP3A4, CYP3A5, or CYP4A11 (Fig. 6A, lanes 1–3). The same antibody reacted with a protein of similar size in all 12 HIM (Fig. 6B). Immunoquantification using recombinant CYP4F2 as the calibration standard showed that CYP4F contents in these HIM ranged from 3 to 18 pmol/mg protein, with a mean of 7 pmol/mg protein. M1 formation rates correlated with CYP4F protein content (r2 = 0.46, P = 0.02, n = 12) (data not shown). CYP4A11 protein, which can catalyze arachidonic acid 20-HETE and 19-HETE formation (Powell et al., 1998), was not detected in any of the 12 HIM examined using a polyclonal antibody raised against CYP4A11 (Fig. 6C). This antibody also did not appear to cross-react with recombinant CYP4F2, CYP4F3B, CYP3A4, or CYP3A5 (Fig. 6C). A polyclonal antibody raised against a CYP2J2-specific peptide reacted with a protein of similar size as recombinant CYP2J2 in all 12 HIM examined. The estimated average CYP2J2 protein content (~1 pmol/mg protein) in these HIM was similar to that previously reported (Paine et al., 2006).
Fig. 6.

Western blot analysis of recombinant CYP3A4, CYP3A5, CYP4A11, CYP4F2, and CYP4F3B (A; 0.5 pmol of P450 loading per lane) and HIM (B; 15 μg of loading per lane) using a polyclonal antibody raised against CYP4F2. The same experiment was repeated with a polyclonal antibody against CYP4A11 (C). Quantitative Western blot analysis of CYP4F levels in HIM was achieved by comparing gel spot intensity with those of a series of concentrations of recombinant CYP4F2 (0.02–0.5 pmol) as described under Materials and Methods. A similar experiment was repeated with a polyclonal antibody raised against a CYP2J2-specific peptide (D; 30 μg of HIM per lane).
Inhibition of M1 Formation by Arachidonic Acid P450-Mediated Metabolism Inhibitors and Ebastine
The inhibitory effects of HET0016 (an arachidonic acid ω-hydroxylase inhibitor), 17-ODYA (a nonselective mechanism-based arachidonic acid ω-hydroxylase and epoxygenase inhibitor), ebastine (a CYP2J2, CYP4F12, and CYP3A4 substrate), and arachidonic acid (a CYP4F2, CYP4F3B, and CYP2J2 substrate) on M1 formation were examined for the pooled HIM (Fig. 7). HET0016 inhibited M1 formation in a concentration-dependent manner, by 60% to at least 95%, from 0.02 to 10 μM. 17-ODYA also inhibited M1 formation in a concentration-dependent manner, by 40 to 95%, from 0.2 to 100 μM. In contrast, ebastine showed negligible to marginal inhibition (<15%) at concentrations up to 10 μM, which is about 8-fold higher than the Km value (1.3 μM) reported by Hashizume et al. (2002) for recombinant CYP2J2. Although ebastine at 100 μM inhibited M1 formation by 70%, this concentration was shown to be nonselective (Wang et al., 2006). Arachidonic acid at 100 and 500 μM inhibited M1 formation by 40 and 75%, respectively.
Fig. 7.
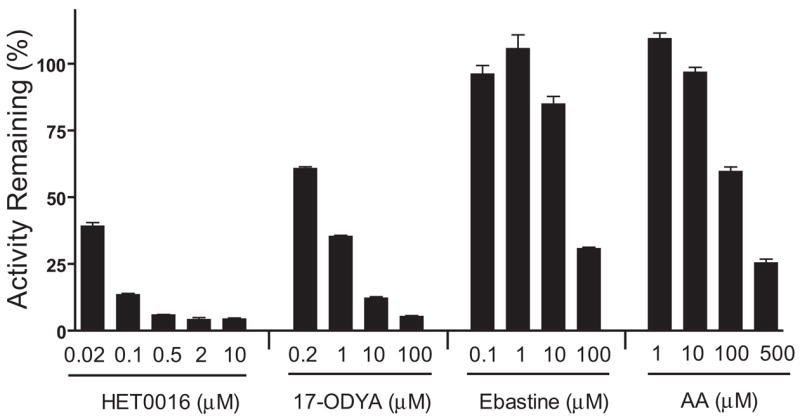
Inhibition of M1 formation in pooled HIM by HET0016, 17-ODYA, ebastine, and arachidonic acid (AA). Incubation mixtures contained 0.2 mg/ml HIM or 10 pmol/ml recombinant P450s, 3 μM DB289, and a chemical inhibitor at the indicated concentration. Reactions were carried out at 37°C for 5 min. The mechanism-based inhibitor, 17-ODYA, was preincubated with HIM and NADPH for 15 min before adding the substrate DB289. Controls were run with methanol [0.4% (v/v)] in place of chemical inhibitors. Bars denote the means of duplicate determinations and are expressed as percentage activity remaining relative to the control. Error bars denote the half of the difference between duplicate determinations.
Discussion
The systemic exposure of the promising antiparasitic prodrug DB289 varies considerably among individuals when given p.o. (CV of ~50% for area under the curve and Cmax), which could have clinical and/or toxicological implications. To evaluate whether intestinal first-pass metabolism could contribute to this large variation, we characterized a panel of HIM for the P450 enzymes that catalyze the initial O-demethylation of DB289 to M1. As recently shown with HLM (Wang et al., 2006), several lines of evidence indicate that in HIM, CYP4F enzymes are the major enzymes responsible for M1 formation. First, a polyclonal antibody raised against CYP4F2, which inhibited both recombinant CYP4F2 and CYP4F3B, inhibited M1 formation by HIM in a concentration-dependent manner (Fig. 3A). Second, in a panel of 11 individual HIM and one pooled HIM, formation rates of M1 strongly correlated with those of 20-HETE (Fig. 5B), the latter reaction of which we propose to be a specific marker reaction for enteric microsomal CYP4F activity (discussed below). Third, M1 formation rate showed a statistically significant, albeit weak, correlation with CYP4F protein content (r2 = 0.46, P = 0.02). Fourth, two arachidonic acid P450-mediated metabolism inhibitors, HET0016 and 17-ODYA, inhibited M1 formation by HIM in a concentration-dependent manner (Fig. 7).
In support of our conclusion that CYP4F enzymes are the major enzymes responsible for M1 formation by HIM, none of the other P450 chemical inhibitors evaluated (Fig. 2A), with the exceptions of ABT and ketoconazole, markedly inhibited M1 formation, arguing against roles for CYP1A, CYP2A6, CYP2B6, CYP2C, CYP2D6, CYP2E1, and CYP4A. Although HET0016 and 17-ODYA cannot distinguish CYP4F from CYP4A (Nguyen et al., 1999; Kehl et al., 2002; Xu et al., 2004), a negligible role for CYP4A in enteric M1 formation is further supported by the inability of recombinant CYP4A11 to catalyze M1 formation (Wang et al., 2006), the apparent lack of CYP4A11 protein expression in HIM (Fig. 6C), and the lack of inhibition of M1 formation by lauric acid (Fig. 2A), a competitive CYP4A inhibitor. The appreciable inhibition by ketoconazole was not diagnostic for a major role of CYP3A4/5 because this presumed selective CYP3A4/5 inhibitor has been shown to inhibit other P450s at low concentrations, including CYP4F2 (Wang et al., 2006), CYP1A1 (Paine et al., 1999), and CYP2J2 (Stresser et al., 2004). A minor role of CYP3A4/5 is further supported by 1) the minimal inhibitory effects of both the selective mechanism-based CYP3A4/5 inhibitor, troleandomycin, and a polyclonal antibody against CYP3A4/5; 2) the ≥30-fold higher intrinsic clearances of recombinant CYP4Fs for M1 formation compared with those of recombinant CYP3As (Wang et al., 2006); 3) the lack of correlation between M1 and 1′-hydroxymidazolam formation rates; and 4) a mild stimulatory effect of the known CYP3A activator, α-NF (Shou et al., 1994; Koley et al., 1997; Ueng et al., 1997). In addition to CYP3A4/5, CYP2J2 may also have a minor role in M1 formation by HIM, as evidenced by variable inhibitory effects (14–28%) of the monoclonal anti-CYP2J2 antibody, as well as a stimulatory effect of α-NF on recombinant CYP2J2. The lack of a selective chemical CYP2J2 inhibitor precludes definitive characterization of the contribution by CYP2J2.
Members of the CYP2 and CYP4 families have been shown to be the primary catalysts of the epoxygenation and ω-hydroxylation of arachidonic acid to form EET and 20-HETE, respectively. These products are involved in multiple biological processes, including regulation of vascular tone in a number of tissues (Kroetz and Xu, 2005). Whereas CYP2C and CYP2J enzymes catalyze the epoxygenation pathway, CYP4A and CYP4F enzymes catalyze the ω-hydroxylation pathway (Powell et al., 1998; Christmas et al., 2001; Kroetz and Xu, 2005; Kalsotra and Strobel, 2006). Moreover, the Km of 20-HETE formation by purified CYP4A11 was reported to be 10-fold higher than that for purified CYP4F2 (228 versus 24 μM) (Powell et al., 1998). These observations, combined with the current work showing a lack of, or low, levels of CYP4A11 protein expression in HIM (Fig. 6C) support our proposal that 20-HETE formation could be used as a marker reaction for enteric microsomal CYP4F activity.
Although CYP4F2 and CYP4F12 have been detected in the human small intestine by reverse transcription-polymerase chain reaction (Hashizume et al., 2001), to our knowledge, the detection and quantification of CYP4F protein in HIM has yet to be reported. Quantitative Western blot analysis of the current panel of HIM using a polyclonal antibody raised against CYP4F2 showed that, as with other enteric P450s, enteric CYP4F varies among individuals (range, 3–18 pmol/mg). In addition, average enteric CYP4F content was comparable with average enteric CYP2C9 content (7 versus 8.4 pmol/mg HIM), the latter of which constitutes ~15% of total immunoquantifiable P450s in HIM (Paine et al., 2006). Accordingly, CYP4F enzymes could represent an appreciable portion of the intestinal P450 “pie.”
CYP4F12 has been reported to contribute partially to the hydroxylation of the nonsedating antihistamine ebastine in HIM, with CYP2J2 as the predominant catalyst (Hashizume et al., 2002). We have shown previously that recombinant CYP4F12 is approximately 90-fold less efficient toward M1 formation than recombinant CYP4F2 based on intrinsic clearance values (Wang et al., 2006). Thus, we conclude that CYP4F12 is not the major enzyme responsible for M1 formation by HIM. However, the presence of CYP4F12 (and other CYP4F enzymes) in HIM could have confounded the immunoquantification of CYP4F and likely contributed to the relatively weak correlation observed between M1 formation rate and CYP4F protein content in HIM.
The complex biotransformation of DB289 to its active form, DB75, consists of three O-demethylation reactions and three N-dehydroxylation reactions (Saulter et al., 2005; Wang et al., 2006). After the initial O-demethylation to M1, M1 undergoes further O-demethylation to M2, as well as N-dehydroxylation to M3. Both M2 and M3 are then converted to M4 via N-dehydroxylation and O-demethylation, respectively. M4 undergoes further N-dehydroxylation to form the active diamidine DB75. The lack of the tertiary metabolite standard (M4) precludes the complete characterization of the entire Phase I pathway. In addition, DB289 and its Phase I metabolites have been shown to form Phase II conjugates, including glucuronides and sulfates, in rat hepatocytes (Zhou et al., 2004). However, little is known about the contribution of Phase II metabolism to the overall disposition of DB289 after p.o. administration, which merits further investigation to determine the rate-limiting step in the biotransformation of DB289.
The intrinsic clearance of M1 formation in HIM was at most one tenth of that in HLM, suggesting that enteric CYP4F-mediated M1 formation may not contribute significantly to the large interindividual variation observed in the systemic exposure of DB289 after p.o. administration. Although the 5- to 10-fold higher microsomal protein concentration in intestinal versus hepatic kinetic studies could have underestimated the true enteric intrinsic clearance, the estimated unbound fraction in intestinal (0.4–0.5) compared with liver (0.8) microsomes (unpublished observations) would translate to only a 2-fold increase in the intestinal intrinsic clearance relative to the hepatic intrinsic clearance.
Although enteric CYP4F-mediated M1 formation may not contribute significantly to the large interindividual variation in oral DB289 systemic exposure, a major contribution by other CYP4F-mediated reactions, as well as other enteric P450s, cannot be excluded. Preliminary observations indicated that CYP4F also catalyzes the O-demethylation of M1 to M2, whereas CYP3A can catalyze the O-demethylation of M3 to M4. Therefore, because enteric CYP3A can contribute significantly to the extent and variation in the first-pass metabolism of drugs, combined with the current work suggesting that CYP4F represents an appreciable portion of total intestinal P450 content, enteric P450-mediated metabolism could still represent an important source of the large interindividual variation observed in DB289 systemic exposure. In addition to metabolism, variation in the extent of absorption caused by formulation issues, as well as individual differences in active uptake and/or efflux transporters, could represent other sources, which warrant further investigation.
In conclusion, enteric CYP4F enzymes, as well as hepatic CYP4F enzymes, O-demethylate the antiparasitic prodrug DB289 to M1. Despite the considerably higher interindividual variation in M1 formation rates in HIM (~30-fold) compared with that in HLM (~4-fold), M1 formation by the intestine may not contribute significantly to the large interindividual variation observed in the systemic exposure of DB289 as a result of a limited intrinsic clearance capacity compared with the liver. However, the appreciable and variable expression of enteric CYP4F enzymes indicates that members of the CYP4F subfamily could play a role in determining the extent of intestinal first-pass metabolism of other drugs and xenobiotics after p.o. administration, as well as in other O-demethylation reactions involved in DB289 biotransformation.
Acknowledgments
We thank Professor Dave Boykin and Dr. Chad Stephens of Georgia State University for providing DB289 metabolites and deuterium-labeled DB289. We also thank Professor John R. Falck of the University of Texas Southwestern Medical Center at Dallas for providing synthetic standard for 19-HETE.
This study was supported by grants from the Bill and Melinda Gates Foundation, the Medicines for Malaria Venture, and the Division of Intramural Research of the National Institutes of Health, National Institute of Environmental Health Sciences.
ABBREVIATIONS
- DB75/furamidine
2,5-bis(4-amidinophenyl) furan
- DB289/pafuramidine
2,5-bis(4-amidinophenyl)furan-bis-O-methylamidoxime
- P450
cytochrome P450
- HLM
human liver microsome(s)
- HIM
human intestinal microsome(s)
- DB289-d8
deuterium-labeled DB289
- HETE
hydroxyeicosatetraenoic acid(s)
- 20-HETE
20-hydroxy-5Z,8Z,11Z,14Z-eicosatetraenoic acid
- EET
epoxyeicosatrienoic acid(s)
- 20-HETE-d6
deuterium-labeled 20-HETE
- 17-ODYA
17-octadecynoic acid
- HET0016
N-hydroxy-N′-(4-n-butyl-2-methylphenyl)formamidine
- HPLC
high-performance liquid chromatography
- α-NF
α-naphthoflavone
- ABT
1-aminobenzotriazole
- MS/MS
tandem mass spectrometry
- SRM
selected reaction monitoring
- CV
coefficient of variation
- DHET
dihydroxyeicosatrienoic acid
Footnotes
Article, publication date, and citation information can be found at http://dmd.aspetjournals.org.
References
- Barrett MP, Boykin DW, Brun R, Tidwell RR. Human African trypanosomiasis: pharmacological re-engagement with a neglected disease. Br J Pharmacol. 2007 doi: 10.1038/sj.bjp.0707354. in press. [DOI] [PMC free article] [PubMed] [Google Scholar]
- Bell CA, Hall JE, Kyle DE, Grogl M, Ohemeng KA, Allen MA, Tidwell RR. Structure-activity relationships of analogs of pentamidine against Plasmodium falciparum and Leishmania mexicana amazonensis. Antimicrob Agents Chemother. 1990;34:1381–1386. doi: 10.1128/aac.34.7.1381. [DOI] [PMC free article] [PubMed] [Google Scholar]
- Boykin DW, Kumar A, Hall JE, Bender BC, Tidwell RR. Anti-pneumocystis activity of bis-amidoximes and bis-O-alkylamidoximes prodrugs. Bioorg Med Chem Lett. 1996;6:3017–3020. [Google Scholar]
- Christmas P, Jones JP, Patten CJ, Rock DA, Zheng Y, Cheng SM, Weber BM, Carlesso N, Scadden DT, Rettie AE, et al. Alternative splicing determines the function of CYP4F3 by switching substrate specificity. J Biol Chem. 2001;276:38166–38172. doi: 10.1074/jbc.M104818200. [DOI] [PubMed] [Google Scholar]
- Das BP, Boykin DW. Synthesis and antiprotozoal activity of 2,5-bis(4-guanylphenyl)furans. J Med Chem. 1977;20:531–536. doi: 10.1021/jm00214a014. [DOI] [PubMed] [Google Scholar]
- Doua F, Yapo FB. Human trypanosomiasis in the Ivory Coast: therapy and problems. Acta Trop. 1993;54:163–168. doi: 10.1016/0001-706x(93)90090-x. [DOI] [PubMed] [Google Scholar]
- Hashizume T, Imaoka S, Hiroi T, Terauchi Y, Fujii T, Miyazaki H, Kamataki T, Funae Y. cDNA cloning and expression of a novel cytochrome P450 (cyp4f12) from human small intestine. Biochem Biophys Res Commun. 2001;280:1135–1141. doi: 10.1006/bbrc.2000.4238. [DOI] [PubMed] [Google Scholar]
- Hashizume T, Imaoka S, Mise M, Terauchi Y, Fujii T, Miyazaki H, Kamataki T, Funae Y. Involvement of CYP2J2 and CYP4F12 in the metabolism of ebastine in human intestinal microsomes. J Pharmacol Exp Ther. 2002;300:298–304. doi: 10.1124/jpet.300.1.298. [DOI] [PubMed] [Google Scholar]
- Kalsotra A, Strobel HW. Cytochrome P450 4F subfamily: at the crossroads of eicosanoid and drug metabolism. Pharmacol Ther. 2006;112:589–611. doi: 10.1016/j.pharmthera.2006.03.008. [DOI] [PubMed] [Google Scholar]
- Kehl F, Cambj-Sapunar L, Maier KG, Miyata N, Kametani S, Okamoto H, Hudetz AG, Schulte ML, Zagorac D, Harder DR, et al. 20-HETE contributes to the acute fall in cerebral blood flow after subarachnoid hemorrhage in the rat. Am J Physiol Heart Circ Physiol. 2002;282:H1556–H1565. doi: 10.1152/ajpheart.00924.2001. [DOI] [PubMed] [Google Scholar]
- King LM, Ma J, Srettabunjong S, Graves J, Bradbury JA, Li L, Spiecker M, Liao JK, Mohrenweiser H, Zeldin DC. Cloning of CYP2J2 gene and identification of functional polymorphisms. Mol Pharmacol. 2002;61:840–852. doi: 10.1124/mol.61.4.840. [DOI] [PubMed] [Google Scholar]
- Koley AP, Buters JT, Robinson RC, Markowitz A, Friedman FK. Differential mechanisms of cytochrome P450 inhibition and activation by alpha-naphthoflavone. J Biol Chem. 1997;272:3149–3152. doi: 10.1074/jbc.272.6.3149. [DOI] [PubMed] [Google Scholar]
- Kroetz DL, Xu F. Regulation and inhibition of arachidonic acid omega-hydroxylases and 20-HETE formation. Annu Rev Pharmacol Toxicol. 2005;45:413–438. doi: 10.1146/annurev.pharmtox.45.120403.100045. [DOI] [PubMed] [Google Scholar]
- Midgley I, Fitzpatrick K, Taylor LM, Houchen TL, Henderson SJ, Wright SJ, Cybulski ZR, John BA, McBurney A, Boykin DW, et al. Pharmacokinetics and metabolism of the prodrug DB289 (2,5-bis[4-(N-methoxyamidino)phenyl]furan monomaleate) in rat and monkey and its conversion to the antiprotozoal/antifungal drug DB75 (2,5-bis(4-guanylphenyl)furan dihydrochloride) Drug Metab Dispos. 2007;35:955–967. doi: 10.1124/dmd.106.013391. [DOI] [PubMed] [Google Scholar]
- Nguyen X, Wang MH, Reddy KM, Falck JR, Schwartzman ML. Kinetic profile of the rat CYP4A isoforms: arachidonic acid metabolism and isoform-specific inhibitors. Am J Physiol. 1999;276:R1691–R1700. doi: 10.1152/ajpregu.1999.276.6.R1691. [DOI] [PubMed] [Google Scholar]
- Obach RS. Nonspecific binding to microsomes: impact on scale-up of in vitro intrinsic clearance to hepatic clearance as assessed through examination of warfarin, imipramine, and propranolol. Drug Metab Dispos. 1997;25:1359–1369. [PubMed] [Google Scholar]
- Paine MF, Hart HL, Ludington SS, Haining RL, Rettie AE, Zeldin DC. The human intestinal cytochrome P450 “pie”. Drug Metab Dispos. 2006;34:880–886. doi: 10.1124/dmd.105.008672. [DOI] [PMC free article] [PubMed] [Google Scholar]
- Paine MF, Schmiedlin-Ren P, Watkins PB. Cytochrome P-450 1A1 expression in human small bowel: interindividual variation and inhibition by ketoconazole. Drug Metab Dispos. 1999;27:360–364. [PubMed] [Google Scholar]
- Powell PK, Wolf I, Jin R, Lasker JM. Metabolism of arachidonic acid to 20-hydroxy-5,8,11, 14-eicosatetraenoic acid by P450 enzymes in human liver: involvement of CYP4F2 and CYP4A11. J Pharmacol Exp Ther. 1998;285:1327–1336. [PubMed] [Google Scholar]
- Saulter JY, Kurian JR, Trepanier LA, Tidwell RR, Bridges AS, Boykin DW, Stephens CE, Anbazhagan M, Hall JE. Unusual dehydroxylation of antimicrobial amidoxime prodrugs by cytochrome b5 and NADH cytochrome b5 reductase. Drug Metab Dispos. 2005;33:1886–1893. doi: 10.1124/dmd.105.005017. [DOI] [PubMed] [Google Scholar]
- Shou M, Grogan J, Mancewicz JA, Krausz KW, Gonzalez FJ, Gelboin HV, Korzekwa KR. Activation of CYP3A4: evidence for the simultaneous binding of two substrates in a cytochrome P450 active site. Biochemistry. 1994;33:6450–6455. doi: 10.1021/bi00187a009. [DOI] [PubMed] [Google Scholar]
- Stresser DM, Broudy MI, Ho T, Cargill CE, Blanchard AP, Sharma R, Dandeneau AA, Goodwin JJ, Turner SD, Erve JC, et al. Highly selective inhibition of human CYP3A in vitro by azamulin and evidence that inhibition is irreversible. Drug Metab Dispos. 2004;32:105–112. doi: 10.1124/dmd.32.1.105. [DOI] [PubMed] [Google Scholar]
- Tidwell RR, Jones SK, Geratz JD, Ohemeng KA, Bell CA, Berger BJ, Hall JE. Development of pentamidine analogues as new agents for the treatment of Pneumocystis carinii pneumonia. Ann N Y Acad Sci. 1990;616:421–441. doi: 10.1111/j.1749-6632.1990.tb17862.x. [DOI] [PubMed] [Google Scholar]
- Ueng YF, Kuwabara T, Chun YJ, Guengerich FP. Cooperativity in oxidations catalyzed by cytochrome P450 3A4. Biochemistry. 1997;36:370–381. doi: 10.1021/bi962359z. [DOI] [PubMed] [Google Scholar]
- Wang MZ, Saulter JY, Usuki E, Cheung YL, Hall M, Bridges AS, Loewen G, Parkinson OT, Stephens CE, Allen JL, et al. CYP4F enzymes are the major enzymes in human liver microsomes that catalyze the O-demethylation of the antiparasitic prodrug DB289 [2,5-bis(4-amidinophenyl)furan-bis-O-methylamidoxime] Drug Metab Dispos. 2006;34:1985–1994. doi: 10.1124/dmd.106.010587. [DOI] [PMC free article] [PubMed] [Google Scholar]
- Werbovetz K. Diamidines as antitrypanosomal, antileishmanial and antimalarial agents. Curr Opin Investig Drugs. 2006;7:147–157. [PubMed] [Google Scholar]
- Xiao YF, Ke Q, Seubert JM, Bradbury JA, Graves J, Degraff LM, Falck JR, Krausz K, Gelboin HV, Morgan JP, et al. Enhancement of cardiac L-type Ca2+ currents in transgenic mice with cardiac-specific overexpression of CYP2J2. Mol Pharmacol. 2004;66:1607–1616. doi: 10.1124/mol.104.004150. [DOI] [PubMed] [Google Scholar]
- Xu F, Falck JR, Ortiz de Montellano PR, Kroetz DL. Catalytic activity and isoform-specific inhibition of rat cytochrome P450 4F enzymes. J Pharmacol Exp Ther. 2004;308:887–895. doi: 10.1124/jpet.103.059626. [DOI] [PubMed] [Google Scholar]
- Zeldin DC, Kobayashi J, Falck JR, Winder BS, Hammock BD, Snapper JR, Capdevila JH. Regio- and enantiofacial selectivity of epoxyeicosatrienoic acid hydration by cytosolic epoxide hydrolase. J Biol Chem. 1993;268:6402–6407. [PubMed] [Google Scholar]
- Zhou L, Lee K, Thakker DR, Boykin DW, Tidwell RR, Hall JE. Enhanced permeability of the antimicrobial agent 2,5-bis(4-amidinophenyl) furan across Caco-2 cell monolayers via its methylamidoxime prodrug. Pharm Res. 2002;19:1689–1695. doi: 10.1023/a:1020957430400. [DOI] [PubMed] [Google Scholar]
- Zhou L, Thakker DR, Voyksner RD, Anbazhagan M, Boykin DW, Hall JE, Tidwell RR. Metabolites of an orally active antimicrobial prodrug, 2,5-bis(4-amidinophenyl)furan-bis-O-methylamidoxime, identified by liquid chromatography/tandem mass spectrometry. J Mass Spectrom. 2004;39:351–360. doi: 10.1002/jms.591. [DOI] [PubMed] [Google Scholar]