Abstract
Conformational changes in ras p21 triggered by the hydrolysis of GTP play an essential role in the signal transduction pathway. The path for the conformational change is determined by molecular dynamics simulation with a holonomic constraint directing the system from the known GTP-bound structure (with the γ-phosphate removed) to the GDP-bound structure. The simulation is done with a shell of water molecules surrounding the protein. In the switch I region, the side chain of Tyr-32, which undergoes a large displacement, moves through the space between loop 2 and the rest of the protein, rather than on the outside of the protein. As a result, the charged residues Glu-31 and Asp-33, which interact with Raf in the homologous RafRBD–Raps complex, remain exposed during the transition. In the switch II region, the conformational changes of α2 and loop 4 are strongly coupled. A transient hydrogen bonding complex between Arg-68 and Tyr-71 in the switch II region and Glu-37 in switch I region stabilizes the intermediate conformation of α2 and facilitates the unwinding of a helical turn of α2 (residues 66–69), which in turn permits the larger scale motion of loop 4. Hydrogen bond exchange between the protein and solvent molecules is found to be important in the transition. Possible functional implications of the results are discussed.
Keywords: constrained molecular dynamics, molecular signals, GTP, phosphate hydrolysis
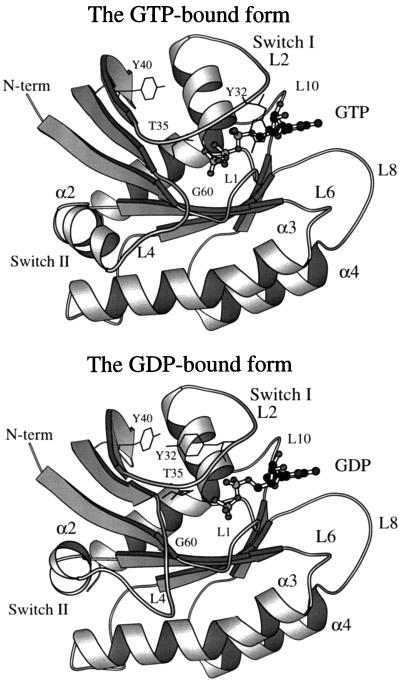
Ras proteins play a pivotal role in the signal transduction pathways that control proliferation, differentiation, and metabolism (1, 2). They act as switches by cycling between the GDP-bound inactive form and the GTP-bound active form, which have large but relatively localized conformational differences (3, 4). The major changes occur in two regions that have been called molecular switch I (residues 30–38, mainly composed of loop 2) and switch II (residues 60–76, which consists of helix 2 and loop 4). The switch I region overlaps with the effector region (residues 32–40) (5). A schematic representation of the GTP-bound and GDP-bound structures is shown in Fig. 1.
Figure 1.
Schematic representation of GTP- and GDP-bound structures; the structures are 5p21 (27) and 1q21 (28) in the Protein Data Bank. The nucleotides are represented by a ball-and-stick model. The side chains of Tyr-32 and Tyr-40 are shown to focus on an important conformational difference in the switch I region. This figure was generated with the molscript program (42).
Without external activation, ras p21 is found to be mainly in the GDP-bound form (6). It is activated by the binding of the guanine nucleotide exchange factor (GEF), which stimulates the exchange of GDP with GTP (7). Because the concentration of GTP in the cell is much higher than that of GDP, such exchange effectively turns on the growth signal. In its active GTP-bound form, ras p21 interacts with different effector molecules (8). ras p21 is deactivated by the hydrolysis of GTP and the resulting conformational change of molecular switch I and II to that of the inactive GDP-bound form. The hydrolysis reaction can take place due to the weak intrinsic GTPase activity of ras p21 (9) or it can be accelerated by the binding of the GTPase-activating protein (GAP) (10).
One of the identified effectors of ras p21 is a Ser/Thr-specific protein kinase, Raf, a product of the c-raf protooncogene (11–14). It is involved in the mitogen-activated protein (MAP) kinase pathway (Raf/Mek/ERK pathway). The three-dimensional structure of the Ras-binding domain (RBD) of c-Raf-1 (one of three Raf isoforms, c-Raf-1, B-Raf, and A-Raf) has been solved by NMR spectroscopy (15), and the complex between RBD and Rap1A has been determined by x-ray crystallography (16). The effector region of Rap1A is similar to ras p21. A recent crystal structure of a complex (17) between a Rap mutant (called Raps, RapE30D, K31E) and RafRBD provides detailed structural information about the interface, which is thought to have the same structure as that of the Ras-RafRBD complex. One consequence of the conformational change from the GTP-bound to the GDP-bound form is believed to be a decrease in affinity between ras p21 and RafRBD (5). The active effector-free ras p21 molecule may either activate another effector or interact with GAP so as to be deactivated by GTP hydrolysis (6). Binding of effector and GAP is mutually exclusive (5, 6, 8). A full description of the nature of the conformational change induced by the hydrolysis of γ-phosphate is thus important for an understanding of its function.
Although a normal mode and energy minimization analysis has shown how the initial stages of the changes are triggered by the release of the γ-phosphate (18), simulation of the complete pathway from the GTP-bound to the GDP-bound form is essential as a complement to the various experimental efforts, including time-resolved x-ray crystallographic studies (19–25). From the two end-point structures, it is known that, unlike the rigid body rotation of the active site “lid” in triosephosphate isomerase (26), the conformational change of ras p21 in the switch I region involves significant internal rearrangements of the protein backbone (18) and, in the switch II region, there are secondary structure changes that include unwinding of a helical turn (residues 66–69) in going from the GTP-bound to the GDP-bound form (4). The secondary structure transition implies that solvent molecules may play an important role, with an exchange of hydrogen bonds between the water and protein.
The aim of this work is to determine possible paths for the switch I and II regions in going from the GTP-bound form to the GDP-bound form (27, 28). We employ the targeted molecular dynamics (TMD) method (29) in the presence of a complete solvent shell (18). This approach is particularly useful for complicated structural changes (e.g., the helix unwinding) and inclusion of solvent.
METHODS
For a conformational transition, we denote the initial state as I and the final state as F. The coordinates corresponding to a given conformation a are defined by a vector, xa = (x1a, x2a, … , x3Na), where N is the number of atoms in the system and the xi represents the components of the Cartesian coordinates, with x1, x2, and x3 associated with atom 1, and so on. The square of the distance, η, between two conformations a and b is
 |
1 |
In the TMD method (29), a molecular dynamics simulation is performed with the standard molecular mechanics potential (30) supplemented by a time-dependent holonomic constraint of the form
 |
2 |
where x is an instantaneous configuration, xT is the selected target structure, and η is the desired squared distance between the two. A leapfrog numerical integration scheme (29) was used to implement TMD in the charmm program (30). The final conformation, F, is used as the target xT. By slowly decreasing η during a molecular dynamics simulation, the system is led to evolve from the initial conformational state I to the final state F.
The wild-type GTP-bound form (PDB code 5p21) (27) and wild-type GDP-bound form (PDB code 1q21) (28) were used as the end-point structures. In addition, 400 flexible TIP3P water molecules (31) were included as the solvent; this is the water shell used for the normal mode analysis (18). To mimic the effect of the hydrolysis of the γ-phosphate, the GTP in the GTP-bound form was changed to GDP by removing the γ-phosphate. The structure with the solvation shell was used as conformation I in the simulation; the final structure F was the GDP-bound structure. The coordinates used to define the constraint included the atoms of the protein, the bound GDP nucleotide, the Mg2+ ion in the binding site, and two water molecules bound to it; the water molecules are needed to stabilize the ion (18). The solvent molecules were allowed to move freely and follow the dynamics of protein. This procedure is an effective way of simulating a conformational change in the presence of explicit solvent. The transition from the GTP-bound form to the GDP-bound form was performed in 200 ps. It was found that the qualitative features of the reaction path were relatively insensitive to the “pulling” speed introduced by the constraint once the transition time was longer than 50 ps.
The transitions of switch I and II were simulated together and independently to isolate their characteristics. In each case, the GDP structure of the region of interest (switch I or II or both) was modelled into the GTP-bound structure with the γ-phosphate removed. Careful initial energy minimizations and equilibration dynamics (especially for the solvation shell) for both the starting structure and the target structure were performed to ensure the minimal structure disturbance in the initial and final states; i.e., uninteresting differences due to crystal contacts etc. are eliminated so as to avoid distortion of the reaction path. Further, the equilibration dynamics was performed in such a way that each structure is equilibrated under a TMD constraint with the RMS distance equal to the initial rms distance between two structures. To keep the temperature constant during the transition, the system was connected to a heat bath with the Berendsen algorithm (32); the relaxation time of heat bath was taken as 0.02 ps and the temperature was kept near 300 K. To avoid the rotation of the structure caused by the constraining force, the target structure was least-square aligned to the moving coordinates each 0.1 ps. Regions that have small conformational differences in crystal structures were included in the alignment; they are residues 1–25, 39–59, 77–121, and 125–166. The TMD simulation was stopped when the rms between a coordinate set and the target structure was equal to 0.3 Å. A dynamics step size of 0.5 fs was used with the all-hydrogen potential function (param22) in the charmm program (30).
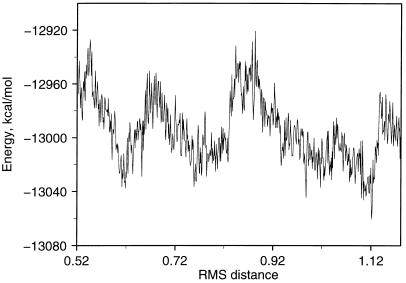
The energy along the transition path for switch I is shown in Fig. 2. Although the energy cannot be interpreted in a simple manner because of the constraint on the system, the fact that no barriers higher than 60 kcal/mol occur suggests that the path is meaningful: e.g., in the simulations of the insulin T to R transition by Schlitter et al. (29), barriers on the order of 45 kcal/mol were observed.
Figure 2.
Potential energy of entire system (including water) during the transition for the switch I region; the coordinate represents the root-mean-square (RMS) distance in Å from the target structure. One kilocalorie = 4.18 kJ.
RESULTS
The simulation in which both the switch I and switch II regions were treated together showed that initially Gly-60 moves away from the nucleotide, which is as expected because of the removal of the γ-phosphate with which the main-chain NH group of Gly-60 interacts. The major change in the switch I region (e.g., motion of Tyr-32, see below) follows and is essentially completed before the full transition in the switch II region has taken place. There is some coupling between the transitions due to the interaction between Glu-37 of switch I and Arg-68 and Tyr-71 of switch II, as described below. In what follows, we describe the results for the independent transition of each switch region to simplify the analysis.
Molecular Switch I.
In the transition of the switch I region, the main chain of loop 2 undergoes a large displacement as a result of alteration of its internal dihedral angles (18). One important conformational difference between the GTP-bound and the GDP-bound form is the reorientation of the side chain of Tyr-32 (3, 4, 8, 33), which is an essential residue; the conservative mutation Tyr-32 → Phe abolishes the activity of ras p21 (34). In the GTP-bound form, this residue lies across the nucleotide binding pocket (27), and in the GDP-bound form, it is oriented away from the binding pocket and forms a hydrogen bond with the side chain of Tyr-40 (see Fig. 1) (28). The side chain of Tyr-32 was found to be highly mobile even in the GTP-bound form (25). On the basis of the Raps–Raf GTP crystal structure for the complex, it was speculated that the motion of the Tyr-32 side chain upon the hydrolysis of the γ-phosphate destabilizes the electrostatic interaction of two of its neighboring residues (Glu-31 and Asp-33) with Lys-84 of Raf by inducing a conformational change in these two residues (see figure 2 in ref. 8). In addition, the side chains of the residues Thr-35 and Ile-36 also have significant displacements as part of the loop motion.
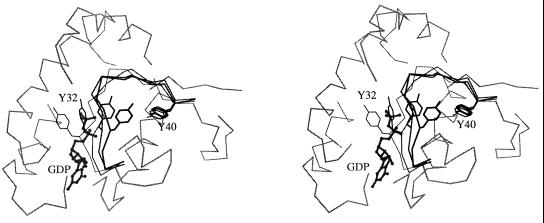
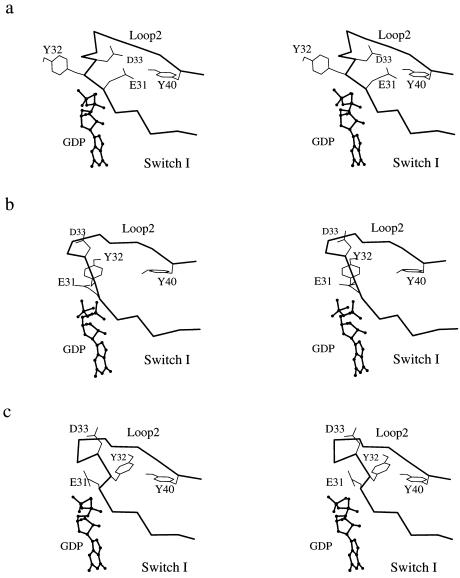
Fig. 3 shows the evolution of the calculated positions of the side chain of Tyr-32, Tyr-40, and loop 2 during the transition dynamics. It is found that the side chain of Tyr-32 moves through a crevice under loop 2 (i.e., between loop 2 and the rest of the protein), rather than through space on the outside of the protein. The direction of the Tyr-32 motion is in accord with that observed in the normal mode analysis (18), and the main-chain dihedral angles (φ and ψ) of Tyr-32 remains in the low-energy α region of the Ramachandran plot during the transition (data not shown). Such a path is likely to have a low free energy because the relatively hydrophobic side chain of Tyr-32 remains buried; the hydroxyl group of Tyr-32 interacts with one of the Mg+2-bound water molecules during the transition before it forms a hydrogen bond to Tyr-40. The motion of the side chain of Tyr-32 is coupled with that of two of its neighboring residues, Glu-31 and Asp-33. Fig. 4 shows the evolution of the relative positions of the side chains of these three residues during the transition dynamics. The side chains of Glu-31 and Asp-33 remain exposed to solvent and move through the space above the loop away from their positions in the GTP-bound structure, where they can interact with Lys-84 of Raf (also see figure 2 in ref. 8).
Figure 3.
Stereoview of the evolution of the switch I region. The backbone positions of the switch I region (in darker gray) obtained at different times are shown superimposed on each other; the thickness (darkness) of the lines increases during the transition. The GDP nucleotide is represented by a ball-and-stick model and the side chains of Tyr-32 and Tyr-40 are included for comparison with Fig. 1. The part of the α-carbon trace that overlaps with the Tyr-32 side chain is omitted for clarity.
Figure 4.
Stereoviews showing the change of the relative orientation of the Glu-31, Tyr-32, and Asp-33 side chains in the switch I region during the transition. (a) Beginning of the path. (b) Intermediate state. (c) Near the end of the path. The nucleotide is represented by a ball-and-stick model.
Molecular Switch II.
Although there is considerable disorder in the x-ray structures for the switch II region, there are several features that appear to be characteristic of the conformational change (3, 4). After the hydrolysis of GTP, the N-terminal portion of loop 4, especially Gly-60, moves away from the nucleotide and the α2 helix, located in the C-terminal part of the switch II region (residues 65–74), undergoes a significant rotation. There is also an unwinding of a helical turn of α2 (residues 66–69). These features of the transition are observed in other GTP-binding proteins, which indicates that they are an important part of the transition (for a review, see ref. 33).
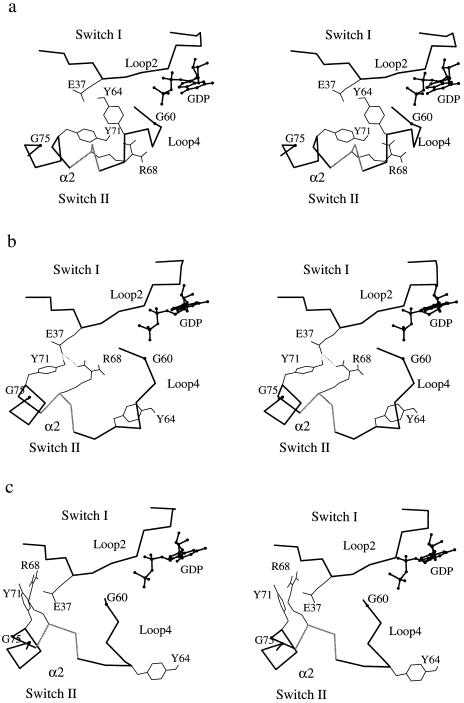
The calculated pathway for the conformational change in the switch II region was found to begin with the separation of Gly-60 from the nucleotide. As suggested by the x-ray structural data and in accord with the normal mode analysis (18), this is triggered by the loss of the hydrogen bond between the main-chain-NH group of Gly-60 and the γ-phosphate after the GTP hydrolysis. There is then a rotation of the α2 helix. As a consequence, the polar side chains of Arg-68 and Tyr-71, which point in very different directions in the GTP and GDP-bound structures (Fig. 5a), move into positions where both form transient hydrogen bonds with a carboxyl oxygen of Glu-37, a residue in the switch I region (Fig. 5b). This complex temporarily stabilizes the system as the 66–69 helical turn unwinds (segment in gray in Fig. 5). The coil region produced by unwinding of the helix facilitates the larger-scale motion of loop 4, which results in a very different orientation for Tyr-64 (35). The conformational change of switch II is completed by the dissociation of the transient hydrogen bonding complex (Fig. 5c). The side chains of two other polar residues of α2, Asp-69 and Gln-70, which are partly exposed to solvent in the GTP-bound form, are also affected by the rotation of α2 and are more completely solvated in the GDP-bound form (27, 28) (results not shown).
Figure 5.
Stereoviews of the evolution of the switch II region. Peptide segments of both switch I and II are shown. The peptide segment 66–69 is represented in gray and the nucleotide (GDP) is represented by a ball-and-stick model. The orientations of key residues are indicated. (a) Beginning of the path. (b) Along the path. (c) At the end of path. The transient hydrogen bonds are denoted by dotted lines. The relatively shortened image of loop 4 in d is due to the fact that this peptide segment has moved into the background in the GDP-bound crystal structure (28).
Solvation Effect.
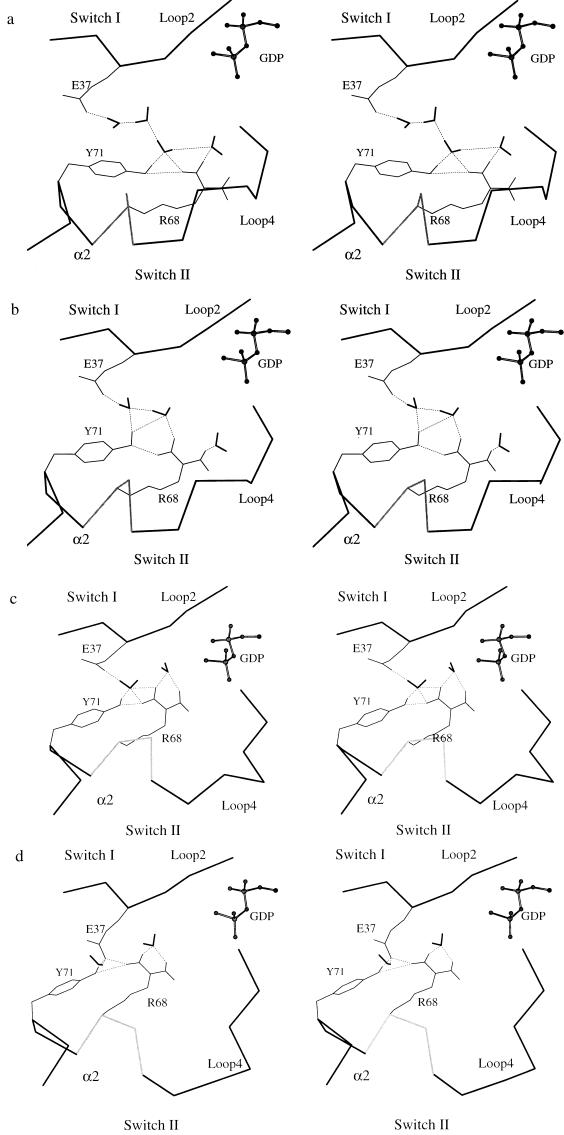
It is generally recognized that water molecules play an important role in the dynamics of proteins (36). Along the transition path, there are several rearrangements of hydrogen bonding networks involving the solvent shell. They include exchanges between water–water, water–protein, and protein–protein hydrogen bonds. As one interesting example, we show in Fig. 6 the time evolution of the hydrogen-bonding network of the polar side chains of the three important amino acids discussed above—i.e., Glu-37, Arg-68, and Tyr-71. In the early stage of the transition, a long-range water bridge between the side chain of Glu-37 in switch I and Arg-68 and Tyr-71 in switch II was observed (see Fig. 6a). As the transition proceeds and the α2 helix rotates, there is a decrease in the number of water molecules bridging the side chains—i.e., there are three bridging waters in Fig. 6a, two in Fig. 6b, one in Fig. 6c, and none in Fig. 6d, where there are direct hydrogen bonds between Glu-37 and Tyr-71 and Arg-68. One water remains hydrogen bonded to Glu-37 and one to Arg-68. This result suggests that the exchange of hydrogen bonds is important for the energetics and for maintaining the correct conformation of the polar side chains along the reaction path. Since there is rapid equilibration of hydrogen bonds between different partners (often on a subnanosecond time scale), a relatively low energy barrier is expected for this structural transition. Similar hydrogen bond exchange was observed during the unwinding of the helical turn in α2. The nascent opening of a main chain polar-group hydrogen bond is found to be balanced by bridging water molecules, as in simulations of protein denaturation (37).
Figure 6.
Stereoviews of the evolution of the water-mediated hydrogen-bonding network during transition in the switch II region. (a) Beginning of the path. (b, c, and d) Along the path. Part of GDP, represented by a ball-and-stick model, is also shown.
CONCLUDING DISCUSSION
The reaction path of the conformational change of ras p21 from the GTP-bound form to the GDP-bound form with a solvation shell has been determined by the TMD method. The complete transition path is found to be an extension of the initial motion found by a normal mode analysis (18).
In the switch I region, the reaction path involves the reorientation of the side chain of Tyr-32 through the space between loop 2 and the main protein matrix, rather than on the outside of the protein surface. This path has a consequence that the charged residues Glu-31 and Asp-33, which interact with the RafRBD in the homologous RafRBD–Raps complex, remain exposed during the transition. It would be interesting to determine whether the transition could be blocked by introducing a bulky group to prevent the motion of Tyr-32. In the switch II region, the conformational changes of α2 and loop 4 were found to be strongly coupled. A transient hydrogen bonding complex between two residues in switch II (Arg-68 and Tyr-71) and a residue in switch I (Glu-37) was observed during the rotation of α2. This complex temporary stabilizes the intermediate conformation of α2 and facilitates the unwinding of an N-terminal helix turn (residues 66–69) of α2, which in turn permits the larger-scale motion of loop 4. The hydrogen bond exchange between solvent molecules and protein is important for the transition.
The rotation of α2 is likely to be functionally important because mutations (e.g., Ala-66, Gly-75) indicate that it is implicated in binding of the guanine nucleotide exchange factor (GEF) (38). The difference in the orientations of polar side chains such as Arg-68 and Tyr-71 on α2 between the GTP and GDP forms of ras p21 may be involved in modulating the binding to GEF. Evidence for the significance of α2 rotation also comes from the fact that the Gly-75 mutant fails to accumulate Ras–GTP during the process of exchange of GDP with GTP (38–40). The transient complex structure formed between α2 in switch II and Glu-37 in switch I may participate in destabilizing the interaction between ras p21 and its effector Raf; i.e., it may keep the side chain of Glu-37, one of the key residue in the interaction between ras p21 and Raf (8), in a conformation that disfavors the binding.
Acknowledgments
We thank Prof. J. Schlitter for helpful discussion of the TMD method. This work was supported by a grant from the National Institutes of Health and a grant from the National Science Foundation Pittsburgh Super Computing (PSC) Center. J.M. is a Burroughs Wellcome Program in Mathematics and Molecular Biology postdoctoral fellow.
ABBREVIATIONS
- RBD
Ras-binding domain
- TMD
targeted molecular dynamics
Note
After the work reported here was completed, a study of the ras p21 conformational change based on the TMD method was reported (41). The details of the model and the analysis of the results are significantly different, so that the two studies are complementary.
References
- 1.Barbacid M. Annu Rev Biochem. 1987;56:779–827. doi: 10.1146/annurev.bi.56.070187.004023. [DOI] [PubMed] [Google Scholar]
- 2.Lowy D R, Willumsen B M. Annu Rev Biochem. 1993;62:851–891. doi: 10.1146/annurev.bi.62.070193.004223. [DOI] [PubMed] [Google Scholar]
- 3.Milburn M V, Tong L, deVos A M, Brünger A, Yamaizumi Z, Nishimura S, Kim S H. Science. 1990;247:939–945. doi: 10.1126/science.2406906. [DOI] [PubMed] [Google Scholar]
- 4.Wittinghofer A, Pai E. Trends Biochem Sci. 1991;16:382–387. doi: 10.1016/0968-0004(91)90156-p. [DOI] [PubMed] [Google Scholar]
- 5.McCormick F, Wittinghofer A. Curr Opin Biotech. 1996;7:449–456. doi: 10.1016/s0958-1669(96)80123-6. [DOI] [PubMed] [Google Scholar]
- 6.Wittinghofer A, Herrmann C. FEBS Lett. 1995;369:52–56. doi: 10.1016/0014-5793(95)00667-x. [DOI] [PubMed] [Google Scholar]
- 7.Feig L A. Curr Opin Cell Biol. 1994;6:204–211. doi: 10.1016/0955-0674(94)90137-6. [DOI] [PubMed] [Google Scholar]
- 8.Wittinghofer A, Nassar N. Trends Biochem Sci. 1996;21:488–491. doi: 10.1016/s0968-0004(96)10064-5. [DOI] [PubMed] [Google Scholar]
- 9.Gibbs J B, Sigal I S, Poe M, Scolnick E M. Proc Natl Acad Sci USA. 1984;81:5704–5708. doi: 10.1073/pnas.81.18.5704. [DOI] [PMC free article] [PubMed] [Google Scholar]
- 10.McCormick F. Cell. 1989;56:5–8. doi: 10.1016/0092-8674(89)90976-8. [DOI] [PubMed] [Google Scholar]
- 11.Van Aelst L, Barr M, Marcus S, Polverino A, Wigler M. Proc Natl Acad Sci USA. 1993;90:6213–6217. doi: 10.1073/pnas.90.13.6213. [DOI] [PMC free article] [PubMed] [Google Scholar]
- 12.Vojtek A B, Hollenberg S M, Cooper J A. Cell. 1993;74:205–214. doi: 10.1016/0092-8674(93)90307-c. [DOI] [PubMed] [Google Scholar]
- 13.Zhang X F, Settleman J, Kyriakis J M, Takeuchi-Suzuki E, Elledge S J, Marshall M S, Bruder J T, Rapp U R, Avruch J. Nature (London) 1993;364:308–313. doi: 10.1038/364308a0. [DOI] [PubMed] [Google Scholar]
- 14.Warne P H, Viciana P R, Downward J. Nature (London) 1993;364:352–355. doi: 10.1038/364352a0. [DOI] [PubMed] [Google Scholar]
- 15.Emerson D S, Madison V S, Palermo R E, Waugh D S, Scheffler J E, Tsao K L, Kiefer S E, Liu S P, Fry D C. Biochemistry. 1995;34:6911–6918. doi: 10.1021/bi00021a001. [DOI] [PubMed] [Google Scholar]
- 16.Nassar N, Horn G, Herrmann C, Scherer A, McCormick F, Wittinghofer A. Nature (London) 1995;375:1995. doi: 10.1038/375554a0. [DOI] [PubMed] [Google Scholar]
- 17.Nassar N, Horn G, Herrmann C, Block C, Wittinghofer A. Nat Struct Biol. 1996;3:723–729. doi: 10.1038/nsb0896-723. [DOI] [PubMed] [Google Scholar]
- 18.Ma, J. & Karplus, M. (1997) Mol. Biol., in press.
- 19.Schlichting I, Rapp G, John J, Wittinghofer A, Pai E F, Goody R S. Proc Natl Acad Sci USA. 1989;86:7687–7690. doi: 10.1073/pnas.86.20.7687. [DOI] [PMC free article] [PubMed] [Google Scholar]
- 20.Johnson L N. Nature (London) 1990;345:294–295. doi: 10.1038/345294a0. [DOI] [PubMed] [Google Scholar]
- 21.Schlichting I, Almo S C, Rapp G, Wilson K, Petratos K, Lentfer A, Wittinghofer A, Kabsch W, Pai E F, Petsko G A, Goody R S. Nature (London) 1990;345:309–315. doi: 10.1038/345309a0. [DOI] [PubMed] [Google Scholar]
- 22.Scheidig A J, Pai E F, Schlichting I, Corrie J, Reid G P, Wittinghofer A, Goody R S. Philos Trans R Soc London A. 1992;340:263–272. doi: 10.1098/rstb.1992.0037. [DOI] [PubMed] [Google Scholar]
- 23.Scheffzek K, Kabsch W, Schlichting I, Pai E F, Lautwein A, Frech M, Wittinghofer A, Goody R S. Acta Crystallogr D. 1994;50:521–526. doi: 10.1107/S0907444994001253. [DOI] [PubMed] [Google Scholar]
- 24.Scheidig A, Sanchez-Llorente A, Lautwein A, Pai E F, Corrie J E T, Reid G, Wittinghofer A, Goody R S. Acta Crystallogr D. 1994;50:512–520. doi: 10.1107/S090744499301443X. [DOI] [PubMed] [Google Scholar]
- 25.Geyer M, Schweins T, Herrmann C, Prisner T, Wittinghofer A, Kalbitzer H R. Biochemistry. 1996;35:10308–10320. doi: 10.1021/bi952858k. [DOI] [PubMed] [Google Scholar]
- 26.Joseph D, Petsko G A, Karplus M. Science. 1990;249:1425–1428. doi: 10.1126/science.2402636. [DOI] [PubMed] [Google Scholar]
- 27.Pai E F, Krengel U, Petsko G A, Goody R S, Kabsch W, Wittinghofer A. EMBO J. 1990;9:2351–2359. doi: 10.1002/j.1460-2075.1990.tb07409.x. [DOI] [PMC free article] [PubMed] [Google Scholar]
- 28.Tong L, de Vos A M, Milburn V, Kim S H. J Mol Biol. 1991;217:503–516. doi: 10.1016/0022-2836(91)90753-s. [DOI] [PubMed] [Google Scholar]
- 29.Schlitter J, Engels M, Krüger P, Jacoby E, Wollmer A. Mol Simul. 1993;11:291–309. [Google Scholar]
- 30.Brooks B R, Bruccoleri R E, Olafson B D, States D J, Swaminathan S, Karplus M. J Comput Chem. 1983;4:187–217. [Google Scholar]
- 31.Dang L X, Pettitt B M. J Phys Chem. 1987;91:3349–3354. [Google Scholar]
- 32.Berendsen H J C, Postma J P M, van Gunsteren W F, DiNola A, Haak J R. J Chem Phys. 1984;81:3684–3690. [Google Scholar]
- 33.Kjeldgaard M, Nyborg J, Clark B F. FASEB J. 1996;10:1347–1368. [PubMed] [Google Scholar]
- 34.Marshall M S. Trends Biochem Sci. 1993;18:250–254. doi: 10.1016/0968-0004(93)90175-m. [DOI] [PubMed] [Google Scholar]
- 35.Stouten P F W, Sander C, Wittinghofer A, Valencia A. FEBS Lett. 1993;320:1–6. doi: 10.1016/0014-5793(93)81644-f. [DOI] [PubMed] [Google Scholar]
- 36.Brooks C L, Karplus M, Pettitt B M. Adv Chem Phys. 1988;71:1–249. [Google Scholar]
- 37.Caflisch A, Karplus M. Proc Natl Acad Sci USA. 1994;91:1746–1750. doi: 10.1073/pnas.91.5.1746. [DOI] [PMC free article] [PubMed] [Google Scholar]
- 38.Howe L R, Marshall C J. Oncogenes. 1993;8:2583–2590. [PubMed] [Google Scholar]
- 39.Fasano O, Crechet J B, Vendittis D, Zahn R, Feger G, Vitelli A C, Parmeggiani A. EMBO J. 1988;7:3375–3383. doi: 10.1002/j.1460-2075.1988.tb03210.x. [DOI] [PMC free article] [PubMed] [Google Scholar]
- 40.Kavounis C, Verrotti A C, Vendittis E D, Bozopoulos A, Blasi F D, Zahn R, Crechet J B, Parmeggiani A, Tsernoglou D, Fasano O. FEBS Lett. 1991;281:235–239. doi: 10.1016/0014-5793(91)80401-n. [DOI] [PubMed] [Google Scholar]
- 41.Díaz J F, Wroblowski B, Schlitter J, Engelborghs Y. Proteins. 1997;28:434–451. [PubMed] [Google Scholar]
- 42.Kraulis P J. J Appl Crystallogr. 1991;24:946–950. [Google Scholar]


