

Abstract
Reduced P3 amplitude has been consistently linked to a spectrum of externalizing disorders. Utilizing data from a large sample of adolescent male twins (N = 1196), we used biometric modeling to assess the genetic and environmental contributions to the association between reduced P3 amplitude and a general vulnerability to externalizing disorders. Externalizing vulnerability was indexed by a composite of symptoms of conduct disorder, adult antisocial behavior, and alcohol, nicotine, and drug dependence. The sample included two independent age cohorts, providing an internal replication of the findings. For the best-fitting model, genetic influences alone accounted for the association between P3 amplitude and externalizing disorders, with an estimated genetic correlation of rg = −.22. Results replicated across the two age cohorts and demonstrate that reduced P3 amplitude is a marker of the biological vulnerability to externalizing disorders.
Descriptors: P3 amplitude, Externalizing disorders, Substance abuse, Antisocial behavior, Genetics, Heritability
Over the past 20 years, a substantial body of research has established a link between alcoholism and reduced amplitude of the P3 (third positive) component of the brain event-related potential (Polich, Pollock, & Bloom, 1994; Porjesz, Begleiter, Bihari, & Kissin, 1987). Reduced P3 amplitude is associated not only with active symptoms of alcoholism, but also with risk for alcoholism. Specifically, prior to the onset of drinking, reduced P3 has been demonstrated in sons of alcoholics in comparison to controls without a family history of alcoholism (Begleiter, Porjesz, Bihari, & Kissin, 1984). Additionally, reduced P3 amplitude prospectively predicts the emergence of later alcohol problems in persons asymptomatic at the time of the baseline assessment (Iacono, Carlson, Malone, & McGue, 2002). These lines of evidence support the hypothesis that reduced P3 amplitude is a biological risk marker or endophenotype for alcoholism, that is, a laboratory measure of nervous system activity whose genetic underpinnings overlap with the genetic risk factors associated with alcoholism (Begleiter & Porjesz, 1999; Iacono, 1998).
Other research, however, has demonstrated that reduced P3 amplitude is associated not only with alcoholism but with other psychiatric disorders characterized by behavioral disinhibition, including illicit drug dependence (Bauer, 2001; Biggins, MacKay, Clark, & Fein, 1997; Brigham, Moss, Murrelle, Kirisci, & Spinelli, 1997), nicotine dependence (Anokhin et al., 2000), and child and adult antisocial behavior (Bauer & Hesselbrock, 1999, 2001, 2003; Costa et al., 2000; Hesselbrock, Bauer, O’Connor, & Gillen, 1993). In a rather comprehensive analysis, Iacono et al. (2002) reported the associations between P3 amplitude and several psychiatric disorders in a large community sample of adolescent male twins, and found reduced P3 amplitude was associated with a spectrum of substance use and disinhibited behavior disorders, including alcohol dependence, illicit drug dependence, nicotine dependence, attention-deficit/hyperactivity disorder, oppositional defiant disorder, conduct disorder, and antisocial personality disorder (ASPD). Additionally, persons with comorbid conditions evinced the greatest reduction in P3 amplitude, and lower P3 amplitude at age 17 predicted the development of these disorders at age 20. Furthermore, fathers’ diagnostic status on disinhibitory disorders was also associated with reduced P3 amplitude in their adolescent sons, indicating a familial association between P3 and externalizing tendencies. These results provide strong evidence that reduced P3 amplitude is a marker for disinhibitory syndromes in general rather than for alcoholism specifically.
These results are also consistent with epidemiological investigations that have identified a broad risk factor, typically referred to as Externalizing, that accounts for comorbid relations among disinhibitory disorders (Krueger, 1999; Krueger, Caspi, Moffitt, & Sliva, 1998). Large-sample twin studies have since shown that this general vulnerability to externalizing disorders is primarily attributable to genetic influences, and that this general vulnerability accounts for the majority of the genetic risk factors associated with each disorder in the spectrum (Kendler, Prescott, Myers, & Neale, 2003; Krueger et al., 2002; Young, Stallings, Corley, Krauter, & Hewitt, 2000). In addition, heritability estimates for the general vulnerability factor (h2 = .81–.85) are notably greater than heritability estimates for individual disorders (h2 = .35–.60; Fu et al., 2002; Heath et al., 1997; Jacobson, Prescott, & Kendler, 2002; Kendler, Jacobson, Prescott, & Neale, 2003; Lyons et al., 1995; Slutske et al., 1998; Tsuang et al., 1998; van den Bree, Svikis, & Pickens, 1998). These findings, which indicate that this general vulnerability accounts for much of the genetic risk associated with individual externalizing disorders, suggest that this Externalizing factor might also account for associations between specific disinhibitory disorders and biological markers such as P3 amplitude.
Patrick et al. (2006) directly tested the hypothesis that reduced P3 amplitude is a marker for the general vulnerability to externalizing disorders. Using a measure of the Externalizing factor consisting of scores on the first principal component extracted from symptoms of alcohol and drug dependence, conduct disorder, and adult antisocial behavior (the adult criteria for ASPD), these investigators found that: (1) reduced P3 amplitude was significantly related to scores on this factor indexing the general vulnerability to externalizing disorders, and (2) scores on this broad factor accounted for associations between the individual disorders and P3 amplitude (i.e., no residual association with any individual disorder was significant after variance in the general factor was included in a prediction model). These results further demonstrate that the association between reduced P3 amplitude and alcoholism is nonspecific, that is, it arises from the fact that alcoholism is one indicator of a general vulnerability to externalizing disorders.
The present investigation extends the findings of Patrick et al. (2006) by delineating the genetic and environmental contributions to the association between P3 amplitude and the general vulnerability to externalizing disorders. Although the research on P3 amplitude as a biological marker of externalizing disorders rests on the assumption of a common genetic diathesis (Begleiter & Porjesz, 1999; Iacono, 1998), the hypothesis that the relation between the two is mediated by genes has yet to be directly tested. The primary reason is that such an analysis requires a genetically informative sampling design entailing large samples of individuals with varying degrees of genetic relatedness (e.g., monozygotic [MZ] and dizygotic [DZ] twins; Neale & Cardon, 1992).
The current investigation was intended to fill this gap in the literature. The sample for the current study consisted of 1196 male twins—a sample size large enough to provide reliable and accurate parameter estimates of the heritability of P3 amplitude as well as the magnitude of its overlap with the genetic risk for externalizing disorders (Neale & Cardon, 1992). In addition, the sample included two, nonoverlapping age cohorts of approximately equal size, both drawn from the community—providing for an internal replication of findings that enhances the likelihood that the results will generalize to the population.
On the basis of previous findings, we predicted that P3 amplitude and the general vulnerability to externalizing disorders would each be highly heritable (Katsanis, Iacono, McGue, & Carlson, 1997; Kendler, Prescott, et al., 2003; Krueger et al., 2002;Young et al., 2000). Our second, crucial prediction was that most if not all of the association between P3 amplitude and the general vulnerability to externalizing disorders would be attributable to genetic factors. Finally, consistent with studies that have examined associations between single-gene markers and psychiatric disorders (e.g., Faraone, Doyle, Mick, & Biederman, 2001; Faraone et al., 2005), we predicted that P3 amplitude would account for a modest, but reliable (i.e., replicable) portion of the overall genetic variance for the general vulnerability to externalizing disorders.
Method
Participants
Participants were adolescent male twins who participated in the Minnesota Twin Family (MTFS). The MTFS is a longitudinal study of twins and their parents living in the state of Minnesota that is investigating the development of substance abuse and related psychopathology. A comprehensive description of the MTFS has been provided elsewhere (Iacono, Carlson, Taylor, Elkins, & McGue, 1999; Iacono, Malone, & McGue, 2003). The MTFS sample is composed of two age cohorts: a younger cohort initially recruited the year the twins turned 11 years old, and an older cohort recruited the year the twins turned 17 years old. Public birth records were used to identify families that included a twin pair born in the years 1972–1978 in the case of the 17-year-old cohort and the years 1978–1982 in the case of the 11-year-old cohort. Zygosity was determined by the agreement of three estimates: (1) a standard zygosity questionnaire completed by parents, (2) evaluation by MTFS staff of physical similarity based on eye, hair, face, and ear characteristics, and (3) similarity on fingerprint ridge count, cephalic index, and ponderal index. If the three estimates did not agree, a serological analysis was conducted using DNA markers. Twins return at roughly 3-year intervals for follow-up assessments.
For the present investigation, data were collected when members of both cohorts were at a similar age, specifically, the intake assessment for the 17-year-old cohort (M = 17.0, SD = 0.5) and the second follow-up assessment for the 11-year old cohort (M = 18.5, SD = 0.8). All study protocols and data collection methods remained consistent across the intake and second follow- up assessments. The current investigation included 598 male twin pairs (396 MZ pairs, 202 DZ pairs; total N = 1196 individuals). Approximately equal numbers were drawn from each cohort: 309 twin pairs (208MZpairs, 101 DZ pairs) from the age 11 cohort, and 289 twin pairs (188MZ pairs, 101DZ pairs) from the age 17 cohort. Consistent with the demographics of Minnesota during the years the twins were born, almost all are Caucasian (98%). Informed assent or consent was obtained as appropriate, and an internal review board approved all study procedures and protocols.
Diagnostic Assessment
For participants in each of the two cohorts, lifetime presence of DSM-III-R (American Psychiatric Association, 1987) disorders was assessed via in-person, structured clinical interviews at our Minneapolis laboratories. Members of each twin pair were assessed concurrently by separate interviewers. Interviewers had either a Bachelor’s or Master’s degree in psychology and completed extensive training in DSM assessment procedures. An expanded version of the Substance Abuse Module of the Composite International Diagnostic Interview (Robins, Baber, & Cottler, 1987) was used to assess symptoms of nicotine dependence, alcohol dependence, and illicit drug dependence. Drug classes included amphetamines, cannabis, cocaine, inhalants, opioids, PCP, and sedatives. The substance for which the participant reported the maximal number of symptoms was used for their drug dependence variable. An interview designed by MTFS staff (Holdcraft, Iacono, & McGue, 1998) was used to assess symptoms of conduct disorder and adult antisocial behavior (i.e., the adult criteria for ASPD). The mother of each twin pair was also interviewed using the parent version of the Diagnostic Interview for Children and Adolescents (Reich, 2000) and reported on the presence of symptoms in her children for conduct disorder and all substance use disorders. A symptom was considered present if reported by either them other or twin.
A team of at least two clinical psychology graduate students with extensive training in descriptive psychopathology and differential diagnosis reviewed all interview data in a case conference to determine the presence or absence of all symptoms. Consensus between the two diagnosticians was reached prior to assigning symptoms. This consensus process yielded the following kappa reliabilities: .81 for conduct disorder, .95 for adult antisocial behavior, and>.91 for all substance disorders. Prevalence rates and mean symptom levels for the MTFS samples are available in previous reports (e.g., Iacono et al., 2003; Krueger et al., 2002; Patrick et al., 2006).
A composite Externalizing score was calculated via a principal components analysis of the symptom counts of alcohol dependence, nicotine dependence, drug dependence, conduct disorder, and adult antisocial behavior. A normalizing (Blom) transformation was applied to correct for positive skew in the distributions of the scores of each of the indicators of the general externalizing vulnerability. The first principal component accounted for 61% of the variance among the five indicators (all remaining components had an eigenvalue less than 1) and yielded the following loadings: .85 adult antisocial behavior, .68 conduct disorder, .81 alcohol dependence, .78 nicotine dependence, and .78 drug dependence.
Psychophysiological Assessment
We used the rotated-heads visual oddball task of Begleiter et al. (for a graphic depiction, see Patrick et al., 2006, Figure 1), a procedure that has yielded robust P3 effects in alcohol risk studies. Each of the 240 stimuli comprising this task was presented on a computer screen for 98 ms, with the intertrial interval (ITI) varying randomly between 1 and 2 s. A small dot, upon which subjects were instructed to fixate, appeared in the center of the screen during the ITI. On two-thirds of the trials, participants saw a plain oval to which they were instructed not to respond. On the remaining third of the trials, participants saw a superior view of a stylized head, depicting the nose and one ear. Participants were instructed to press one of two response buttons attached to each arm of the chair in which they were seated to indicate whether the ear was on the left side of the head or the right. Half of these “target” trials consisted of heads with the nose pointed up, such that the left ear would be on the left side of the head as it appeared to the subject (easy discrimination). Half consisted of heads rotated 180° so that the nose pointed down, such that the left ear would appear on the right side of the screen and the right ear would appear on the left side of the screen (hard discrimination).
Figure 1.
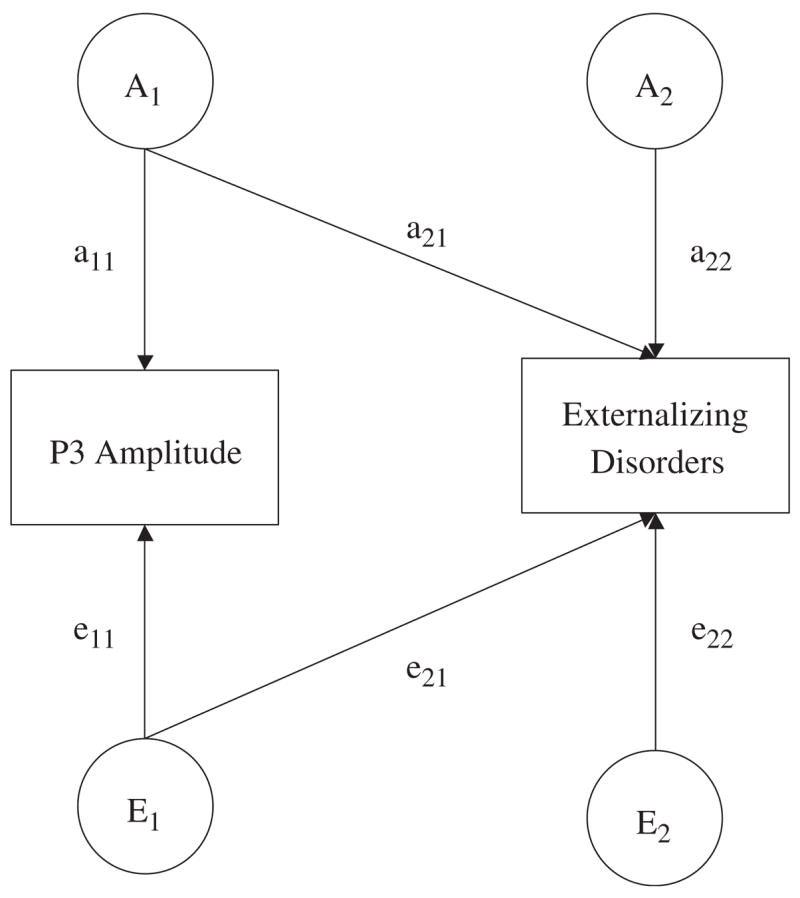
Path diagram of an AE Cholesky model (C factors have been excluded for ease of presentation) for P3 amplitude and a composite measure of symptoms of externalizing disorders. The variance in each observed variable is parsed into that which is attributable to latent additive genetic (A1 and A2) and nonshared environmental effects (E1 and E2).
Recording procedure
All participants completed the assessment at approximately the same time in the morning. Participants sat in a comfortable high-backed chair while electroencephalographic (EEG) data were recorded from three parietal scalp locations, one on the midline (Pz) and one over each hemisphere (P3 and P4). Linked earlobes served as reference and an electrode on the right shin as ground. Blinks and eye movements were recorded with a pair of biopotential electrodes arranged in a transverse montage, one electrode superior to the right eye and the other over the outer can thus. A Grass Model 12A Neurodata acquisition system was used to collect EEG data, with each signal passed through an amplifier with a bandpass of 0.01 to 30 Hz (half-amplitude) and a roll-off of 6 dB per octave. For each trial, 2 s of EEG data, including a 500-ms prestimulus baseline, were digitized to 12 bits resolution at a rate of 256 Hz. If participants failed to respond on a given trial, or if any EEG signal exceeded the range of the A-D converter, the trial was repeated. Trials repeated more than twice were excluded from averaging.
EEG data processing and reduction
The procedure of Gratton, Coles, and Donchin (1983) was used to correct for blinks and other ocular artifacts in the raw EEG data. Signals were digitally filtered using a third-order Butterworth highpass filter at 0.5 Hz to attenuate low frequency artifact present in some of the data due to amplifier drift. ERP waveforms were constructed by averaging EEG data across trials within easy and hard discrimination conditions at each electrode site (P3, Pz, P4). The P3 was defined as the point between 280 and 600ms at which amplitude of the average waveform was maximal. Associations between P3 and Externalizing factor scores did not differ as a function of target difficulty or electrode site. Current analyses are based on P3 scores for the parietal electrode Pz at which the amplitude of the P3 response has been shown to be maximal (Comerchero & Polich, 1999; Friedman, Cycowicz, & Gaeta, 2001; He, Lian, Spencer, Dien, & Donchin, 2001; Polich & Kok, 1995; Spencer, Dien, & Donchin, 1999).
Data Analysis
Our primary goals were to estimate the heritability of P3 amplitude and Externalizing composite scores as well as the genetic and environmental contributions to their covariance using standard biometric modeling (Neale & Cardon, 1992). The biometric modeling we employed assumes that the phenotypic variance of an individual differences variable can be decomposed into three sources: additive genetic (A), shared or common environmental (C), and nonshared or unique environmental (E). This variance decomposition can be accomplished by comparing the similarity of MZ and DZ twins under the following assumptions: no assortative mating for the phenotype, all genetic effects are additive with no gene–environment correlations or interactions, and shared environmental effects for MZ and DZ twins are the same (Plomin, DeFries, McClearn, & McGuffin, 2001). MZ twins are genetically identical, resulting in a correlation of 1.0 for all genetic effects. In contrast, DZ twins, on average, share 50% of their segregating genes, resulting in a correlation of .5 for all genetic effects. An MZ correlation twice that of the DZ correlation suggests twin similarity is primarily due to additive genetic effects. A DZ correlation greater than half the MZ correlation, however, suggests shared environmental factors contribute to twin similarity. Nonshared environmental effects represent influences (including measurement error) that contribute to differences between members of a twin pair, and so are uncorrelated across members of both MZ and DZ twin pairs.
We used a standard bivariate Cholesky decomposition (Figure 1; C effects are excluded to ease interpretation) to delineate the genetic and environmental components of variance and covariance for the P3 amplitude and Externalizing composite scores. In a bivariate Cholesky model, there are two types of genetic and environmental effects. Factors A1 and E1 account for all the additive genetic and nonshared environmental variance in P3 amplitude, including the genetic and environmental variance that overlaps with risk for externalizing disorders (a22 and e22). Factors A2 and E2 account for residual (i.e., independent of P3 amplitude) additive genetic and nonshared environmental factors in the risk for externalizing disorders. The total genetic covariance between P3 amplitude and Externalizing composite scores is the product of a11 × a21. Standardizing the genetic covariance on the genetic variance of the two phenotypes yields the genetic correlation, which indexes the magnitude of genetic overlap between P3 amplitude and Externalizing composite scores. A genetic correlation of 1.0 indicates that the two variables share all of their genetic effects, whereas a genetic correlation of 0 indicates genetic independence. Similar analytic procedures can also be used to estimate the nonshared environmental correlation.
Models were fit to the raw data using full information maximum likelihood estimation as implemented in the computer program Mx (Neale, 1997). This approach was taken because it uses all available information from all cases regardless of missing data. This procedure yields less biased parameter estimates compared to listwise or pairwise deletion methods (Allison, 2003) and allowed us to retain twin pairs who would have been excluded due to individual twins with missing data. For the current sample, 436 (72.9%) twin pairs had complete data for both twins, and 162 (27.1%) twin pairs included at least one member who was missing either P3 amplitude or symptom count data or both (within the age 11 cohort, some members of a pair did not participate in the follow-up assessment). As long as one member of the twin pair had scores for either P3 amplitude or the Externalizing composite, the twin pair was retained in the analysis.
The fit of models was evaluated by comparing −2 times the natural log likelihood (−2lnL) of a base model that estimated the means and covariances of the variables to more restrictive bivariate Cholesky models. The distribution of differences in the −2lnL index approximates a χ2 distribution, which allows for a likelihood ratio test. In addition, the χ2 values for alternative biometric models were converted to values of the Bayesian Information Criterion (BIC; χ2−df ln N; Raftery, 1995). The BIC is a fit index that assesses overall model fit in relation to model parsimony, with more negative values indicative of better fit. The model that yielded the most negative BIC value was selected as the best fitting model. Additionally, when comparing two models, the difference in BIC values corresponds to the odds ratio formed by taking the probability that, given the data, the second model is correct to the probability that the first model is correct. Differences in BIC values of 6 (posterior odds 20:1) is considered “strong evidence” in favor of the model with the more negative BIC value, whereas differences in BIC values of 10 (posterior odds 150:1) are considered “very strong” evidence in favor of the model with the more negative BIC value (Raftery, 1995).
Results
Model fitting results are presented in Table 1. For model 1, we estimated all ACE components of variance and covariance and allowed the parameter estimates to differ across the two age cohorts. The fit of this model was then compared to more restrictive (i.e., more parsimonious) CE and AE models, with more negative BIC values indicative of better model fit. As can be seen in Table 1, model 6 (the AE, no cohort differences model) yielded the most negative BIC value, indicating no significant contribution of shared environment effects to either P3 amplitude or Externalizing composite scores, and no difference in parameter estimates across the two age cohorts. Figure 2 presents the average ERP waveforms from the 11- and 17-year-old cohorts for participants in the lowest and highest quartiles of the distribution of scores on the Externalizing composite.
Table 1.
Biometric Model Fitting Results for the Association Between P3 Amplitude and Externalizing Disorders
| Model | −2lnL | df | Δχ2 | Δdf | BIC |
|---|---|---|---|---|---|
| Base model | 8587.58 | 2074 | — | — | — |
| 1. ACE allow cohort differences | 8630.23 | 2104 | 42.65 | 30 | −149.2 |
| 2. ACE no cohort differences | 8657.82 | 2113 | 70.24 | 39 | −179.1 |
| 3. CE allow cohort differences | 8732.21 | 2110 | 144.63 | 36 | −85.5 |
| 4. CE no cohort differences | 8762.10 | 2116 | 174.52 | 42 | −94.0 |
| 5. AE allow cohort differences | 8632.19 | 2110 | 44.61 | 36 | −185.6 |
| 6. AE no cohort differences | 8658.81 | 2116 | 71.23 | 42 | −197.3 |
| 6a. No genetic contribution to P3-Externalizing covariance | 8670.89 | 2117 | 83.31 | 43 | −191.6 |
| 6b. P3-Externalizing covariance due to genetic factors only | 8662.62 | 2117 | 75.04 | 43 | −199.9 |
Note: A: additive genetic, C: shared environment, E: nonshared environment, lnL: log-likelihood, df: degrees of freedom, BIC: Bayesian information criterion. Δχ2 and Δdf are relative to the base model.
Figure 2.
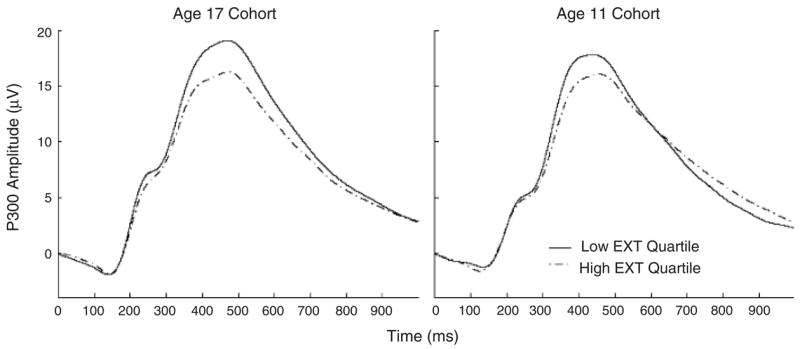
Average ERP waveforms from the 11- and 17-year-old cohorts for participants in the lowest and highest quartiles of the distribution of scores on the Externalizing (EXT) composite.
Next, we evaluated genetic and environmental contributions to the covariance between P3 amplitude and Externalizing composite scores by comparing even more restrictive models to the AE, no cohort differences model. First, we tested whether there was a significant genetic contribution to the covariance between P3 amplitude and Externalizing composite scores by requiring environmental factors alone to account for the link between P3 and Externalizing. This model (6a) yielded a worse fit to the data, as evidenced by a significant likelihood ratio test, Δχ2 = 12.08, df = 1, p<.01, and a less negative BIC value—indicating a significant contribution of genetic influences to the covariance between P3 amplitude and Externalizing composite scores.
Next, we fit a model (6b) that tested whether the covariance between P3 and Externalizing could be attributed to genetic factors only. This more parsimonious model did not result in a significantly poorer fit to the data, Δχ2 = 3.81, df = 1, p>.05, and yielded a more negative BIC value—suggesting genetic factors alone can account for the link between P3 amplitude and Externalizing composite scores. However, the difference in BIC values (−2.6) was small and, therefore, provides only modest evidence to reject any environmental contribution (i.e., e21>0) to the covariance between P3 amplitude and Externalizing composite scores. That being said, genetic factors clearly account for the majority of the link between P3 amplitude and Externalizing composite scores, as genetic variance accounted for 82% of the phenotypic covariance when environmental factors were retained in the model (model 6).
Table 2 presents parameter estimates and 95% confidence intervals derived from the best fitting model (model 6b) for each age cohort separately and for a model that utilized the entire sample by constraining the parameters to be the same across cohorts. Of note, all results were nearly identical across cohorts, providing a replication of the findings. Both P3 amplitude and scores on the Externalizing composite scores were highly heritable, and shared environmental effects did not account for a significant portion of the variance of either. There was a modest but statistically significant phenotypic correlation between P3 amplitude and Externalizing composite scores. The genetic correlation between P3 amplitude and Externalizing composite scores was rg = −.22 (95% CI:−.31,−.12) indicating that the genetic factors associated with P3 amplitude accounted for 4.8% of the genetic risk associated with externalizing disorders (this statistic was obtained by squaring the genetic correlation: .22 × .22 = .048 × 100% = 4.8%).
Table 2.
Parameter Estimates for the Best Fitting Model
| Heritability (95% CI)
|
||||
|---|---|---|---|---|
| P3 amplitude | EXT | rp P3-EXT (95% CI) | rg P3-EXT (95% CI) | |
| Age 11 cohort | .66 (.56, .73) | .83 (.78, .86) | −.17 (−.27, −.08) | −.23 (−.36, −.09) |
| Age 17 cohort | .62 (.52, .70) | .76 (.70, .81) | −.14 (−.24, −.05) | −.21 (−.35, −.07) |
| Combined sample | .64 (.57, .70) | .80 (.77, .83) | −.16 (−.23, −.09) | −.22 (−.31, −.12) |
Note: rp: phenotypic correlation, rg: genetic correlation, CI: confidence interval. Results are reported separately for each age cohort and for a no cohort differences model (i.e., combined sample) in which the parameters were constrained to be the same across cohorts. The age 11 cohort refers to the age of participants upon entry into the longitudinal study. The data reported in this investigation were collected when members of both the 11- and 17-year-old cohorts were in their late teens.
Discussion
The current study extended prior research demonstrating links between P3 amplitude and specific DSM disorders (e.g., alcohol dependence, antisocial personality disorder) by examining genetic and environmental contributions to the recently established association between P3 and the general vulnerability to externalizing disorders (Patrick et al., 2006). Notable features of the current study are that (1) it is one of the largest samples to date used to estimate the heritability of P3 amplitude, (2) it is the first to estimate the genetic overlap between P3 and externalizing psychopathology, and (3) the sample was composed of two non-overlapping age cohorts, providing for an internal replication of the study findings.
Consistent with previous investigations (Kendler, Prescott, et al., 2003; Katsanis et al., 1997; Krueger et al., 2002; Young et al., 2000), both P3 amplitude and the general vulnerability to externalizing disorders were highly heritable. Furthermore, we found that the association between P3 amplitude and the general vulnerability to externalizing disorders was primarily attributable to genetic effects. Finally, the genetic effects associated with P3 amplitude accounted for 4.8% of the genetic risk associated with externalizing disorders.
Although the magnitude of the genetic overlap between P3 amplitude and externalizing disorders might appear modest, an appropriate comparison in terms of effect size can be derived from molecular genetic studies of single-gene markers and psychiatric disorders. Studies of this kind that have detected an association between a particular gene marker and a disorder have typically reported that the gene marker accounts for an estimated 1% to 5% of the variance of the disorder (Faraone et al., 2001, 2005). Using this as a benchmark, our results fall toward the high end of the range of reported effect sizes. Moreover, whereas many molecular genetic studies revealing associations between specific gene loci and psychiatric phenotypes have not been consistently replicated (Hirschhorn, Lohmueller, Byrne, & Hirschhorn, 2002; Prathikanti & McMahon, 2001), our results replicated closely across the two age cohorts in the current study, as evidenced by nearly identical parameter estimates. This suggests that the genetic association between P3 and externalizing psychopathology will prove to be as robust as the phenotypic association has been shown to be (for reviews, see Begleiter & Porjesz, 1999; Iacono, 1998; Porjesz et al., 2005).
Although our study has impressive strengths, it also has some notable limitations. First, the sample was composed solely of male twins. Whether the link between P3 amplitude and externalizing disorders will be found in female twins remains to be seen. Also, members of the sample were all in late adolescence, and the sample was not racially or ethnically diverse. Whether the findings generalize to younger and older samples and in different racial or ethnic groups will need to be determined through further research.
Though the current investigation advances our understanding of the association between P3 amplitude and externalizing disorders, questions could also be raised about the specificity of P3 amplitude reduction as an indicator of externalizing psychopathology—because reduced P3 amplitude has also been detected for schizophrenia (Ford et al., 1999; Friedman & Squires-Wheeler, 1994; Mathalon, Ford, & Pfefferbaum, 2000) and major depression (Blackwood et al., 1987; Charkroun, 1988; Kayser, Bruder, Tenke, Stewart, & Quitkin, 2000; Santosh, Malhotra, Raghunathan, & Mehra, 1994). It is conceivable that the P3 response amplitude is a general index of cognitive processing efficiency that is compromised in various forms of psychopathology. However, there are some indicants of specificity: P3 amplitude is not consistently linked to familial risk for depression or schizophrenia, nor does it predict the developmental course of these disorders, and results are more robust for auditory rather than visual paradigms. Additionally, our results linking P3 and externalizing disorders at the genotypic level, rather than simply the familial level, provide further support for P3 as an endophenotypic marker of the general vulnerability to externalizing disorders.
An important direction for future research will be to develop new experimental paradigms that index the processes underlying P3 amplitude reduction in relation to specific forms of psychopathology. For example, one mechanism for reduced P3 amplitude in relation to externalizing disorders may be that individuals with such disorders operate in a more stimulus-driven fashion with less ongoing vigilance and less prestimulus preparation. This possibility could be evaluated by measuring or probing brain states during interstimulus intervals to test for differences associated with externalizing disorders. Another valuable approach in future research will be to examine brain response measures that more directly reflect the processes underlying different forms of psychopathology. For example, recent research indicates that the error-related negativity, a cortical response measure that reflects the brain’s ability to detect errors on-line during performance of a task, is reduced among individuals who are high in externalizing psychopathology (Hall et al., 2005). Besides contributing to a greater understanding of brain processes underlying different forms of psychopathology that have been associated with reduced P3 amplitude, response measures derived from functionally relevant task paradigms are likely to yield greater effect sizes in the differentiation of pathologic and nonpathologic groups.
Acknowledgments
This research was supported in part by United States Public Health Service Grants AA09367, DA05147, and MH65137.
References
- Allison PD. Missing data techniques for structural equation modeling. Journal of Abnormal Psychology. 2003;112:545–557. doi: 10.1037/0021-843X.112.4.545. [DOI] [PubMed] [Google Scholar]
- American Psychiatric Association. Diagnostic and Statistical Manual of Mental Disorders, Revised Third Edition. Washington, DC: Author; 1987. [Google Scholar]
- Anokhin AP, Vedeniapin AB, Sirevaag EJ, Bauer LO, O’Connor SJ, Kuperman S, et al. The P300 brain potential is reduced in smokers. Psychopharmacology. 2000;149:409–413. doi: 10.1007/s002130000387. [DOI] [PubMed] [Google Scholar]
- Bauer LO. CNS recovery from cocaine, cocaine and alcohol, or opioid dependence: A P300 study. Neurophysiology. 2001;112:1508–1515. doi: 10.1016/s1388-2457(01)00583-1. [DOI] [PubMed] [Google Scholar]
- Bauer LO, Hesselbrock VM. Subtypes of family history and conduct disorder: Effects on P300 during the Stroop test. Neuropsychopharmacology. 1999;21:51–62. doi: 10.1016/S0893-133X(98)00139-0. [DOI] [PubMed] [Google Scholar]
- Bauer LO, Hesselbrock VM. CSD/BEM localization of P300 sources in adolescents “at-risk”: Evidence of frontal cortex dysfunction in conduct disorder. Biological Psychiatry. 2001;50:600–608. doi: 10.1016/s0006-3223(01)01066-6. [DOI] [PubMed] [Google Scholar]
- Bauer LO, Hesselbrock VM. Brain maturation and subtypes of conduct disorder: Interactive effects on P300 amplitude and topography in male adolescents. Journal of the American Academy of Child and Adolescent Psychiatry. 2003;42:106–115. doi: 10.1097/00004583-200301000-00017. [DOI] [PubMed] [Google Scholar]
- Begleiter H, Porjesz B. What is inherited in the predisposition toward alcoholism? A proposed model. Alcoholism: Clinical and Experimental Research. 1999;23:1125–1135. doi: 10.1111/j.1530-0277.1999.tb04269.x. [DOI] [PubMed] [Google Scholar]
- Begleiter H, Porjesz B, Bihari B, Kissin B. Event-related brain potentials in boys at risk for alcoholism. Science. 1984;225:1493–1496. doi: 10.1126/science.6474187. [DOI] [PubMed] [Google Scholar]
- Biggins CA, MacKay S, Clark W, Fein G. Event-related potential evidence for frontal cortex effects of chronic cocaine dependence. Biological Psychiatry. 1997;42:472–485. doi: 10.1016/S0006-3223(96)00425-8. [DOI] [PubMed] [Google Scholar]
- Blackwood DH, Whalley LJ, Christie JE, Blackburn IM, St Clair DM, McInnes A. Changes in auditory P3 event-related potential in schizophrenia and depression. British Journal of Psychiatry. 1987;150:154–160. doi: 10.1192/bjp.150.2.154. [DOI] [PubMed] [Google Scholar]
- Brigham J, Moss HB, Murrelle EL, Kirisci L, Spinelli JS. Event-related potential negative shift in sons of polysubstance- and alcohol-use disordered fathers. Psychiatry Research. 1997;73:133–146. doi: 10.1016/s0165-1781(97)00121-2. [DOI] [PubMed] [Google Scholar]
- Charkroun H. Effects of selective attention on visual evoked potentials in depressed patients and healthy controls. Acta Psychiatrica Belgica. 1988;88:138–152. [PubMed] [Google Scholar]
- Comerchero MD, Polich J. P3a and P3b from typical auditory and visual stimuli. Clinical Neurophysiology. 1999;110:24–30. doi: 10.1016/s0168-5597(98)00033-1. [DOI] [PubMed] [Google Scholar]
- Costa L, Bauer L, Kuperman S, Porjesz B, O’Connor S, Hesselbrock V, et al. Frontal P300 decrements, alcohol dependence, and antisocial personality disorder. Biological Psychiatry. 2000;47:1064–1071. doi: 10.1016/s0006-3223(99)00317-0. [DOI] [PubMed] [Google Scholar]
- Faraone SV, Doyle AE, Mick E, Biederman J. Meta-analysis of the association between the 7-repeat allele of the dopamine D(4) receptor gene and attention deficit hyperactivity disorder. American Journal of Psychiatry. 2001;158:1052–1057. doi: 10.1176/appi.ajp.158.7.1052. [DOI] [PubMed] [Google Scholar]
- Faraone SV, Doyle AE, Smoller JW, Goralnick JJ, Holmgren MA, Sklar P. Molecular genetics of attention deficit hyperactivity disorder. Biological Psychiatry. 2005;57:1313–1323. doi: 10.1016/j.biopsych.2004.11.024. [DOI] [PubMed] [Google Scholar]
- Ford JM, Mathalon DH, Marsh L, Faustman WO, Harris D, Hoff AL, et al. P300 amplitude is related to clinical state in severely and moderately ill patients with schizophrenia. Biological Psychiatry. 1999;46:94–101. doi: 10.1016/s0006-3223(98)00290-x. [DOI] [PubMed] [Google Scholar]
- Friedman D, Cycowicz YM, Gaeta H. The novelty P3: An event-related brain potential (ERP) sign of the brain’s evaluation of novelty. Neuroscience and Biobehavioral Reviews. 2001;25:355–373. doi: 10.1016/s0149-7634(01)00019-7. [DOI] [PubMed] [Google Scholar]
- Friedman D, Squires-Wheeler E. Event-related potentials (ERPs) as indicators of risk for schizophrenia. Schizophrenia Bulletin. 1994;20:63–74. doi: 10.1093/schbul/20.1.63. [DOI] [PubMed] [Google Scholar]
- Fu Q, Heath AC, Bucholz KK, Nelson E, Goldberg J, Lyons MJ, et al. Shared genetic risk of major depression, alcohol dependence, and marijuana dependence. Archives of General Psychiatry. 2002;59:1125–1132. doi: 10.1001/archpsyc.59.12.1125. [DOI] [PubMed] [Google Scholar]
- Gratton G, Coles MG, Donchin E. A new method for off-line removal of ocular artifact. Electroencephalography and Clinical Neurophysiology. 1983;55:468–484. doi: 10.1016/0013-4694(83)90135-9. [DOI] [PubMed] [Google Scholar]
- Hall JR, Bernat EM, Venables NC, Steffen BV, Cadwallader M, Krueger RF, et al. Externalizing psychopathology and the error-related negativity: Evidence for reduced neural processing of errors in high-externalizing undergraduates. Psychophysiology. 2005;42:S61. [Google Scholar]
- He B, Lian J, Spencer KM, Dien J, Donchin E. A cortical potential imaging analysis of the P300 and novelty P3 components. Human Brain Mapping. 2001;12:120–130. doi: 10.1002/1097-0193(200102)12:2<120::AID-HBM1009>3.0.CO;2-V. [DOI] [PMC free article] [PubMed] [Google Scholar]
- Heath AC, Bucholz KK, Madden PAF, Dinwiddie SH, Slutske WS, Bierut LJ, et al. Genetic and environmental contributions to alcohol dependence risk in a national twin sample: Consistency of findings in men and women. Psychological Medicine. 1997;27:1381–1396. doi: 10.1017/s0033291797005643. [DOI] [PubMed] [Google Scholar]
- Hesselbrock VM, Bauer LO, O’Connor SJ, Gillen R. Reduced P300 amplitude in relation to family history of alcoholism and antisocial personality disorder among young men at risk for alcoholism. Alcohol and Alcoholism Supplement. 1993;2:922–928. [PubMed] [Google Scholar]
- Hirschhorn JN, Lohmueller K, Byrne E, Hirschhorn K. A comprehensive review of genetic association studies. Genetics in Medicine. 2002;4:45–61. doi: 10.1097/00125817-200203000-00002. [DOI] [PubMed] [Google Scholar]
- Holdcraft LC, Iacono WG, McGue MK. Antisocial personality and depression in relation to alcoholism: A community-based sample. Journal of Studies on Alcohol. 1998;59:222–226. doi: 10.15288/jsa.1998.59.222. [DOI] [PubMed] [Google Scholar]
- Iacono WG. Identifying psychophysiological risk for psychopathology: Examples from substance abuse and schizophrenia research. Psychophysiology. 1998;35:621–637. [PubMed] [Google Scholar]
- Iacono WG, Carlson SR, Malone SM, McGue M. P3 event-related potential amplitude and risk for disinhibitory disorders in adolescent boys. Archives of General Psychiatry. 2002;59:750–757. doi: 10.1001/archpsyc.59.8.750. [DOI] [PubMed] [Google Scholar]
- Iacono WG, Carlson SR, Taylor J, Elkins IJ, McGue M. Behavioral disinhibition and the development of substance use disorders: Findings from the Minnesota Twin Family Study. Development and Psychopathology. 1999;11:869–900. doi: 10.1017/s0954579499002369. [DOI] [PubMed] [Google Scholar]
- Iacono WG, Malone SM, McGue M. Substance use disorders, externalizing psychopathology, and P300 event-related potential amplitude. International Journal of Psychophysiology. 2003;48:147–178. doi: 10.1016/s0167-8760(03)00052-7. [DOI] [PubMed] [Google Scholar]
- Jacobson KC, Prescott CA, Kendler KS. Sex differences in the genetic and environmental influences on the development of antisocial behavior. Development and Psychopathology. 2002;14:395–416. doi: 10.1017/s0954579402002110. [DOI] [PubMed] [Google Scholar]
- Katsanis J, Iacono WG, McGue M, Carlson SR. P300 event-related potential heritability in monozygotic and dizygotic twins. Psychophysiology. 1997;34:47–58. doi: 10.1111/j.1469-8986.1997.tb02415.x. [DOI] [PubMed] [Google Scholar]
- Kayser J, Bruder GE, Tenke CE, Stewart JE, Quitkin FM. Event-related potentials (ERPs) to hemifield presentations of emotional stimuli: Differences between depressed patients and healthy adults in P3 amplitude and asymmetry. International Journal of Psychophysiology. 2000;36:211–236. doi: 10.1016/s0167-8760(00)00078-7. [DOI] [PubMed] [Google Scholar]
- Kendler KS, Jacobson KC, Prescott CA, Neale MC. Specificity of genetic and environmental risk factors for use and abuse/dependence of cannabis, cocaine, hallucinogens, sedatives, stimulants, and opiates in male twins. American Journal of Psychiatry. 2003;160:687–696. doi: 10.1176/appi.ajp.160.4.687. [DOI] [PubMed] [Google Scholar]
- Kendler KS, Prescott CA, Myers J, Neale MC. The structure of genetic and environmental risk factors for common psychiatric and substance use disorders in men and women. Archives of General Psychiatry. 2003;60:929–937. doi: 10.1001/archpsyc.60.9.929. [DOI] [PubMed] [Google Scholar]
- Krueger RF. The structure of common mental disorders. Archives of General Psychiatry. 1999;56:921–926. doi: 10.1001/archpsyc.56.10.921. [DOI] [PubMed] [Google Scholar]
- Krueger RF, Caspi A, Moffitt TE, Silva PA. The structure and stability of common mental disorders (DSM-III-R): A longitudinal-epidemiological study. Journal of Abnormal Psychology. 1998;107:216–227. doi: 10.1037//0021-843x.107.2.216. [DOI] [PubMed] [Google Scholar]
- Krueger RF, Hicks BM, Patrick CJ, Carlson SR, Iacono WG, McGue M. Etiologic connections among substance dependence, antisocial behavior, and personality: Modeling the externalizing spectrum. Journal of Abnormal Psychology. 2002;111:411–424. [PubMed] [Google Scholar]
- Lyons MJ, True WR, Eisen SA, Goldberg J, Meyer JM, Faraone SV, et al. Differential heritability of adult and juvenile antisocial traits. Archives of General Psychiatry. 1995;52:906–915. doi: 10.1001/archpsyc.1995.03950230020005. [DOI] [PubMed] [Google Scholar]
- Mathalon DH, Ford JM, Pfefferbaum A. Trait and state aspects of P300 amplitude reduction in schizophrenia: A retrospective longitudinal study. Biological Psychiatry. 2000;47:434–449. doi: 10.1016/s0006-3223(99)00277-2. [DOI] [PubMed] [Google Scholar]
- Neale MC. Mx: Statistical modeling. 4. Richmond, VA: University of Virginia; 1997. [Google Scholar]
- Neale MC, Cardon LR. Methodology for genetic studies of twins and families. Dordrecht, The Netherlands: Kluwer; 1992. [Google Scholar]
- Patrick CJ, Bernat E, Malone SM, Iacono WG, Krueger RF, McGue M. P300 amplitude as an indicator of externalizing in adolescent males. Psychophysiology. 2006;43:84–92. doi: 10.1111/j.1469-8986.2006.00376.x. [DOI] [PMC free article] [PubMed] [Google Scholar]
- Plomin R, DeFries JC, McClearn GE, McGuffin P. Behavioral genetics. 4. New York: Worth Publishers, Inc; 2001. [Google Scholar]
- Polich J, Kok A. Cognitive and biological determinants of P300: An integrative review. Biological Psychology. 1995;41:103–146. doi: 10.1016/0301-0511(95)05130-9. [DOI] [PubMed] [Google Scholar]
- Polich J, Pollock VE, Bloom FE. Meta analysis of P300 amplitude from males at risk for alcoholism. Psychological Bulletin. 1994;115:55–73. doi: 10.1037/0033-2909.115.1.55. [DOI] [PubMed] [Google Scholar]
- Porjesz B, Begleiter H, Bihari B, Kissin B. Event-related brain potentials to high incentive stimuli in abstinent alcoholics. Alcohol. 1987;4:283–287. doi: 10.1016/0741-8329(87)90024-3. [DOI] [PubMed] [Google Scholar]
- Porjesz B, Rangaswamy M, Kamarajan C, Jones KA, Padmanabhapillai A, Begleiter H. The utility of neurophysiological markers in the study of alcoholism. Clinical Neurophysiology. 2005;116:993–1018. doi: 10.1016/j.clinph.2004.12.016. [DOI] [PubMed] [Google Scholar]
- Prathikanti S, McMahon FJ. Genome scans for susceptibility genes in bipolar affective disorder. Annals of Medicine. 2001;33:257–262. doi: 10.3109/07853890108998754. [DOI] [PubMed] [Google Scholar]
- Raftery AE. Bayesian model selection in social research. Sociological Methodology. 1995;25:111–163. [Google Scholar]
- Reich W. Diagnostic Interview for Children and Adolescents (DICA) Journal of the American Academy of Child and Adolescent Psychiatry. 2000;39:59–66. doi: 10.1097/00004583-200001000-00017. [DOI] [PubMed] [Google Scholar]
- Robins LN, Baber T, Cottler LB. Composite International Diagnostic Interview: Expanded Substance Abuse Module. St. Louis, MO: Author [L.N.R.]; 1987. [Google Scholar]
- Santosh PJ, Malhotra S, Raghunathan M, Mehra YN. A study of P300 in melancholic depression: Correlation with psychotic features. Biological Psychiatry. 1994;35:474–479. doi: 10.1016/0006-3223(94)90046-9. [DOI] [PubMed] [Google Scholar]
- Slutske WS, Heath AC, Dinwiddie SH, Madden PAF, Bucholz KK, Dunne MP, et al. Common genetic risk factors for conduct disorder and alcohol dependence. Journal of Abnormal Psychology. 1998;107:363–374. doi: 10.1037//0021-843x.107.3.363. [DOI] [PubMed] [Google Scholar]
- Spencer KM, Dien J, Donchin E. A componential analysis of the ERP elicited by novel events using a dense electrode array. Psychophysiology. 1999;36:409–414. doi: 10.1017/s0048577299981180. [DOI] [PubMed] [Google Scholar]
- Tsuang MT, Lyons MJ, Meyer JM, Doyle T, Eisen SA, Goldberg J, et al. Co-occurrence of abuse of different drugs in men. Archives of General Psychiatry. 1998;55:967–972. doi: 10.1001/archpsyc.55.11.967. [DOI] [PubMed] [Google Scholar]
- van den Bree MBM, Svikis DS, Pickens RW. Genetic influences in antisocial personality and drug use disorders. Drug and Alcohol Dependence. 1998;49:177–187. doi: 10.1016/s0376-8716(98)00012-x. [DOI] [PubMed] [Google Scholar]
- Young SE, Stallings MC, Corley RP, Krauter KS, Hewitt JK. Genetic and environmental influences on behavioral disinhibition. American Journal of Medical Genetics (Neuropsychiatric Genetics) 2000;96:684–695. [PubMed] [Google Scholar]