Abstract
In the wallpaper illusion, a repetitive pattern appears to shift from one depth plane to the plane nearest fixation. We measured the timing of this shift for a 6° wide, 3-cpd sinusoidal grating presented in a rectangular envelope; the edges (envelope) of the grating were presented at 20 arcmin of disparity (one period) behind the fixation plane. We asked observers to signal when the segment appeared to move from the edge plane forward to the fixation plane. Initially, the shift from the edge plane took 4–6 s, but after many trials, the shift became faster. Additional experiments demonstrated that the envelope was adapting, thereby permitting the alternative match. Our measurements for a range of spatial frequencies and disparities showed that these shifts to the fixation plane occurred only if the envelope disparity was more than one-half period of the carrier; that is, phase disparity >180°. We also found that stereoacuity for the initial envelope-based match was poor, as might be expected for a target presented far off the fixation plane. However, once the perceived shift in depth occurred, stereoacuity improved fivefold without any change in the physical stimulus. We speculate that access to the most sensitive V1 neurons depends on the extrastriate processes that determine perceived depth—in this case, second-order envelope mechanisms.
Keywords: binocular vision, stereopsis, stereo matching, stereoacuity
Introduction
If one converges steadily on a position in front of a repetitive pattern, such as wallpaper, the pattern appears to shift forward in depth to a plane near the convergence plane—the famous Wallpaper Illusion Brewster (1844). The explanation for the illusory shift seems almost self-evident. Convergence brings a new set of potential matching features into retinal correspondence, inducing a new matching solution. The pattern moves forward to the plane specified by the new match (Figure 1).
Figure 1.
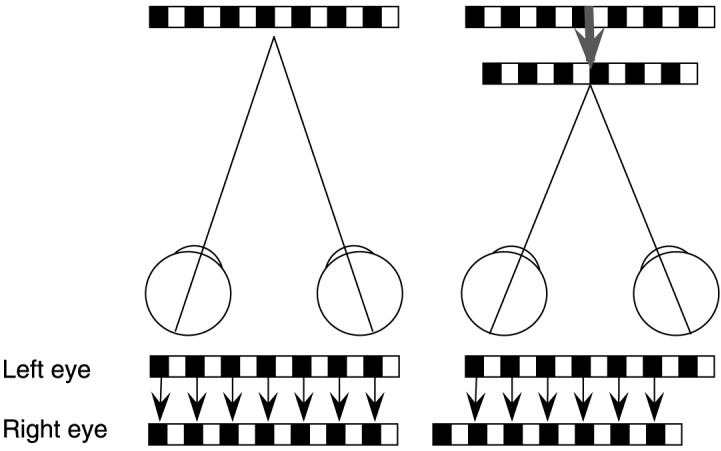
Diagram of wallpaper illusion demonstrating the new matching solution produced by convergence on a point in front of a repetitive pattern—in this example, a sinusoidal grating segment.
This explanation fails to capture one aspect of the illusion. The shift in depth is not usually instantaneous, particularly if the pattern is fairly narrow. Instead, observers have to hold their eyes steadily converged in front of the pattern and wait for the change. Goutcher and Mamassian (2006) also found that changes in the stereo matching of ambiguous stereograms take time. In the case of the wallpaper illusion, observers may be making small adjustments in their convergence to bring the pattern into exact retinal correspondence, and this adjustment process may account for the time needed to produce a matching change.
But why would the stereo system require exact correspondence? Many features in our surroundings are matched at noncorresponding loci, so why would there be some special rule for repetitive patterns? We will show that a match at exact correspondence is not required to produce these shifts in the perceived depth of repetitive patterns. We will also show that the sluggishness of the shift reflects an important aspect of human stereo matching that should be incorporated into the traditional explanation for the wallpaper illusion.
The wallpaper illusion is often taken as evidence for a common assumption about human stereo matching—the “nearest neighbor rule” (Arditi, Kaufman, & Movshon, 1981). This rule assumes that, given the numerous matching alternatives associated with any quasi-repetitive pattern, the stereo system selects matches at or near correspondence because these matches are weighted more strongly than are matches far from the fixation plane (Prince & Eagle, 2000b). A competing rule for matching repetitive patterns is the continuity constraint (Marr, 1982; Marr & Poggio, 1976); matches that minimize the difference in disparity between adjacent features are chosen. Goutcher and Mamassian (2005) referred to this second rule as the “nearest disparity rule.” In their recent psychophysical study, they pitted these two matching rules against one another and discovered that the nearest disparity rule tended to dominate human stereo matching. Zhang, Edwards, and Schor (2001) found that the stereo system preferred matches that minimized the disparity between adjacent surfaces, a result that is also consistent with the nearest disparity rule.
Our previous work also provided support for the nearest disparity rule. We found that rows of regularly spaced dots and sinusoidal grating segments are initially matched in or near the plane specified by their edges (McKee, Verghese, & Farell, 2004, 2005; Mitchison & McKee, 1987)—a result predicted from the original cooperative algorithm of Marr and Poggio (1976). Apparently, the stereo system initially selects matches that maximize continuity, or equivalently, it selects the matching plane with the highest local binocular correlation. In these studies, the targets were briefly presented, generally for 200 ms, to minimize changes in convergence during a test trial. However, given stable fixation in front of these patterns, they, like other wallpaper patterns, will shift to the fixation plane. Generally, this shift takes a few seconds (McKee & Mitchison, 1988).
Our primary objective here is to explore what accounts for this shift. Why does the stereo system abandon one satisfactory, and likely veridical, match in favor of another match nearer fixation?
Methods
Timing measurements
We measured the amount of time needed for our “wallpaper” stimulus—a sinusoidal grating—to shift from its initially perceived depth at some non-zero disparity to a depth in or near the fixation plane. A dark fixation point was presented 30 arcmin below the lower edge of the grating. For the first three experiments, we asked the observer to converge on this fixation point and to wait for the grating target to shift forward to the fixation plane. The observer signaled that this shift had occurred by pressing a response button. We recorded the time from initial stimulus presentation until the shift occurred. To examine the effect of repeated exposure to the target, we averaged the “times to shift” by blocks of 5–10 trials within a session, for example, the first 10 trials, the second 10 trials, and so forth. We averaged the measured times from 1–5 sessions, depending on the experiment. Each estimate of the average time (each point plotted in the graphs) is based on a minimum of 5 time measurements; for some conditions and subjects, the estimated time to shift was based on as many as 50 measurements per data point.
The stimulus for most of these experiments was a sinusoidal grating segment, 6° wide and 2° high. The “edges” of the grating were simply the position where the grating began or ended abruptly on the screen; that is, the grating was presented in a rectangular envelope. No additional aperture or frame surrounded the grating. The edges of the grating were laterally separated from the outer frame of the monitor by 3° on each side for all experiments, except the width experiment (Figure 9). In the width study, the segment width was varied from 1° to 9°; for the largest width, 1.5° separated the segment from the frame of the monitor on each side of the segment. In one control experiment, we used a long oval envelope for the grating; we found that the grating in the oval envelope shifted forward with about the same timing as the rectangular envelope.
Figure 9.
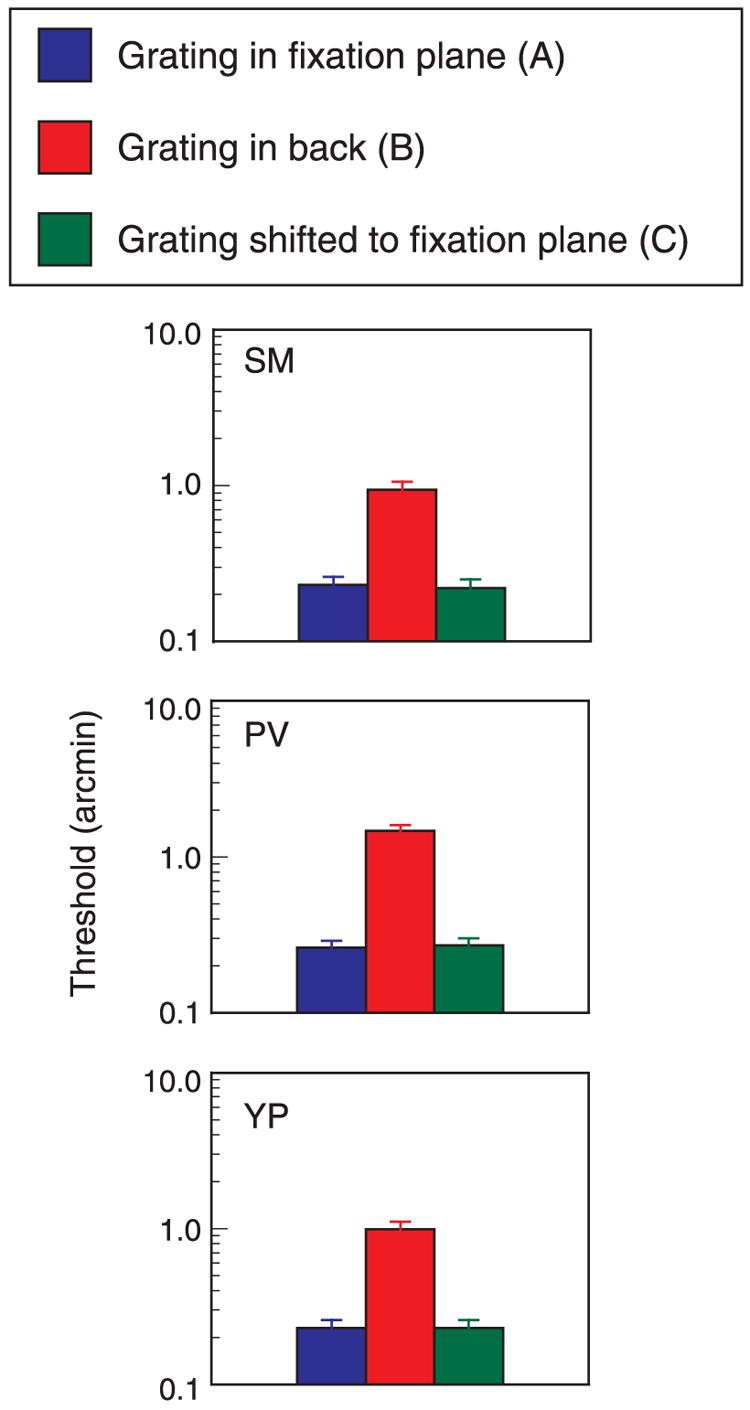
Disparity thresholds for the three stimulus configurations shown in Figure 8. Data for three observers.
The edges (envelope) and interocular phase disparities of the grating (carrier) were always coupled together; the phase disparity of the grating was not varied independently of the envelope. Therefore, changes in the disparity of the edges produced corresponding changes in the phase disparity of the carrier. At an edge disparity of zero, the phase disparity was zero. At non-zero edge disparities, the phase disparity followed the shift in the edges. For example, if the edges of a 3-cpd grating segment were presented with a 10-arcmin disparity, the phase disparity of the carrier was 180°. If the edges of a 3-cpd grating were presented at a 40-arcmin disparity, the carrier was shifted by two full periods and therefore had zero phase disparity.
In all experiments, except the fourth experiment, the spatial frequency of the grating was 3 cpd. In the fourth experiment, we examined how variations in the edge disparity (and corresponding interocular phase) affected the time to shift for different spatial frequencies.
Zhang et al. (2001) showed that adjacent targets could affect stereo matching for gratings, so the grating could have been pulled toward the fixation point. To counteract this potential interaction, we placed two additional points in the plane of the edges below the lower edge of the grating to the left and to the right of the fixation point.
To control the initial convergence angle, we asked the observer to align nonius lines before initiating a trial. The nonius lines were separated by 2.5° vertically and presented above and below the subsequently presented grating. A small dark fixation point was presented between the nonius lines to assist the observer with alignment. The nonius lines were turned off during the target presentation, but the fixation point remained visible, 0.5° below the lower edge of the grating.
Stereoacuity measurements
The exact spatial and temporal arrangements of the grating and test probe are described in the Results section, but general aspects of the methodology are described here. The test probe for these experiments was a thin dark line, 30 arcmin in length, separated vertically by 1° from the grating. The disparity of the test probe was varied from trial to trial by selecting one of five incremental disparities centered on zero. On each trial, the observer judged whether the probe was in front or behind the fixation plane. In some conditions, the grating segment (envelope and carrier) was also presented in the fixation plane (the same plane as the mean position of the probe), but in other conditions, the segment was presented in a plane 20 arcmin behind the fixation plane. In these conditions, the observer was judging the relative separation in depth between the probe and the grating, that is, an incremental disparity judgment.
We obtained a psychometric curve based on the proportion of trials on which the observer judged the test probe to be behind the fixation plane as a function of the five test disparities. We fitted a cumulative normal function to the data with probit analysis to determine the change in the probe disparity that produced a change in response rate from the 50% to the 75% level, equal to a d′ of 0.675. Each threshold in our graphs is based on a minimum of 200 trials. For all threshold measurements, we gave our observers feedback; they were also given practice with each stimulus type.
As in the timing studies, the observer aligned nonius lines before initiating a trial. The nonius lines were turned off during the target presentation.
General stimulus arrangements
Observers viewed the stereoscopic half-images of our stimuli in a mirror stereoscope. The displays were programmed on a Macintosh computer and presented on the screens of two Sony Trinitron monitors, Model 110 GS. We used only the central 9° of each screen, where screen curvature was slight, for our displays. Nevertheless, we assessed the effect of screen curvature on visual direction from the perspective of the observer's head position. We mounted a flat transparent grid of horizontal and vertical lines immediately in front of each screen and then aligned a thin cursor with each grid intersection for each screen separately, viewed in the stereoscope at a distance of 1.22 m. The cursor alignment measurements were incorporated into the software to correct each screen for any systematic deviations in x–y locations induced by screen curvature or raster imperfections.
The monitors were run at 75 Hz, using a resolution level of 1,024×768. At our viewing distance of 1.22 m, each pixel subtended 0.71 arcmin. Subpixel shifts in disparity and in the luminance distribution of the sinusoidal grating were achieved with dithering. The contrast of the grating targets was 50%. The gratings were presented against a homogeneous background equal to the mean luminance of the grating, which was 62 cd/m2. A Pritchard photometer was used to measure luminance as a function of monitor gray levels, and these values in turn were used in the dithering calculations. Overhead fluorescent lights illuminated the apparatus and the surrounding room at photopic levels.
Observers
The five observers in these experiments included the four authors. All observers were experienced psychophysical observers with normal stereoacuity. They wore optical corrections as needed for image clarity.
Results
Adapting the edges
To demonstrate that the illusory shift takes time, we measured the time required for a 3-cpd, 6°-wide grating to move from its initial depth plane to the fixation plane. The edges (envelope) of the grating segment were presented with 20 arcmin of uncrossed disparity, equal to an interocular phase disparity of 360° (0 phase). Our previous work on stereo matching showed that, on brief viewing (200 ms), these grating segments are perceived at or near the depth plane specified by the disparity of the edges (McKee et al., 2004). The current study confirmed that finding; all observers initially saw the grating far behind the fixation point. They were instructed to converge steadily on the fixation point and to press a response button when the grating shifted forward to the fixation plane. During the first few trials, the time to shift forward was very long—for one participant, as long as 12 s—but during the course of a 50-trial session, the time to shift became faster. We averaged the shift times over sequential blocks of 10 trials to provide evidence for the increasing speed of the shift forward. As is apparent from Figure 2, the time of shift decreased systematically with increased exposure to the grating. The decline in the shift time over trials suggested that the observers were adapting to some aspect of the grating.
Figure 2.
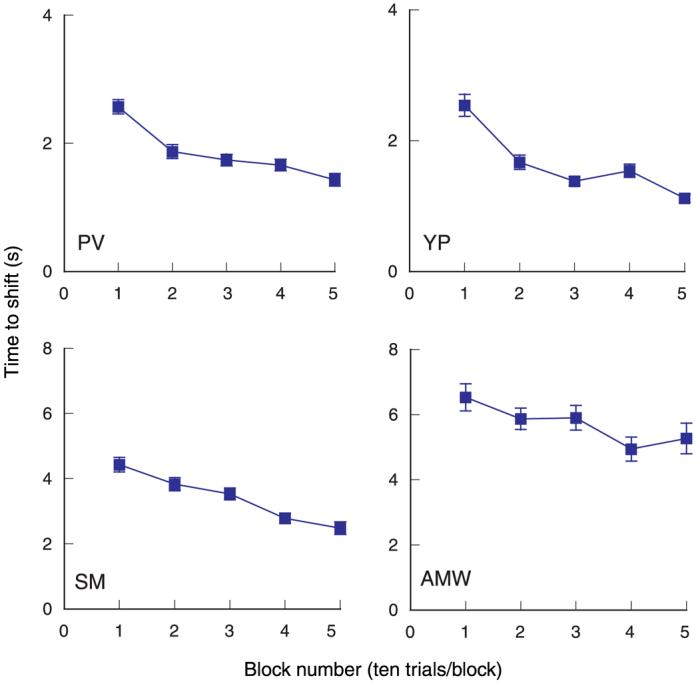
Average time taken for the apparent shift forward from the plane defined by the grating edges (uncrossed disparity of 20 arcmin) to the fixation plane for sequential blocks of 10 trials. The 3-cpd grating segment was 6° wide and 2° high and presented at 50% contrast. The time to shift decreased over blocks for all four observers. Note the difference in the y-axis scale for the upper and lower graphs.
We noticed one curious feature of these shifts. If we looked up from the fixation point to the grating after the forward shift, the grating instantly moved back to its initial depth. This observation suggested that the adaptation was specific to the retinal location of the grating. If so, a change in lateral position should restore the preadapted state, leading once again to longer times for the forward shift.
In the next experiment, we presented the grating edges at the same 20-arcmin disparity, but we repositioned the grating laterally either to the left or to the right after each block of 20 trials. The blue curves in Figure 3 show the effect of a two-period lateral shift to the right, followed by a four-period shift to the left, that is, 40 arcmin right and then 80 arcmin left. Note that the grating itself is 18 periods wide (6°). The arrows show the block when the lateral shift occurred. The leftward shift was made twice the rightward shift so that the grating would be in a new location with each change in lateral position. After the lateral changes in the grating position, all three participants showed an increase in the time required for the forward depth shift, suggesting that these small lateral changes in position led to a release from adaptation.
Figure 3.
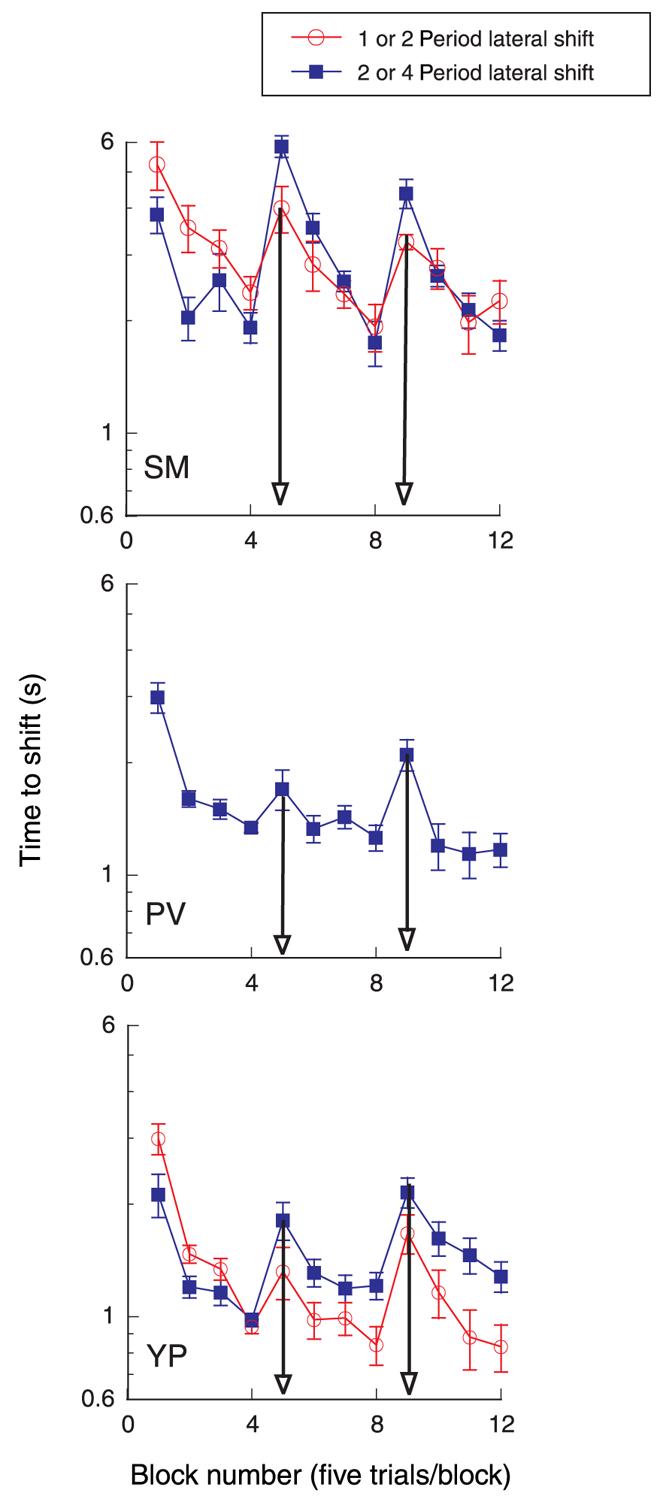
Average time to shift for sequential blocks of five trials. After four blocks (20 trials), the 6°-wide, 3-cpd grating segment was repositioned laterally to the right or to the left. Edge disparity = 20 arcmin; contrast = 50%. Blue curve shows lateral shift right two periods after 20 trials, then left four periods after 40 trials. Red curve shows lateral shift right one period, then left two periods. Arrows show block when shift occurred.
For two of the three participants, the time to shift rose to the long time associated with the first block of five trials, indicating a complete release from adaptation. For these two participants, we repeated this experiment with smaller lateral changes in the position of the grating segment. The red curves show the effect of a one-period lateral shift to the right, followed by a two-period shift to the left, that is, 20 arcmin right, then 40 arcmin left. The edge disparity of the grating was always 20 arcmin for these measurements. Again, the time for the apparent shift in depth increased with these lateral changes in the position of the grating, although the recovery from adaptation was smaller than with the larger position changes.
Based on the recovery from adaptation after these changes in position, we concluded that the grating segment, as a whole, was not adapting, because there was considerable overlap in the retinal region occupied by the grating before and after the change in position. These results also demonstrate that the disparity per se was not adapting, because the disparity was constant for all changes in lateral position.
The recovery from adaptation produced by a positional change of 1.3° or less indicates that the adapting features are probably the edges of the grating. In our previous study (McKee et al., 2004), we concluded that the edge (envelope) disparities depend on second-order stereo mechanisms. Research from other laboratories suggests that these second-order mechanisms are fairly coarse (Hess & Wilcox, 1994; Langley, Fleet, & Hibbard, 1999; Schor, Edwards, & Pope, 1998; Wilcox & Hess, 1997). Adaptation of second-order envelope mechanisms centered on the edges of the grating segment is consistent with the results shown in Figure 3.
To obtain further evidence that the envelope, rather than the carrier itself, was adapting, we used an edge-specific adapting stimulus—a box that reversed contrast sign (white to black) once per second. The box had the same dimensions as the grating segment, namely, 6° wide and 2° high. It was positioned on the same retinal locus as the grating with a disparity of 20 arcmin. This counterphasing box was presented initially for 2 min, while the observer maintained fixation on the fixation point. After preadaptation to the rectangular box, the grating was presented with 20-arcmin disparity. Once again, the observer reported the time at which the grating shifted forward to the fixation plane by pressing a response button. After a block of 10 trials, the counterphasing box reappeared for 1 s to “top–up” the adaptation. The blue curves in Figure 4 show the data from Figure 2 for timing measurements made without preadaptation. The red curves show the affect of preadapting to the box.
Figure 4.
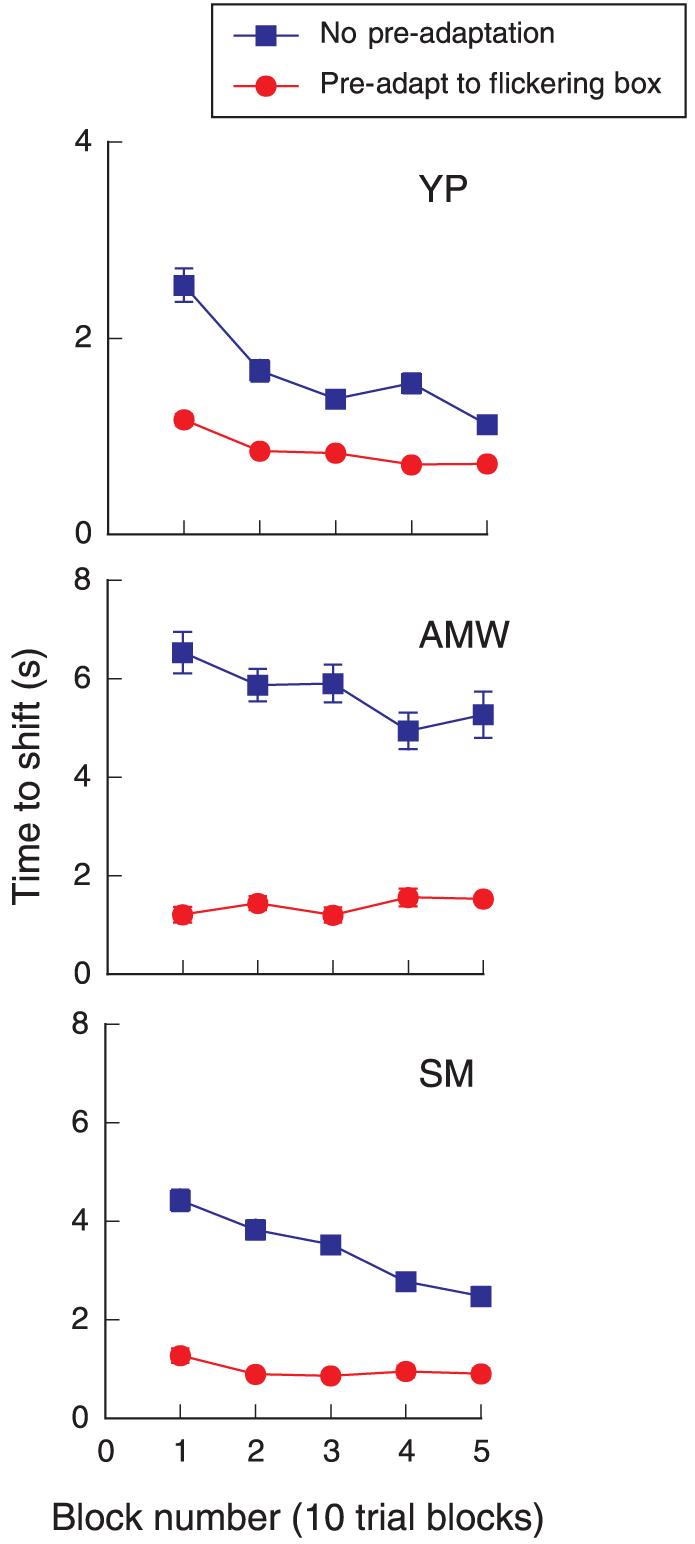
Average time to shift for sequential blocks of 10 trials. The 3-cpd grating segment was 6° wide and 2° high and presented at 50% contrast. Blue squares: data taken from Figure 2; red circles: data for shift times after prolonged adaptation to large counter-phasing box of the same dimensions and disparity as test grating. Note scale differences between top and lower two graphs.
It is apparent that preadaptation to the empty flickering box greatly speeded the time of the grating's forward shift to the fixation plane. All of the points on the red curves are significantly below the points on the blue curves. After two to three blocks of trials, the grating appeared to shift forward almost instantly for observers YP and SM. A time of 700–900 ms is essentially reaction time—the amount of time needed to assess the depth of the grating and hit a response button. Envelope adaptation accounts for the increasing speed of the illusory shift.
Timing depends on phase disparity
Adaptation explains one aspect of the wallpaper illusion, but certainly not the whole phenomenon. Non-repetitive features, that is, most objects, do not change their apparent depth if fixation is maintained on a plane in front of them. No shift in depth will occur unless there is an alternative match. The sluggishness of the forward shifts demonstrates an ongoing competition between the edge-based match and alternative matches in other planes. We next used the time-to-shift measure to examine the relative strength of the competing matches.
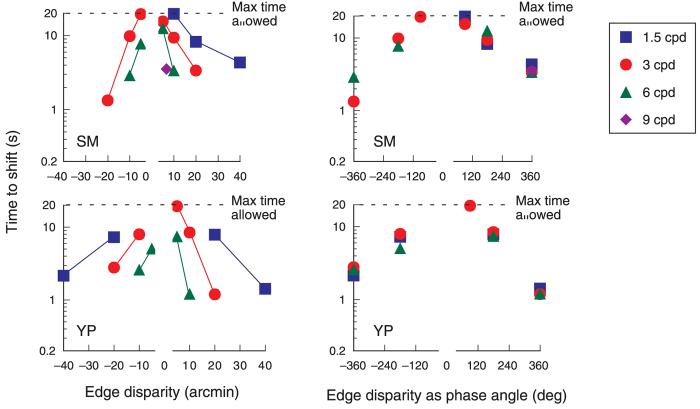
Does the absolute disparity of the repetitive pattern influence the strength of the edge match? We systematically measured the time to shift as a function of edge disparity for gratings of three different spatial frequencies, adding one measurement at a fourth spatial frequency. In this experiment, unlike the previous ones, the depth shifts could be to matching planes other than the fixation plane, because the edge disparity did not always correspond to an integral number of periods of the grating. In preliminary work, we found that the shift times were very long for small disparities. Hence, if after 20 s, a depth shift had not occurred, the trial was ended and assigned a value of 20 s. The curves on the left part of Figure 5 show the average time to shift plotted against edge disparity for both crossed and uncrossed disparities; the upper horizontal line shows the maximum time allowed for a trial. Clearly, the effect of a given disparity depends on the spatial frequency of the grating.
Figure 5.
Left graphs: Average time taken for the apparent shift from the edge plane to an alternate matching plane as a function of edge disparity for four different spatial frequencies. Negative values = crossed disparity. Right graphs: Data transformed into disparity phase angle. The transformed data show that the time to shift depends on the strength of the competing match as defined by phase disparity. Each point based on a minimum of 25 trials.
Note that a particular position disparity corresponds to different phase disparities for different spatial frequencies; for example, a position disparity of 10 arcmin equals 90° for 1.5 cpd, 180° for 3 cpd, and 360° for 6 cpd. Thus, the diverse effects of disparity shown on the left part of Figure 5 might indicate that the time to shift depends on phase, rather than position, disparity. Indeed, when these data are replotted as a function of phase disparity, a simple relationship emerges (right graphs, Figure 5). In retrospect, this outcome seems obvious. Any competing match necessarily depends on the periodicity of the grating, not its absolute disparity, so the controlling variable for these shifts in perceived depth is the phase disparity (see also Edwards & Schor, 1999).
For phase disparities of less of 180°, the initial edge-based matches were very stable, showing no shift in depth during 20 s of viewing. Apparently, the stereo system will not accept an alternative match that places the grating farther from the fixation plane than the initial match. This constraint is not a property of the stimulus geometry. In principle, the grating could shift forward or back from the edge plane, while maintaining a match of an equal number of periods (diagrammed in Figure 6). Moreover, matches involving a smaller number of periods can be made in other more distant planes. Therefore, the preference for matches near fixation undoubtedly reflects the underlying neurophysiology (Prince & Eagle, 2000a, 2000b).
Figure 6.
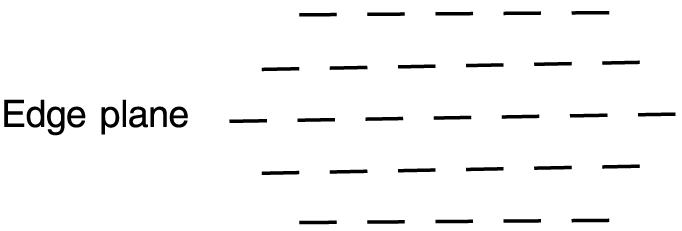
Diagram of potential matching planes for grating segment, with each dash space representing one period. The number of periods matched is symmetrically arranged around the edge plane.
Curiously, at a phase angle of 180°, the grating shifts to the opposite depth sign after extended viewing (8–10 s as shown in Figure 5). Because these ±180 matches are equivalent in distance from the fixation plane, the shift might reflect small instabilities in convergence that bring one plane closer to fixation than the other. These data also demonstrate that illusory shifts of repetitive patterns are not restricted to matches lying exactly at fixation. In a separate experiment, we presented a 3-cpd grating with an uncrossed edge disparity of 15 arcmin (270° of phase) and waited until it shifted forward. We then measured the perceived location of the forward match by presenting a probe line at one of five disparities under the shifted grating and asking observers to judge whether the grating was in front or behind the probe. The PSE (50% point) of the resulting psychometric function was approximately 5 arcmin of crossed disparity (90° crossed phase disparity), providing further evidence that a match at perfect correspondence is not required to produce a shift in depth.
Two other observations are worth noting. First, the width of the pattern affects the timing of the illusory shift. In Figure 7, we have plotted the time to shift as a function of the width of the grating for two participants. Narrow segments are much more stably matched at the edges than are wider segments. We were unable to test larger widths in our experimental setup, but presumably, a very wide segment (30° or 40° wide) would appear almost instantly in the fixation plane.
Figure 7.
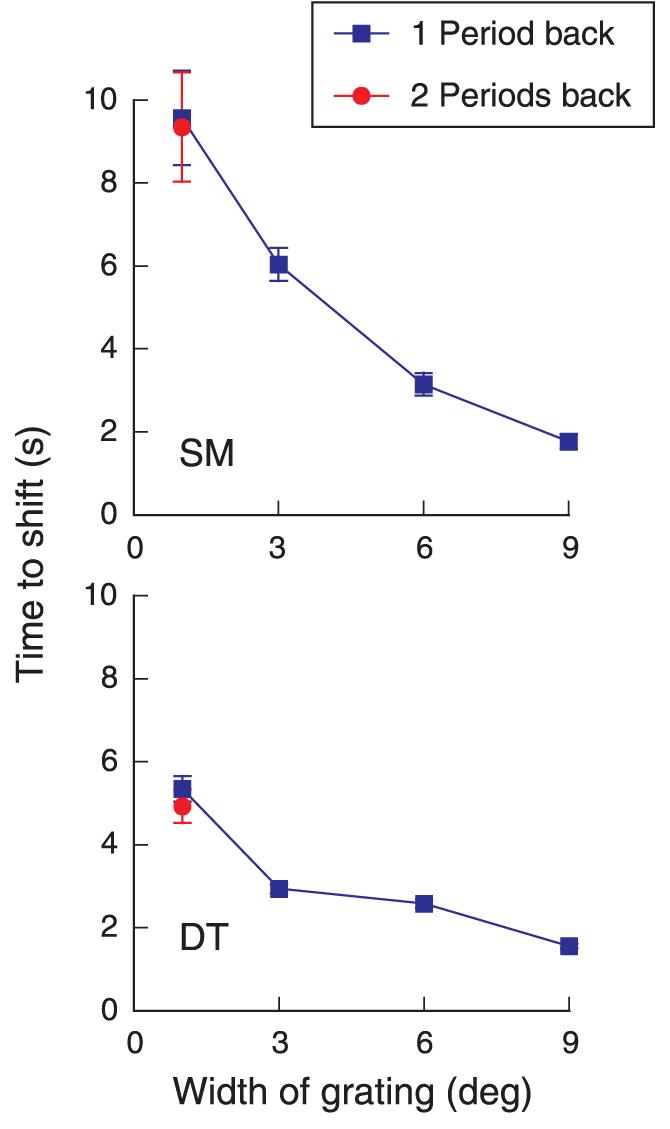
Average time to shift as a function of the width of the 3-cpd grating segment. Edges (envelope) of grating are presented at 20 arcmin uncrossed disparity (one period of the grating segment). Red point: 3-cpd grating, 1° wide, presented at 40 arcmin uncrossed disparity (two periods back). Twenty-five trials per point.
The second interesting observation is that a grating segment presented with an edge disparity equal to two periods (40 arcmin disparity) shifts directly to the fixation plane; it does not “stop” at an intervening matching plane, that is, at a disparity equal to a one-period shift. We observed this effect casually for a 6°-wide target but made more systematic measurements for a 1°-wide target, which is composed of only three periods. We found that it also shifted forward to a match in the fixation plane, despite the fact that only one period could be matched in the fixation plane. Note that the time to shift from two periods back (red point) is the same as when this target was presented only one period back. Apparently, once the edges adapt, the selected plane for the subsequent match is the plane nearest fixation, no matter where the starting point.
Stereoacuity for illusory shifts
These shifts in stereo matching to the fixation plane are called an “illusion” because, for real wallpaper, the pattern on the paper floats freely in front of the wall, far from its veridical depth plane. However, from a physiological standpoint, the responses of stereo mechanisms to the illusory shifts may be identical to those generated by features physically presented in the fixation plane. Stereo thresholds could indicate whether a shifted grating produces the same neural response as a grating presented in the fixation plane. A threshold is a measure of the signal-to-noise ratio of the responsible neural pool, so identical thresholds would suggest that the same neural pool is functioning in both cases.
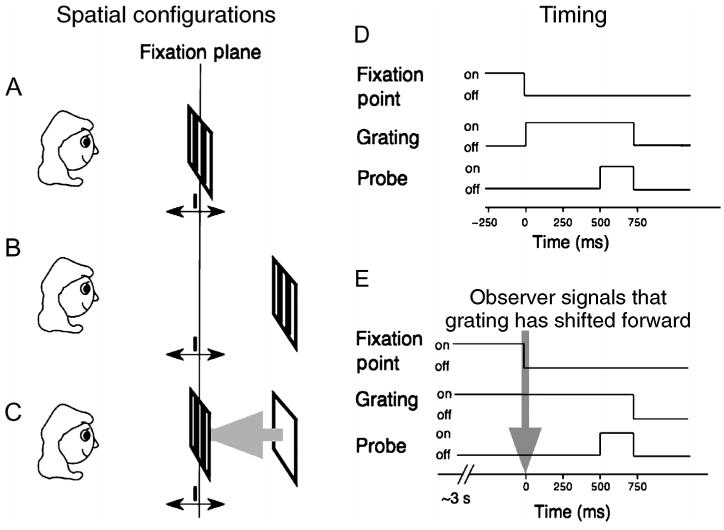
Our three test conditions are diagrammed in Figure 8. Condition A is the standard configuration for measuring stereoacuity. The test target is a 3-cpd, 6°-wide grating segment presented in the fixation plane. The black probe line, presented below the lower edge of the grating, can appear in one of five possible disparities chosen at random from a narrow range. The observer judges whether the probe target is in front or behind the grating. In Condition B, the segment is presented at an uncrossed disparity of 20 arcmin. As in Condition A, the probe changes in small steps centered on the fixation plane, but now, the observer judges whether the distance separating the grating from the probe is smaller or larger than 20 arcmin, that is, the mean disparity separating the grating from the probe. This incremental judgment of relative disparity is more difficult than the standard stereoacuity judgment, but well-trained observers achieve stable, repeatable thresholds (McKee, Levi, & Bowne, 1990). The spatial arrangements for Condition C are identical to those for Condition B, but now, the stereoacuity judgment is made after the apparent shift to the fixation plane.
Figure 8.
Diagram of experimental setup for measuring stereoacuity. The left side of the figure shows the stimulus arrangement for the three stereoacuity measurements. In Panel A, the grating edges and the probe are centered on the fixation plane. In Panel B, the grating edges are 20 arcmin (one period) behind the fixation plane, but the probe is centered on the fixation plane. In Panel C, the stimulus arrangements are identical to Panel B, but the observer waits until grating shifts forward to initiate a trial. The right side shows of the timing of the onset and offset of three features in the stimulus: fixation point (not drawn), grating segment, and test probe. The timing for Configurations A and B is diagrammed in Panel D; timing for Configuration C is shown in Panel E. Note that the onset of the probe occurs 500 ms after the fixation point has disappeared for all three configurations; probe duration = 200 ms. Grating spatial frequency = 3 cpd; contrast = 50%.
The timing of the stimulus components is crucial for the success of this experiment. As shown by the diagrams on the right part of Figure 8, the probe is visible only for the last 200 ms of any trial. Obviously, judgments about the relative disparity of the probe and grating can only be made when the probe is visible. However, if the fixation point remained visible throughout the trial, the observer might ignore the grating and base his or her judgments on the relative disparity of the probe with respect to the fixation point. To minimize this possibility for Conditions A and B, we turned off the fixation point when we presented the grating (Figure 8D) and then waited 500 ms before presenting the probe stimulus. For Condition C, we turned off the fixation point when the observer signaled that the apparent depth of the grating had shifted forward to the fixation plane (Figure 8E) and again waited 500 ms before presenting the probe. The observer might still try to make the judgment based on the previously visible fixation point because sequential judgments of relative disparity are possible (Enright, 1991; Frisby, Catherall, Porrill, & Buckley, 1997). Generally, this would be a bad strategy, because under our conditions (brief probe duration, memory-based judgment, etc.), sequential thresholds would be very poor, amounting to several minutes of arc (Enright, 1996). The important point is that after the fixation point disappears, the timing arrangements are identical for all three conditions. In all three, the probe appears 500 ms after the fixation point disappears, for 200 ms.
The results from this experiment are straightforward (Figure 9). Predictably, thresholds for the grating segment in the fixation plane (Condition A) are quite good (∼14 arcsec). Thresholds for the segment presented 20 arcmin behind the fixation plane (Condition B) are poor, averaging 68 arcsec. However, if the observer waits until the illusory shift occurs (Condition C), the thresholds for the shifted grating are identical to the thresholds for Condition A. Without any change in the physical stimulus, the perceived shift in depth has improved thresholds by a factor of five.
Could these results be produced by convergence? The observer could easily converge to the grating plane during the long wait for the forward shift. However, this change in convergence would not improve stereoacuity thresholds. Both the grating and the probe have to be in or near the fixation plane to produce optimum stereoacuity. If the observer converges back to the grating plane, the probe will lie 20 arcmin in front of the grating. As shown by the difference in thresholds for Conditions A and B, a 20-arcmin standing disparity between probe and target degrades stereo sensitivity.
On the basis of these results, we conclude that the neural response associated with the illusory shift is identical to the response to a grating physically presented in the fixation plane. Once the envelope is adapted and loses its capacity to define the matching plane of the grating segment, the carrier is matched on the basis of the interocular phase disparity. Because the carrier is at zero phase for both the fixation plane and 20 arcmin, the precision of the response is the same for both.
Discussion
The traditional explanation for the wallpaper illusion is, of course, correct. Steady convergence on a plane in front of a repetitive pattern produces a shift to a new set of matching features near the fixation plane. Note, however, that this match is not the first match selected by the stereo system. For patterns of limited extent such as our targets, the stereo system first selects a match that lies in or near the plane specified by the edges of the pattern. Then, after a few seconds, it selects a plane that corresponds to that multiple of the period that is closest to fixation. Our results indicate that the edges adapt, permitting this second match.
Logically, a sinusoidal grating may be matched in any one of numerous depth planes. However, in fact, a grating segment is seen only in one of two planes—the plane nearest fixation consistent with the phase disparity, or the edge plane. We think that these two matching outcomes arise from two separable stereo mechanisms: first-order disparity energy mechanisms and second-order envelope mechanisms.
To a local disparity energy mechanism, a grating presented with an interocular phase disparity of 360° looks identical to a grating with a zero phase disparity. The envelope that produces the depth percept associated with edge matching is invisible to the disparity energy mechanisms responding to the carrier (Cumming & Parker, 2000). However, these first-order mechanisms will accurately respond to interocular phase disparities up to 180°. Thus, it is probably their response characteristics that make matches smaller than 180° so stable (Figure 5).
From an engineering point of view, the envelope refers to a modulating function superimposed on a grating carrier—a rectangular function in our case. How does the stereo system encode the disparity of the envelope? One simple answer is that the envelope produces contrast energy in the “sidebands” of the carrier, that is, at higher and lower spatial frequencies. However, for a 6°-wide grating, the energy in the sidebands is significantly lower than the energy in the carrier, so the amplitude spectrum does not explain why the primary match follows the disparity of the envelope. Moreover, a grating segment is matched at the envelope disparity even at contrasts as low as 5%, where the estimated energy in the sidebands is subthreshold. Based on these considerations, we had earlier concluded that the envelope disparity is mediated by second-order stereo mechanisms, for example, a disparity detector that responds to the stimulus energy after rectification (McKee et al., 2004). There is physiological evidence for this type of nonlinearity in primate cortex (Read, Parker, & Cumming, 2002) and evidence for fully elaborated envelope disparity units in Area 18 of cat cortex (Tanaka & Ohzawa, 2006).
These second-order envelope mechanisms exert a remarkable modulating influence on stereo sensitivity. Here, we showed that conscious access to the most sensitive neurons responding to a target can be determined by these mechanisms. In our last experiment, when the envelope adapted, permitting a shift from the edge match to a fixation plane match, sensitivity improved fivefold. Because we made no change in the stimulus, it seems likely that the disparity mechanisms responding to the grating center were active even when the grating segment was matched far behind the fixation plane. But until the percept changed, the observer was unable to gain access to the most precise responses. Cumming and Parker (1997, 2000) found that the response characteristics of disparity-selective V1 neurons did not correspond to human (and monkey) depth percepts. Thus, they argued that perceived depth depends on extra-striate mechanisms. One such mechanism, namely, second-order envelope detectors, not only determines perceived depth but also selects which neural signals are available for making fine disparity judgments.
Are the receptive fields of these envelope detectors conveniently the size of our whole grating stimulus? Possibly, but they could also be much smaller than the grating. It all depends on how the envelope detectors modulate the response to the carrier. As shown in Figure 3, when the target is shifted laterally by 1°–1.5°, the envelope recovers from adaptation. This result argues that either (a) the receptive field of the adapted detector is considerably smaller than the grating segment and is centered on the edges or (a) the receptive fields of the second-order detectors are spatially extensive, for example, half the size of the segment, but overlap considerably. If the receptive fields of these detectors are small, then some other process is needed to propagate their signal to the center of the segment. If they are large enough to extend over the grating center, then shifting the grating laterally may engage an adjacent second-order detector whose receptive field overlaps the adapted detector. Second-order detectors do not detect the phase disparity of the carrier (Tanaka & Ohzawa, 2006), so these detectors are only adapted by the disparity of the edges, as shown by our “box adaptation” experiment. By shifting the grating segment, we may have placed the segment edges within the receptive field of a second-order unit that had not previously detected the target.
In addition to the effects of adaptation, envelope matching also depends on the strength of the edges. It is fairly obvious that the disparity response generated by a wide Gaussian envelope, that is, a wide Gabor patch, is likely to be weaker than the response generated by an equally wide rectangular envelope; the low contrast of the Gaussian tails makes the disparity information less secure. If the grating is very wide, one or both edges will fall in the periphery, also reducing the strength of the envelope response (Zhang et al., 2001). In addition, a wide grating may exceed either the extent of edge propagation to the grating center or the size of the second-order disparity detectors. Therefore, a grating that extends across an entire computer monitor will typically be matched at the phase disparity (Prince & Eagle, 2000a).
Why does the envelope adapt, permitting these illusory shifts in stereo matching? Illusory shifts are rare in natural viewing because the eyes saccade two or three times a second (Land & Hayhoe, 2001), so the envelope seldom has time to adapt. But why does it ever adapt? The envelope usually defines the true plane of a quasi-repetitive surface so the reason for the adaptation is not obvious from a teleological perspective. Adaptation seems to serve little purpose except the entertainment of human observers.
Acknowledgments
This research was supported by National Eye Institute Grants RO1-EY06644 and RO1-EY01728 and by the Smith-Kettlewell Eye Research Institute. The icon was taken from the Brewster (1844) paper in the Transactions of the Royal Society of Edinburgh.
Footnotes
Commercial relationships: none.
Contributor Information
Suzanne P. McKee, Smith-Kettlewell Eye Research Institute, San Francisco, CA, USA
Preeti Verghese, Smith-Kettlewell Eye Research Institute, San Francisco, CA, USA.
Anna Ma-Wyatt, School of Psychology, University of Adelaide, Adelaide, Australia.
Yury Petrov, Department of Psychology, Northeastern University, Boston, MA, USA.
References
- Arditi A, Kaufman L, Movshon JA. A simple explanation of the induced size effect. Vision Research. 1981;21:755–764. doi: 10.1016/0042-6989(81)90173-5. [DOI] [PubMed] [Google Scholar]
- Brewster D. On the knowledge of distance given by binocular vision. Transactions of the Royal Society of Edinburgh. 1844;15:663–674. [Google Scholar]
- Cumming BG, Parker AJ. Responses of primary visual cortical neurons to binocular disparity without depth perception. Nature. 1997;389:280–283. doi: 10.1038/38487. [DOI] [PubMed] [Google Scholar]
- Cumming BG, Parker AJ. Local disparity not perceived depth is signaled by binocular neurons in cortical area V1 of the Macaque. Journal of Neuroscience. 2000;20:4758–4767. doi: 10.1523/JNEUROSCI.20-12-04758.2000. [DOI] [PMC free article] [PubMed] [Google Scholar]
- Edwards M, Schor CM. Depth aliasing by the transient-stereopsis system. Vision Research. 1999;39:4333–4340. doi: 10.1016/s0042-6989(99)00149-2. [DOI] [PubMed] [Google Scholar]
- Enright JT. Exploring the third dimension with eye movements: Better than stereopsis. Vision Research. 1991;31:1549–1562. doi: 10.1016/0042-6989(91)90132-o. [DOI] [PubMed] [Google Scholar]
- Enright JT. Sequential stereopsis: A simple demonstration. Vision Research. 1996;36:307–312. doi: 10.1016/0042-6989(95)00099-l. [DOI] [PubMed] [Google Scholar]
- Frisby JP, Catherall C, Porrill J, Buckley D. Sequential stereopsis using high-pass spatial frequency filtered textures. Vision Research. 1997;37:3109–3116. doi: 10.1016/s0042-6989(97)00113-2. [DOI] [PubMed] [Google Scholar]
- Goutcher R, Mamassian P. Selective biasing of stereo correspondence in an ambiguous stereogram. Vision Research. 2005;45:469–483. doi: 10.1016/j.visres.2004.08.025. [DOI] [PubMed] [Google Scholar]
- Goutcher R, Mamassian P. Temporal dynamics of stereo correspondence bi-stability. Vision Research. 2006;46:3575–3585. doi: 10.1016/j.visres.2006.06.007. [DOI] [PubMed] [Google Scholar]
- Hess RF, Wilcox LM. Linear and non-linear filtering in stereopsis. Vision Research. 1994;34:2431–2438. doi: 10.1016/0042-6989(94)90287-9. [DOI] [PubMed] [Google Scholar]
- Land MF, Hayhoe M. In what ways do eye movements contribute to everyday activities? Vision Research. 2001;41:3559–3565. doi: 10.1016/s0042-6989(01)00102-x. [DOI] [PubMed] [Google Scholar]
- Langley K, Fleet DJ, Hibbard PB. Stereopsis from contrast envelopes. Vision Research. 1999;39:2313–2314. doi: 10.1016/s0042-6989(98)00271-5. [DOI] [PubMed] [Google Scholar]
- Marr D. Vision. W. H. Freeman & Co; San Francisco: 1982. [Google Scholar]
- Marr D, Poggio T. Cooperative computation of stereo disparity. Science. 1976;194:283–287. doi: 10.1126/science.968482. [DOI] [PubMed] [Google Scholar]
- McKee SP, Levi DM, Bowne SF. The imprecision of stereopsis. Vision Research. 1990;30:1763–1779. doi: 10.1016/0042-6989(90)90158-h. [DOI] [PubMed] [Google Scholar]
- McKee SP, Mitchison GJ. The role of retinal correspondence in stereoscopic matching. Vision Research. 1988;28:1001–1012. doi: 10.1016/0042-6989(88)90077-6. [DOI] [PubMed] [Google Scholar]
- McKee SP, Verghese P, Farell B. What is the depth of a sinusoidal grating? Journal of Vision. 2004;4(7):524–538. doi: 10.1167/4.7.1. 1. http://journalofvision.org/4/7/1/, doi: 10.1167/4.7.1. [DOI] [PubMed] [Google Scholar]
- McKee SP, Verghese P, Farell B. Stereo sensitivity depends on stereo matching. Journal of Vision. 2005;5(10):783–792. doi: 10.1167/5.10.3. 3. http://journalofvision.org/5/10/3/, doi: 10.1167/5.10.3. [DOI] [PMC free article] [PubMed] [Google Scholar]
- Mitchison GJ, McKee SP. Interpolation and the detection of fine structure in stereoscopic matching. Vision Research. 1987;27:295–302. doi: 10.1016/0042-6989(87)90192-1. [DOI] [PubMed] [Google Scholar]
- Prince SJ, Eagle RA. Stereo correspondence in one-dimensional Gabor stimuli. Vision Research. 2000a;40:913–924. doi: 10.1016/s0042-6989(99)00242-4. [DOI] [PubMed] [Google Scholar]
- Prince SJ, Eagle RA. Weighted directional energy model of human stereo correspondence. Vision Research. 2000b;40:1143–1155. doi: 10.1016/s0042-6989(99)00241-2. [DOI] [PubMed] [Google Scholar]
- Read JC, Parker AJ, Cumming BG. A simple model accounts for the response of disparity-tuned V1 neurons to anti-correlated images. Visual Neuroscience. 2002;19:735–753. doi: 10.1017/s0952523802196052. [DOI] [PubMed] [Google Scholar]
- Schor CM, Edwards M, Pope DR. Spatial-frequency and contrast tuning of the transient-stereopsis system. Vision Research. 1998;38:3057–3068. doi: 10.1016/s0042-6989(97)00467-7. [DOI] [PubMed] [Google Scholar]
- Tanaka H, Ohzawa I. Neural basis for stereopsis from contrast cues. Journal of Neuroscience. 2006;26:4370–4382. doi: 10.1523/JNEUROSCI.4379-05.2006. [DOI] [PMC free article] [PubMed] [Google Scholar]
- Wilcox LM, Hess RF. Scale selection for second-order (non-linear) stereopsis. Vision Research. 1997;37:2981–2992. doi: 10.1016/s0042-6989(97)00061-8. [DOI] [PubMed] [Google Scholar]
- Zhang Z, Edwards M, Schor CM. Spatial interactions minimize disparity between adjacent surfaces. Vision Research. 2001;41:2995–3007. doi: 10.1016/s0042-6989(01)00179-1. [DOI] [PubMed] [Google Scholar]


