

Abstract
The relationships between the conformational landscape, nucleotide insertion catalysis and fidelity of DNA polymerase β are explored by means of computational simulations. The simulations indicate that the transition states for incorporation of right (R) and wrong (W) nucleotides reside in substantially different protein conformations. The protein conformational changes that reproduce the experimentally observed fidelity are significantly larger than the small rearrangements that usually accompany motions from the reactant state to the transition state in common enzymatic reactions. Once substrate binding has occurred, different constraints imposed on the transition states for insertion of R and W nucleotides render it highly unlikely that both transition states can occur in the same closed structure, because the predicted fidelity would then be many orders of magnitude too large. Since the conformational changes reduce the transition state energy of W incorporation drastically they decrease fidelity rather than increase it. Overall, a better agreement with experimental data is attained when the R is incorporated through a transition state in a closed conformation and W is incorporated through a transition state in one or perhaps several partially open conformations. The generation of free energy surfaces for R and W also allow us to analyze proposals about the relationship between induced fit and fidelity.
Keywords: replication fidelity, conformational change, induced fit, enzyme catalysis, free energy landscape
INTRODUCTION
The reproduction of all forms of life depends on the accurate replication of the genome, which is facilitated by DNA polymerases.1 These enzymes increase the rate of phosphodiester bond formation by many orders of magnitude when compared with the corresponding reaction in water.2 DNA polymerases catalyze the reaction not for a single substrate, like most other enzymes, but for many structurally distinct substrates. A correct dNTP substrate is often selected for insertion by the polymerase depending on the identity of the templating base so that Watson-Crick base pairs are formed. The fidelity of DNA replication is controlled in part within the polymerase active site where phosphodiester bond catalysis occurs and by the binding site for the incoming nucleotide base paired opposite a template nucleotide. The rate of incorporation of an incoming wrong nucleotide (W) is drastically slower than the corresponding rate for the right nucleotide (R) for DNA polymerases that exhibit high replication fidelity (for review see Refs. 3–6). Since the rate of W insertion is approximately the same for all DNA polymerases irrespective of their fidelities, enzyme selectivity is primarily determined by the rate of R insertion.6,7
Despite significant experimental advances in studies of the fidelity of various DNA polymerases (e.g., Refs. 3–6 and 8–11), we still do not have a clear quantitative picture of the energetics of this process. Progress has been made in recent theoretical studies, which explored the contributions to fidelity from the binding and chemical steps,12–17 as well as on the possible roles of conformational changes18 and protein motions.19 However, progress in these key areas is still at a relatively early stage.
Additional progress in studies of the fidelity of DNA polymerase has been made by modeling the free energy contributions to the binding of correct and incorrect nucleotides.12,14,20,21 Further insight has been provided in a recent study,19 which used computer simulations to model the effect of mutations on the structure of Pol β, and examined the corresponding electrostatic effects by a qualitative analysis. Additionally, theoretical studies of related problems have been reported recently.22–25 Molecular dynamics simulations have helped delineate a possible sequence of conformational change events after dNTP binding in the catalytic cycle of Pol β.18,26,27 Finally, an attempt to progress in a more quantitative direction in the comparison of calculated and observed mutational effects has been reported recently.28 This study also introduced a useful approach of constructing interaction matrices and using them in probing the transfer of information between the binding and catalytic sites.
One of the most intriguing aspects of the action of DNA polymerases is the role of substrate-induced conformational changes in the catalytic process and the influence of these changes on DNA replication fidelity. This aspect is related to the general issue of the role of the enzyme conformational landscape in catalysis29–31 and to proposals that dynamical effects and coupled motions play a major role in enzyme catalysis.32,33 Although careful studies (for review, see Ref. 34) have questioned the validity of such proposals, there are aspects that were not explored in a conclusive way and one of these aspects is the relationship between DNA polymerase conformational changes and replication fidelity, which will be explored in this work. More specifically, based on structural and kinetic studies of Pol β, it is generally believed that the first step of the nucleotide insertion pathway includes the N-subdomain’s (equivalent to the finger subdomain of right-handed DNA polymerases) stable closing triggered by correct dNTP binding, whereas binding of an incorrect dNTP hampers this closing, consistent with an “induced fit” mechanism.35 It has been suggested that conformational changes that occur prior to the chemical step play a major role in establishing the fidelity of Pol β (e.g., Ref. 36) and DNA polymerases in general.4–6 Experimental evidence indicates that the open to closed subdomain transition is too rapid to be rate determining.37–40 Instead, we think it is considerably more likely that fidelity is determined by the binding energy plus the activation barrier of the chemical step, and that the barrier for conformational changes between the open and closed forms is not likely to determine the fidelity in Pol β.15,16 It is likely, however, that the chemical step for correct and incorrect nucleotide insertion occurs in somewhat different enzyme/substrate conformational states.6,16
To further clarify our perspective and working hypothesis we turn the reader to Figure 1. This conceptual figure has emerged from our study of T7 DNA polymerase13,16 where we concluded, based on calculations of the barrier for the rate determining chemical step, that the path along the coordinate for the chemical process passes at a somewhat different value of the “orthogonal” coordinate of the protein structural changes (typically considered as the motion between the open and closed forms). We would like to emphasize that this yet untested hypothesis is fundamentally different than related assumptions18 that the barriers for the conformational changes between the open and closed form contribute to fidelity or to the reaction rate. The barriers for the motion from the open to closed form (from ROR to RCR in Fig. 1) is not likely to influence fidelity, or for that matter, the reaction rate for both W and R as long as they are lower than the chemical barriers. Similarly the interesting possibility that the pre-chemistry barriers are different for W and R (e.g., Ref. 18) are not likely to influence fidelity as long as they are lower than the chemical barrier. In other words we are focusing here on the path between the bound incoming dNTP to the product (RCR to RCP and WCR to WCP) and on its dependence on the protein conformation, assuming (based on experimental findings) that this chemical step is rate-determining (this point will be considered further in the Discussion section).
Figure 1.
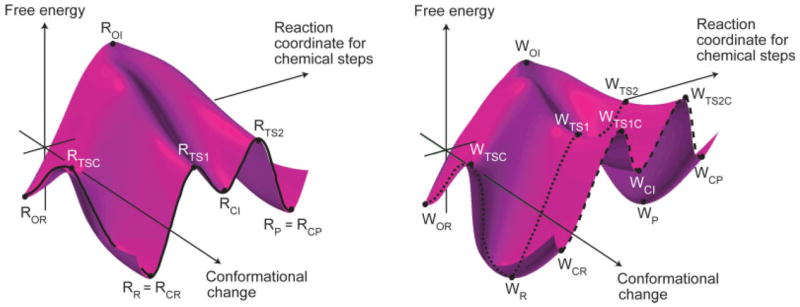
Schematics free energy surfaces that illustrate possible coupling between the conformational and chemical coordinates for the insertion of a correct (left figure) and incorrect (right figure) dNTP by a DNA polymerase. Ro and Rr designate, respectively, the open and closed configurations. R, TS1, I, TS2, and P designate, respectively, the reactant states (ES), the first TS, the first intermediate, the second TS and the product state (adapted from Ref. 16).
With the earlier perspective in mind we try here to shed some light on the following questions: (i) the possible relationship between the chemical barrier for W and R and the orthogonal protein conformational coordinate; (ii) the general relationship between the landscape of the protein conformations and the catalytic power of enzymes; (iii) the molecular meaning of the “induced fit” effect and its relationship, if any, to fidelity. Obviously these are complex problems that cannot be resolved in one study. However, Pol β offers a reasonable way of exploring these issues by allowing one to generate protein conformations between the known open and closed structures and then to evaluate the activation barrier for the chemical step for W and R. Obviously, other configurations might well be coupled to the chemical step in a tighter way, but (see later) some findings that are only based on exploring the open to closed conformational dimension might lead to quite general conclusions. In fact, despite restricting this work to the open to closed conformational space we have obtained here a useful picture on the relationship between the N-subdomain’s conformational landscape and fidelity. In particular, it is concluded that the conformation of the N–subdomain can impact replication fidelity in a non trivial way by reducing it rather than increasing it. This and other instructive findings are considered in the subsequent sections.
COMPUTATIONAL METHODS
To simulate the chemical steps in the reaction of DNA polymerase, it is essential to have a reasonable potential energy surface that describes the bond-breaking and bond-making processes. The empirical valence bond (EVB) approach provides us a powerful tool for this task. The EVB method has been described extensively elsewhere (e.g., Refs. 41–43) and we discuss several key points here.
The EVB method is a mixed quantum mechanics/molecular mechanics(QM/MM) method that describes reactions by mixing resonance states (or more precisely diabatic states) that correspond to classical valence-bond structures, which represent the reactant, intermediate (or intermediates) and product states. The potential energies of these diabatic states are represented by classical MM force fields of the form:
| (1) |
Here, R and Q represent the atomic coordinates and charges of the diabatic states, and r and q are those of the surrounding protein and solvent. αgas is the gas-phase energy of the ith diabatic state (where all the fragments are taken to be at infinity), Uintra(R,Q) is the intramolecular potential of the solute system (relative to its minimum), USs(R,Q,r,q) represents the interaction between the solute (S) atoms and the surrounding (s) solvent and protein atoms. Uss(r,q) represents the potential energy of the protein/solvent system (“ss” designates surrounding–surrounding). εi is given by Eq. (1) from the diagonal elements of the EVB Hamiltonian (HEVB). The off-diagonal elements of this Hamiltonian, Hij, are assumed to be constant, or they can be represented by a simple function, for example, an exponential function of the distances between the reacting atoms. These Hij elements are assumed to be the same in the gas phase, in solutions and in the proteins. The adiabatic ground-state energy, Eg, and the corresponding eigenvector, Cg, are obtained by solving the secular equation:
| (2) |
The EVB treatment provides a natural picture of intersecting electronic states that is useful for exploring environmental effects on chemical reactions in condensed phases. The ground-state charge distribution of the reacting species (“solute”) polarizes the surroundings (“solvent”), and the charges of each resonance structure of the solute then interacts with the polarized solvent.
The EVB approach evaluates the free-energy function Δg that is needed to calculate the activation energy, Δg‡, by using a free energy perturbation (FEP)/umbrella sampling (US) method, which has been described in details elsewhere.43
Although the EVB mapping approach explores the conformational landscape around the starting configuration, it does not explore (as explained in the discussion of Fig. 3) regions that are separated from the starting configurations by large barriers (excluding of course those changes that are captured by the EVB mapping procedure). Since we are interested here in the effect of large conformational changes, we therefore have to generate the corresponding structures by using some working hypothesis. The best option is to have direct structural information. Since limited structural information exists for “intermediate” structures, we have chosen to use the closed and open structures for Pol β and generate intermediate N–subdomain positions. The open and closed structures were obtained from the crystal structures of Pol β in the open binary (1bpx) and closed ternary (1bpy) forms.44 The simulation systems were prepared by adding the missing hydrogen atoms to both structures, and the missing 3′OH group to the DNA primer strand. All the crystal waters were taken away, except the one coordinated to the nucleotide-binding Mg2+ ion. Another water molecule was manually added to coordinate the catalytic Mg2+. For the open structure, the substrate dCTP was manually docked into the polymerase active site, followed by gas phase steepest-descent optimization to remove atom clashes. A rigid structural alignment for the open and closed conformers was performed using VMD.45 This was done by keeping the closed conformer fixed and performing a rigid rotation and translation on the open conformer to find the best root-mean-squared fit between the open and closed forms. This structural alignment was necessary because experimental data has shown that the Pol β lyase domain does not change significantly after the binding of the DNA substrate, whereas the major conformation changes occur in the N–subdomain and the polymerase active site upon binding of the dNTP substrate.46,47 Since the coordinates of both structures deposited in protein data bank (PDB) have difference in the overall orientation, we minimized the difference in a way that allowed us to use the aligned open structure as the starting point and the aligned closed structure as the target in a constrained MD simulation. After alignment, the lyase domain of both structures is almost superimposable and the root mean square deviation (RMSD) for the difference between the positions of all the atoms of the protein in the two structures is about 4 Å.
Figure 3.
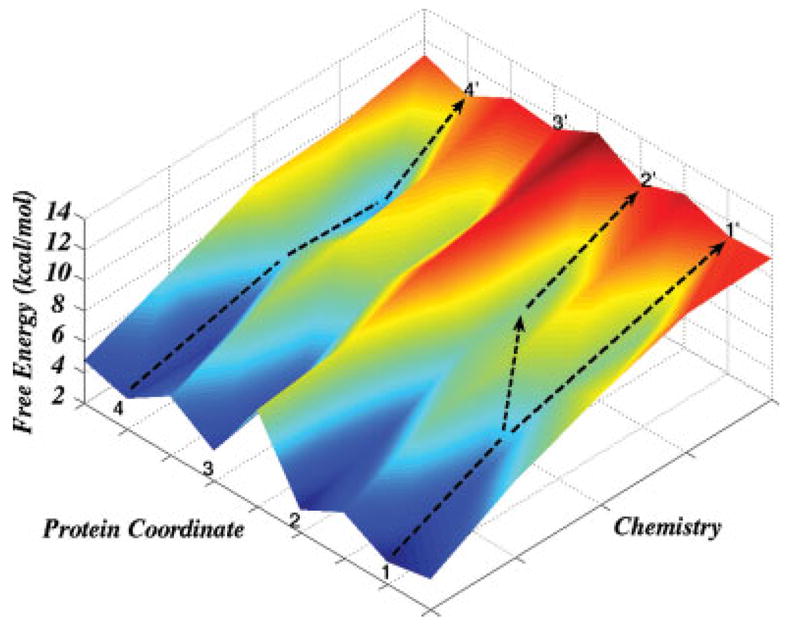
A schematic representation of the free energy landscape of the chemical step. This figure presents a situation where the barrier between points 2 and 3 is higher than 5 kcal/mol, where the barrier between points 1 and 2 is smaller. The coordinates 1–4 correspond to different protein conformations, which may all lead to chemical transition states but give different activation barriers.
The aligned structures were then solvated in a 24 Å water sphere, using the surface-constrained all-atom solvent (SCAAS) model.48 The simulation center was chosen to be within the polymerase domain, as discussed in the previous section. During the simulations, the coordinates of atoms outside the sphere were kept fixed and their interactions with atoms inside the sphere were turned off. Long-range electrostatic interactions beyond a 12-Å cutoff were treated by the local reaction field (LRF) method.49 The nonbond van der Waals (vdW) interactions were smoothed to zero beyond the same cutoff. However, the EVB and FEP calculations were done without any cutoff for the electrostatic interactions between region I and the rest of the system and all these interactions were evaluated explicitly. All simulations were performed using the MOLARIS simulation package.50 The nucleic acid bases were represented by AMBER charges51 and ENZYMIX vdW parameters (after validation that these parameters give reliable solvation energies and base-pairing energies and structures). A single center model with the vdW parameters r* = 1.30 and ε = 0.06 kcal/mol13 was used for the Mg2+ ions.
A targeted molecular dynamics (TMD)52 simulation was performed by introducing Cartesian constraint forces of the form
| (3) |
where K = 10 kcal/mol/Å 2 is the force constant and runs over all the protein heavy atoms inside the simulation sphere, and d0 is an offset constant. The open structure was used as the starting point and the closed one as the target in the simulations. Starting from different initial conditions, we ran multiple trajectories with a time step of 1 fs, and each trajectory took 2 ns. The coordinates of the structure of the whole system were saved every 1 ps for later analysis. A few intermediate structures were chosen for the subsequent FEP/EVB calculations.
Since our focus is on the polymerase N-subdomain, the simulation center and radius were carefully chosen to enable the simulation sphere to accommodate the entire subdomain and also allow sufficient space for the atoms to move in the direction determined by the TMD. We also change the center gradually in a series of simulations. Explicit water molecules were added to solvate the system. Since it is well known that TMD can generate unphysical structures, a long time MD relaxation was carried out after each specified RMSD was reached. Furthermore, careful visual inspection was conducted to ensure that the generated structures were reasonable.
The structures with mispairs (G:A, G:G, G:T) in the nascent base pair binding pocket were constructed by manually docking the corresponding dNTP to the generated intermediate and closed conformers. Then, the same procedure as earlier was followed to solvate the system, and a regular MD relaxation of 500 ps was performed to bring the system temperature from 0 to 310 K until equilibrium was reached. These relaxed structures served as the ground states for calculating the free energy profiles of the chemical step.
The EVB calculations require information about the reaction mechanism and the potential surface for the solution reaction as well as the most likely mechanism for the reaction in the protein. In the case of the reaction catalyzed by Pol β, there is still debate about whether phosphodiester hydrolysis reaction follows an associative, dissociative or concerted mechanism. Careful EVB calculations of activation free energies calibrated on ab initio calculations13 and ab initio QM/MM mapping studies17 have indicated that an associative mechanism is the most likely reaction mechanism for correct nucleotide insertion. Thus, for chemistry in the active site of Pol β, we assumed the reaction takes place in the three steps depicted in Figure 2; a proton transfer from the primer 3′OH is followed by an in-line nucleophilic attack of 3′O− on the dNTP α-phosphate, and the reaction is completed by the departure of the pyrophosphate leaving group. For the proton transfer step, there are also several possibilities: the proton of the primer 3′OH could either transfer to Asp256, 5′-oxygen or a nonbridging oxygen of the dNTP α-phosphate, or a surrounding water. Based on previous simulations, it seems most likely that the dominant mechanism involves a proton transfer to an acidic group (Asp256 in Pol β and Asp654 in T7)13,17,28 or water16,28 followed by nucleophilic attack on Pα by the deprotonated 3′OH and formation of a pentavalent intermediate in an associative mechanism. The nature of the exact surface is still an open question (it may require a more concerted and flat surface) but the overall changes between the W and R activation barriers are assumed to be similar for both surfaces. Here, we based the EVB on the stepwise mechanism described in Figure 2. This is viewed as a convenient strategy that is useful also for studies of the concerted mechanism.
Figure 2.
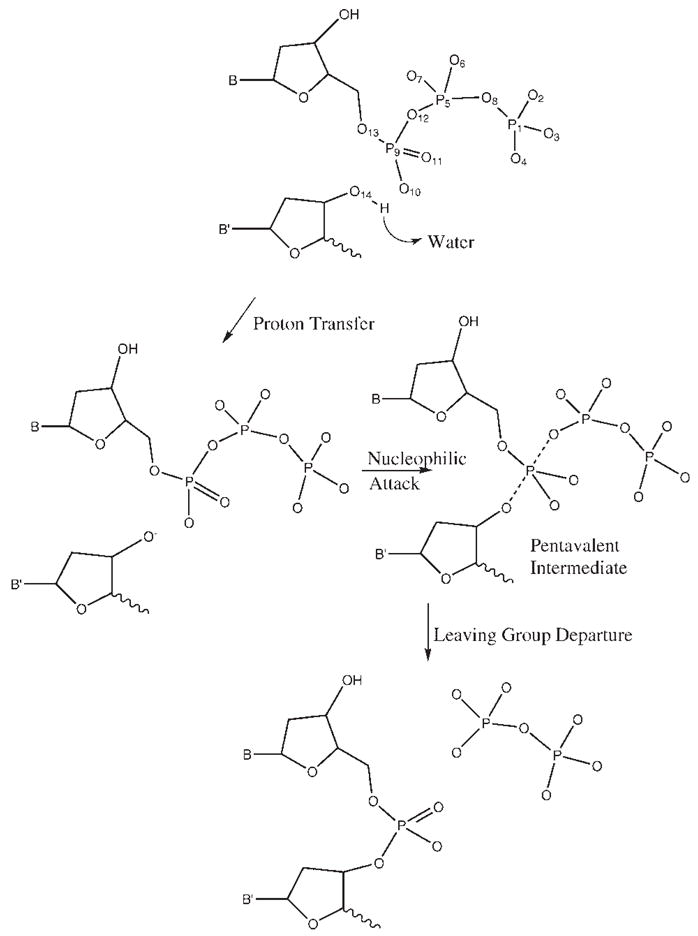
The assumed chemical steps of the nucleotide incorporation reaction of Pol β.
The nucleotide incorporation reaction in Pol β involves an initial proton transfer step. In principle, to have a complete reaction free energy profile, we need to calculate the proton transfer activation barrier, Δg‡PT. But since this step is not likely to be rate limiting, it is sufficient just to calculate the proton transfer reaction energy, ΔGPT, which in turn requires calculating the pKa shift of the proton donor. The pKa shift of the ribose 3′OH group in the protein is calculated by using the FEP method and the following relationship53
| (4) |
ΔGPT is then calculated as
| (5) |
The pKa of the ribose 3′OH in water is taken as 13.54 Here pKa,3′OH = 13 + ΔpKa and pH = 7 are used in the calculations.
The free energy profiles of the P—O bond-forming and bond-breaking reaction were calculated by the EVB method. The reference solution reaction is chosen as the attack of CH3O− on dCTP4− in the presence of two Mg2+ ions in water. The calculated EVB surface was adjusted by forcing it to give an activation barrier of 21 kcal/mol to reproduce the corresponding experimental estimate and the general features found by previous ab initio calculations.13 The resulted EVB parameters are summarized in Table I. The same EVB parameters were then used without any change in the simulation of the reaction in Pol β. The EVB simulations were carried out using the SCAAS model.48 The simulation center was chosen as the geometric center of the selected EVB atoms. The electrostatic long range effects were treated without a cutoff by using the LRF method.49 The EVB mapping was carried out in 21 windows each of a simulation time of 20 ps, with a time step of 1 fs at 310 K.
Table I.
The EVB Parameters Used in the Present Work
| Reactant state
|
Intermediate state
|
Product state
|
||||
|---|---|---|---|---|---|---|
| Atom no. | Charge | Atom type | Charge | Atom type | Charge | Atom type |
| 1 | 1.336 | P0 | 1.343 | P0 | 1.370 | P0 |
| 2 | −0.963 | O− | −0.993 | O− | −1.035 | O− |
| 3 | −0.963 | O− | −0.993 | O− | −1.035 | O− |
| 4 | −0.963 | O− | −0.993 | O− | −1.035 | O− |
| 5 | 1.487 | P0 | 1.402 | P0 | 1.370 | P0 |
| 6 | −0.921 | O− | −0.956 | O− | −1.035 | O− |
| 7 | −0.921 | O− | −0.956 | O− | −1.035 | O− |
| 8 | 0.594 | Op | 0.541 | Op | 0.530 | Op |
| 9 | 1.341 | P0 | 1.548 | P+ | 1.270 | P0 |
| 10 | 0.901 | O− | 0.933 | O− | 0.810 | O− |
| 11 | 0.901 | O− | 0.933 | O− | 0.810 | O− |
| 12 | 0.617 | Op | 0.781 | Op | 1.035 | O− |
| 13 | 0.420 | O0 | 0.448 | O0 | 0.329 | O0 |
| 14 | 1.000 | O− | 0.766 | Oq | 0.321 | Op |
|
Ebond = Kb(1 − e−β(r − r0))2
| ||||||
| Atom1 | Atom2 | Kb | r0 | β | ||
|
| ||||||
| P0 | O0 | 95.0 | 1.58 | 2.0 | ||
| P0 | Op | 85.0 | 1.70 | 2.0 | ||
| P0 | Oq | 85.0 | 1.70 | 2.0 | ||
| P0 | O− | 120.0 | 1.50 | 2.0 | ||
| P+ | O0 | 80.0 | 1.65 | 2.0 | ||
| P+ | Op | 50.0 | 2.10 | 1.0 | ||
| P+ | Oq | 50.0 | 2.10 | 1.0 | ||
| P+ | O− | 100.0 | 1.52 | 2.0 | ||
|
Eangle = Kθ(θ − θ0)2 + D(1 − e−(θ − θ0)2/ζ)
| ||||||
| Atom type | Ky | θ0 | D | ς | ||
|
| ||||||
| O0 | 80.00 | 109.5 | 0.00 | 1.00 | ||
| Op | 80.00 | 140.0 | 0.00 | 1.00 | ||
| Oq | 0.00 | 109.5 | 40.00 | 0.48 | ||
| O− | 50.00 | 120.0 | 0.00 | 1.00 | ||
| P0 | 140.00 | 119.2 | 0.00 | 1.00 | ||
| P+ | 0.00 | 120.0 | 60.00 | 0.43 | ||
|
Etorsion = Kt (1+cos(nφ −φ0)
| ||||||
| Atom type | Kt | n | ϕ0 | |||
|
| ||||||
| P0 | O0 | 3.0 | 3.0 | 0.0 | ||
| P0 | Op | 2.0 | 3.0 | 0.0 | ||
| P+ | O0 | 3.0 | 3.0 | 0.0 | ||
| P+ | O− | 3.5 | 3.0 | 0.0 | ||
| P+ | Op | 2.0 | 3.0 | 0.0 | ||
| P+ | Oq | 2.0 | 0.0 | 0.0 | ||
| van der Waals Parameters
| ||||||
| Atom type | A | B | ||||
|
| ||||||
| O0 | 774.0 | 24.0 | ||||
| Op | 1379.0 | 36.0 | ||||
| Oq | 774.0 | 24.0 | ||||
| O− | 1379.0 | 36.0 | ||||
| P0 | 1250.0 | 24.0 | ||||
| P+ | 1500.0 | 24.0 | ||||
RESULTS AND ANALYSIS
In exploring the energetics of the transition states (TSs) in Pol β and related systems we will focus on the chemical step in Figure 1, considering a relatively wide region in the reactant state (RS). In this case one faces a situation of the type presented in Figure 3, where the activation free energy of the chemical step reflects all the possible paths in a rather complex landscape. The coordinates 1–4 correspond to different protein conformations, which may all lead to chemical TSs but give different activation barriers. Pulling the system from its RS to its TS by the FEP/US approach described in the Method section, for say 1 ns, does not allow the system to jump between regions, which are separated by more than 5 kcal/mol barriers along the protein coordinate. Thus starting at point (1) in Figure 3 and then performing a FEP/US mapping will leave the system in the region between 2′ and 1′. A more complete mapping should include starting at the (3)–(4) region and averaging the results of the different mappings. Of course, there might be additional challenging problems, such as the fact that in reality when Δg‡<Δg(2)–(3) there may be transitions between these states that are not sampled by the FEP/US simulation. This challenging issue will be addressed in later studies. At present we believe that most of the physics of having somewhat different landscape for W and R can be explored by starting the simulations of Δg‡ from different initial configurations. Thus we started by generating representative protein conformations that included the open, closed, and intermediate structures according to the procedures outlined in the Method section. We will refer to the TS conformation as the conformation obtained by starting at a given conformational region of the protein and then allowing the system to reorganize during the umbrella sampling mapping to the TS.
The TMD generation of intermediate structures involved the use of the Cartesian constraint described in the Method section that allowed us to move between the closed and open conformations depicted in Figure 4. An intermediate conformation (the one marked in black in Fig. 6) as well as the closed and open conformations is depicted in Figure 4. As seen from the figure, the overall closed to open structural change involves a change in the conformation of the α-helix N (residues 275–295) of the N–subdomain. The structural changes in this region are of interest since substrate binding brings this α-helix to close contact with the nascent base pair of the template and incoming dNTP. Mutational studies7,37,56–60 have indicated that some residues (e.g., Asp276, Lys280, and Arg283) in this helix play an important role in controlling Pol β replication fidelity. The figure depicts structural changes of the Mg2+ coordinated residues since this environment plays an important role in the chemical step.
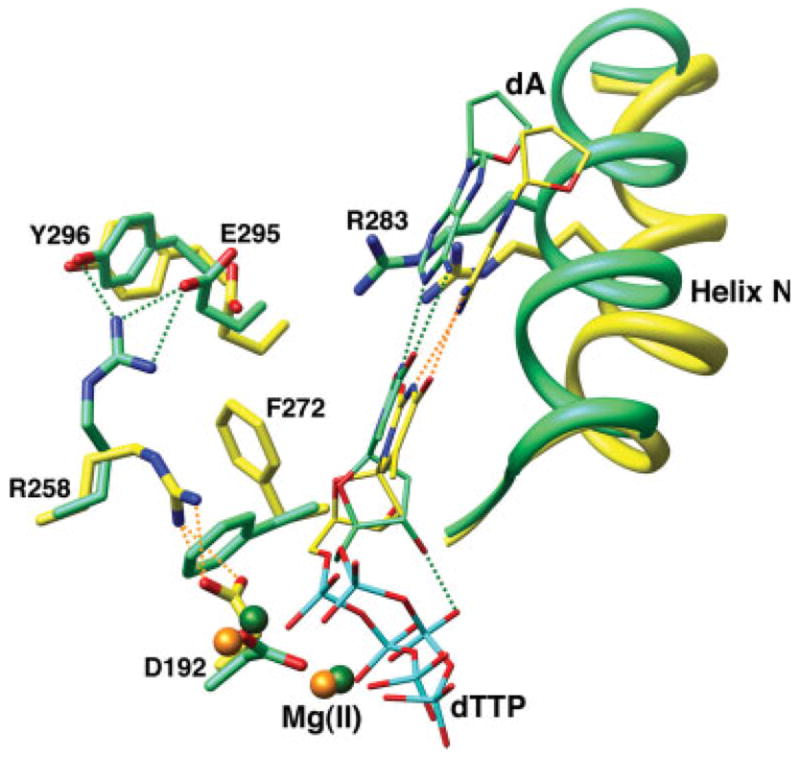
Figure 4.
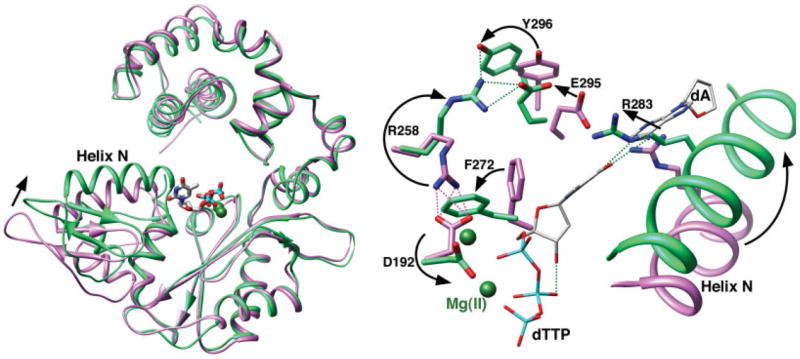
Open and closed conformations of key Pol β and DNA residues. The crystallographic structure of the C-subdomain of the open binary DNA (pdb accession code 1BPX; pink) and closed ternary complex (green) were superimposed. Left panel: Ribbon representation of Pol β illustrating the open and closed conformations of the carboxyl-terminal N-subdomain as highlighted by α-helix N. The incoming nucleotide (dTTP) and active site Mg2+ (dark green spheres) are shown, but the DNA is omitted for clarity. Right panel: The position of the N-subdomain can be monitored in the active site through a series of altered interactions between Asp192 (D192), that coordinates both active site metals, and Arg283 (R283) that is situated in α-helix N and interacts with the minor groove edge of the templating strand. The arrows represent motions associated with the closing transition. The nascent base pair (dA—dTTP) is illustrated (gray carbons), but the duplex DNA is omitted for clarity. This figure was made with Chimera.55
Figure 6.
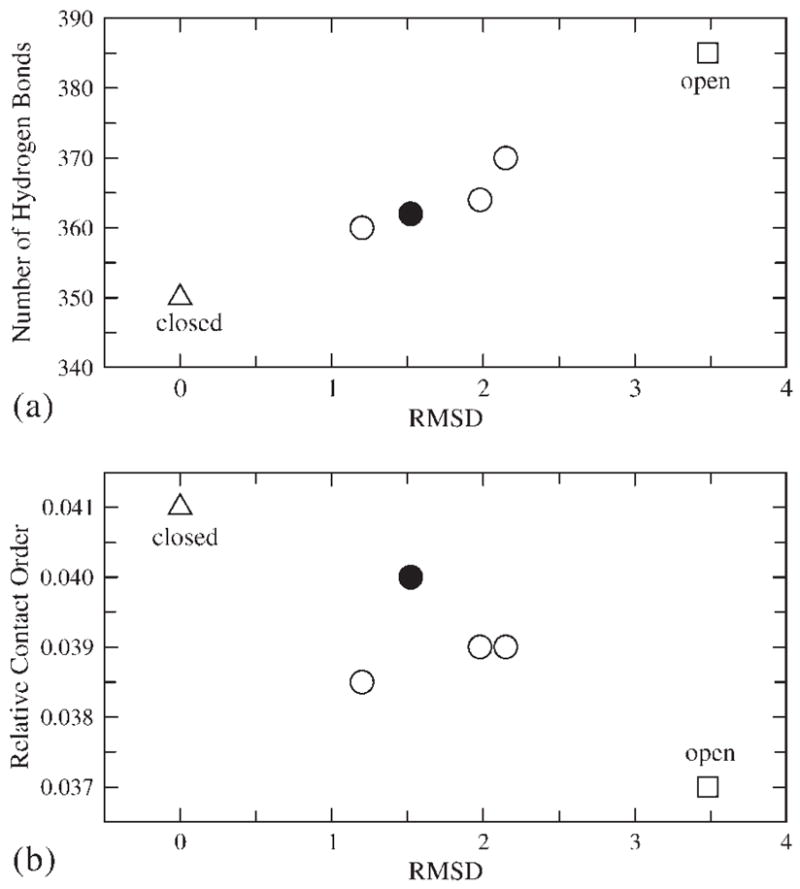
The representation of the configurations considered in this work, in terms of (a) the number of hydrogen bonds and the RMSD and (b) the relative contact order and RMSD. The calculations of these quantities only include the Pol β polymerase domain, not the DNA and dNTP substrate. The criterion used for identifying hydrogen bond is R(X-H…Y)∈[2.5,3.5] Å. The relative contact order is calculated as originally defined in Ref. 62.
The generated intermediate conformations are more or less half way between the closed and open structures and a typical intermediate structure is depicted in Figure 5. Another way to view the structural changes is to consider the overall conformational space in terms of the parameters used in studies of protein folding. This is done in Figure 6, where we describe the configurational space in terms of the RMSD relative to the closed structure (considering all the protein atoms) and the number of hydrogen bonds, Nhb, or alternatively the relative contact order, Sco61,62. At present it is not clear how these parameters are likely to change during protein folding or conformational transitions (whether linearly or nonlinearly). Searching for appropriate reaction coordinates or order parameters for describing these processes in complex systems remains a challenge. However, one can use these parameters as a measure of the progress of the forced structural change in the simulations. As shown in Figure 6, Nhb and Sco for intermediate structures fall between the corresponding values of the open and closed structures. The absence of any sudden jump indicates a smooth transition during the Pol β open to closed conformational change. Additional data points will be required to derive a complete transition pathway.
Figure 5.
Intermediate and closed conformations of key Pol β and DNA residues. The C-subdomains of the calculated intermediate (yellow) and closed ternary complexes (green) were superimposed. The nascent base pair (dA—dTTP) and active site Mg2+ (spheres) are shown, but the DNA is omitted for clarity. The position of the N-subdomain can be assessed through the position of α-helix N and several key active site residues. The view is similar to that in Figure 4 (right panel).
Although we have used the crystal structure of a matched base pair system (G:C) in the closed conformational state as the target in the TMD simulations, it is possible that the generated configurations may not represent the actual conformation sampled by the TS of the wrong dNTP. This is the most likely case if the relevant configurations do not occur along the open-close pathway. However, as will be discussed in the next section, the present treatment is still instructive.
We also like to emphasize that we do not consider the TMD as an optimal approach for exploring conformational states and we are refining new approaches that use simplified folding models for such a task.63 However, as will be shown later, we do not need to know the free energy for transitions between the different protein conformational states because we use an alternative approach to obtain the relevant information.
After generating the conformations described earlier, we performed systematic EVB calculations of the activation barriers for the chemical steps described in Figure 2 and discussed in the Method section. The calculations were done with correct and incorrect base pairs in the different protein conformations described earlier. The results of these simulations are summarized in Table II and the calculated activation barriers are compared with the corresponding barriers obtained by applying TS theory to the kpol determined by kinetic measurements.64 In doing so it is assumed that kpol represents the rate constant of the chemical step. As seen from the table, we have good agreement between the calculated and observed activation barriers for the incorporation of the correct nucleotide. The situation with the incorrect nucleotide is far more complicated (see Fig. 7 for a typical behavior). Here we see that the barriers depend very strongly on the generated conformations. In general, it appears that the barriers for the mismatches are reduced significantly in conformational states that correspond to partially open structures. This trend, which was already predicted from qualitative considerations,16 seems to hold for the more quantitative analysis described here. The overall trend is illustrated in Figure 8 for G:C and G:A.
Table II.
Calculated and Observed Chemical Free Energies of the Nucleotide Incorporation Reaction of Pol βa
| Observed
|
Calculated
|
|||||||
|---|---|---|---|---|---|---|---|---|
| Base pair (template:primer) | kpol (1/s) | Δg‡cat (kcal/mol) | ΔGPT (kcal/mol) | Δg‡cat, Nuc (kcal/mol) | Pentavalent intermediate (kcal/mol) | Δg‡cat, PO (kcal/mol) | Product (kcal/mol) | Δg‡cat (kcal/mol) |
| G:C | 12.50 | 16.6 | 2.4 | 13.9 | 11.4 | 4.3 | −10.2 | 18.1 |
| 2.5 | 15.5 | 14.2 | 3.9 | −8.2 | 20.6 | |||
| 2.0 | 15.2 | 12.8 | 6.0 | −9.6 | 20.8 | |||
| 3.5 | 14.4 | 12.1 | 5.8 | −9.2 | 21.4 | |||
| 3.3 | 14.5 | 13.0 | 6.4 | −6.8 | 22.7 | |||
| G:T | 0.37 | 18.7 | 2.6 | 26.2 | 25.0 | 4.2 | −5.0 | 31.8 |
| 3.7 | 18.4 | 15.3 | 3.8 | −4.1 | 22.8 | |||
| 3.2 | 19.3 | 17.1 | 2.8 | −7.2 | 23.1 | |||
| 5.3 | 24.3 | 21.0 | 3.2 | −7.2 | 29.5 | |||
| 3.0 | 17.2 | 14.5 | 6.2 | −7.5 | 23.7 | |||
| G:A | 0.02 | 20.5 | 3.0 | 25.3 | 24.2 | 7.0 | 3.5 | 34.2 |
| 4.2 | 22.4 | 19.8 | 4.5 | 2.1 | 27.5 | |||
| 2.3 | 24.8 | 22.0 | 5.5 | −6.0 | 29.8 | |||
| 3.3 | 18.0 | 16.6 | 5.4 | −3.7 | 25.3 | |||
| 4.1 | 15.6 | 14.4 | 6.5 | −5.5 | 25.0 | |||
| G:G | 0.04 | 20.1 | 5.2 | 18.3 | 17.4 | 5.5 | −4.5 | 28.1 |
| 4.3 | 17.5 | 15.2 | 4.6 | −5.0 | 24.1 | |||
| 3.8 | 18.0 | 16.2 | 5.2 | −5.3 | 25.2 | |||
| 3.8 | 18.7 | 15.3 | 4.4 | 2.0 | 23.5 | |||
| 4.8 | 18.2 | 14.6 | 6.3 | 1.5 | 25.7 | |||
The observed kpol from the kinetic measurement64 is interpreted as the rate constant of the chemical step. For each base pair we give the calculated results for the closed configuration in the first row (bold) and the four intermediate configurations in the following rows. The value of Δg‡cat was obtaind by combining ΔGPT, the energy of the pentavalent intermediate, and Δg‡cat, PO.
Figure 7.
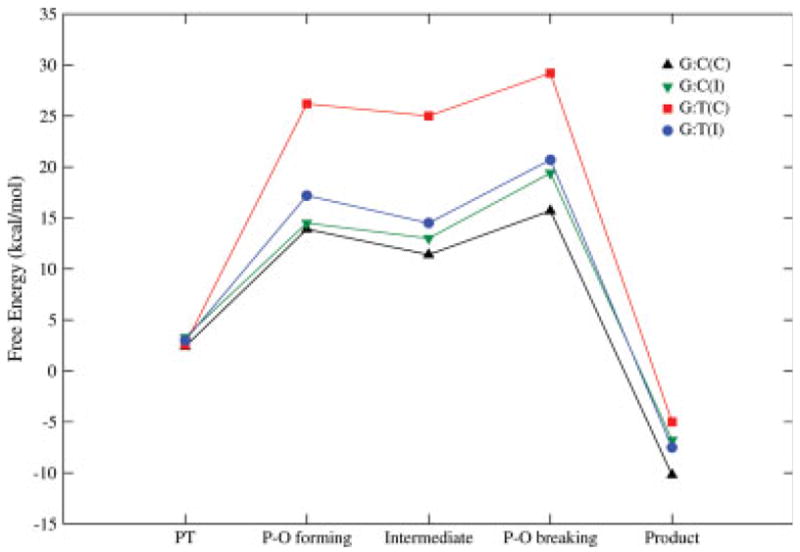
Reaction free energy profiles for G:C and G:T in the closed and intermediate configurations.
Figure 8.
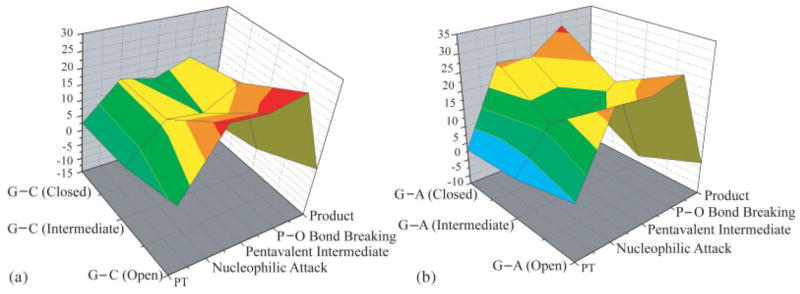
Free energy profiles for (a) G:C and (b) G:A in the space defined by the protein conformational coordinate and the chemical reaction coordinate in the open, intermediate and closed conformations. The figure only considers the reaction profiles for the closed, intermediate and open conformations and connects them by a simple interpolation. This treatment does not take into account the barriers between the states (e.g., see a schematic description in Fig. 3), which were not evaluated in this work. However, the figure establishes that the TS energy for W is lower in the intermediate conformation than in the closed conformation.
The evaluation of Figure 8 should also include the estimate of the effect of the conformational changes on KD and this would require additional extensive study (e.g., see Ref. 28). Here we decided to focus on a qualitative estimate that seems to be sufficient to provide general support for our findings. That is, we considered the thermodynamic cycle of Figure 9 and obtained the relationship
Figure 9.
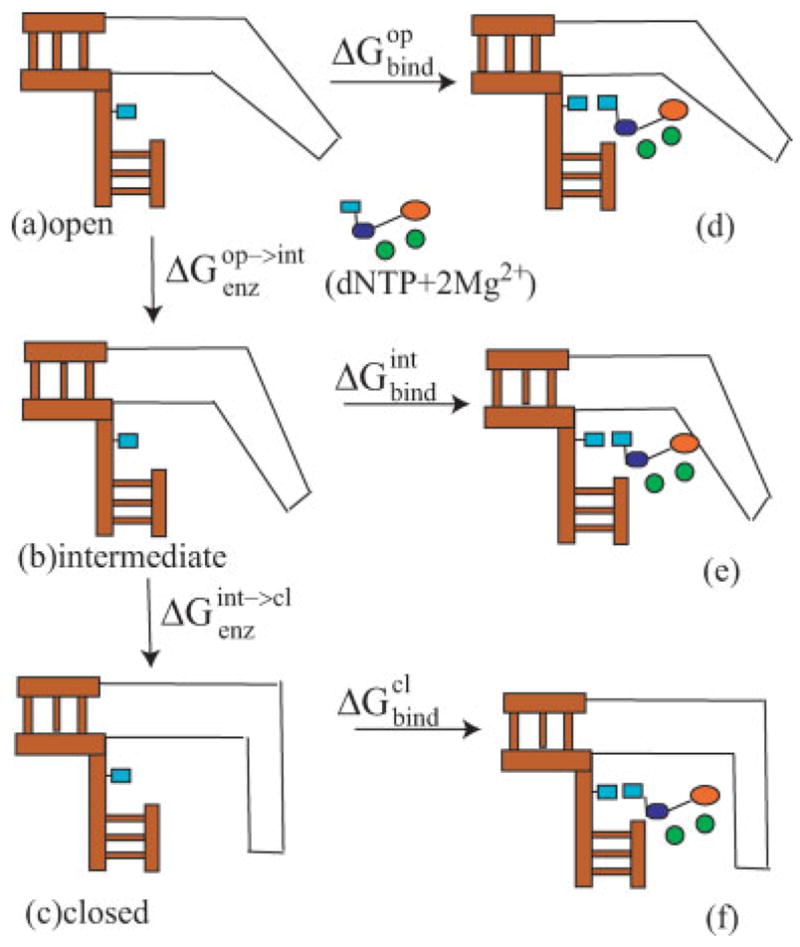
A schematic description of the thermodynamic cycle used to evaluate ground state binding in different protein conformations.
| (6) |
where the different terms in the equations are defined in Figure 9. In this case, it is sufficient to show that (where W designates “wrong”) is small or nagative, to support the trend of Figure 8(b). Thus we calculated and by the microscopic linear response approximation (LRA) method as done in Ref. 28. The corresponding results are summarized in Table III. The calculations reproduce the general observed trend of having reduced binding (ca. 4 kcal/mol) for W, but more importantly, for the purpose of the present article, they indicate that the bound W is more stable in the intermediate conformation. We also noted that is probably negative (since op is more stable than cl in the absence of the “substrate” (dNTP + 2Mg2+) and since int is on the way from op to cl. Thus is most probably negative. Adding this result to the finding of a lower barrier in the chemical step of W provides further support to the general trend of Figure 8 where the overall barrier that corresponds to kpol/KD for W is lower at the intermediate state than in the closed state. At any rate, since the change in the energy of the ES ternary complex for op→cl is negative for R and less negative for W with a positive trend for int→cl, this contribution appears to be smaller than the changes in the chemical barrier and thus were not incorporated in Figure 8.
Table III.
Calculated and Observed Ground State Binding Free Energiesa
| Observed | Calculated | |||
|---|---|---|---|---|
| ΔGbind (kcal/mol)
|
||||
| Base pair (template:primer) | KD (uM) | ΔGbind (kcal/mol) | Closed | Intermediate |
| G:C | 1.9 | −8.1 | −12.4 | −7.2 |
| G:T | 650 | −4.5 | −7.3 | −9.4 |
| G:A | 270 | −5.0 | −8.5 | −9.1 |
| G:G | 360 | −4.9 | −5.4 | −7.3 |
The observed KD’s were taken from Ref. 64. The binding energy calculation was carried out using the LRA method for the closed and one of the generated intermediate conformations. The calculations are based on the scheme shown in Figure 9. A dielectric constant εeff = 12 was used, according to our previous study. 28
The calculated features reported in Figure 8 can depend on the protonation states of the protein ionizable residues and in principle these ionization states can be different for different protein conformations. To explore this effect we evaluated the ionization states of some key residues in the closed and partially open configuration of W by the PDLD/S-LRA approach.65 As shown in Table IV, the ionization states are likely to stay similar in both structures. Moreover, the relatively small effect of the ionizable groups on the TS binding energy (that has been evaluated in our recent work by combining calculations and mutational analysis28) indicates that even if few groups change their ionization states, we will still have lower energy for the TS of W in the intermediate state than in the closed state.
Table IV.
Calculated pKa of Some Key Residues in the Closed and One of the Intermediate Conformationsa
| Residue | Closed | Intermediate |
|---|---|---|
| Arg183 | 13.9 | 13.8 |
| Asp190 | −3.4 | −4.7 |
| Asp192 | −3.4 | −3.4 |
| Arg254 | 11.2 | 11.4 |
| Asp256 | 0.0 | −0.3 |
| Arg258 | 11.4 | 11.7 |
| Asp276 | 3.6 | 3.5 |
| Lys280 | 9.3 | 10.3 |
| Arg283 | 11.4 | 12.2 |
The calculations provide the PDLD/S_LRA results for the apparent pKa’s for the set of dielectrics εp = 20 and εeff = 40. The use of εp= 20 is dictated by the explicit representation of the Mg2+ ion whose effect must be screened by a relatively large dielectric constant.
To further clarify the origin of the calculated conformational effects, we evaluated the electrostatic contributions of selected residues to the TS energy of the (G:A) mispair. These calculations used the relationship
| (7) |
where QiTS and Qjm are, respectively, the partial charges of the ith atom of the substrate at the TS and jth atom of the mth protein residue, rij is the distance between the i and j atoms (given in Å) and ΔG is the electrostatic contribution. The effective dielectric constant, εeff, was taken as 12 and 4 for ionized and neutral residues, respectively, following previous experimentally based parameterization.28 The calculations included all the protein residues. The calculated changes in the electrostatic contributions upon the closed to intermediate transition are depicted in Figure 10. As shown in the figure, we predicted significant changes for some residues, for example, Asp190, Arg258, Asp276, and the Mg2+ ions. Having a large effect from these groups is consistent with mutational studies and previous studies of the protein allosteric effect.28 However, more refined analysis would benefit from experiments that will probe the effect of Pol β mutations on the structural changes induced in this enzyme by TS analogues.
Figure 10.
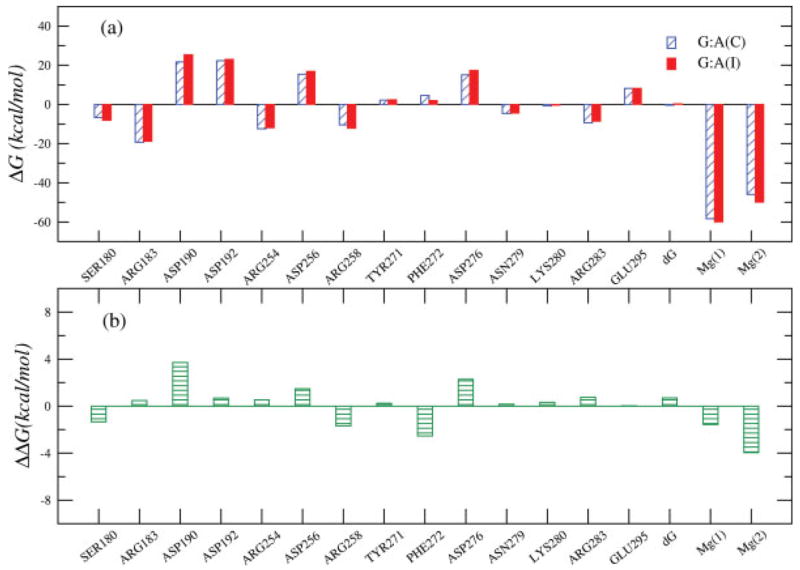
The change in the electrostatic contribution to the transition state binding free energy for the G:A mispair for the transition from the closed to an intermediate structure. ΔΔG corresponds to the difference between the values reported in the upper figure for the intermediate and closed states.
DISCUSSION
Landscape and fidelity
The fidelity of DNA polymerase reflects an allosteric competition between the binding of the base of the incoming dNTP to the base-binding site and the binding of the TS to the catalytic site. In the case of an incorrect dNTP, poor preorganization in the base-binding site and poor binding of the base lead to structural rearrangements that are propagated to the catalytic site and destroy its preorganization.28 This allosteric control of fidelity is described in Figure 11. Applying this concept and previous findings28 to the results presented in Figure 8 indicates that the binding of an incorrect base in the closed configuration results in a larger destruction of the preorganization of the active site than would be expected from experimentally measured Pol β catalysis (Table II). This effect appears to be reduced in some generated intermediate configurations. Thus the structural changes per se do not increase fidelity but instead reduce the very large difference in fidelity that would occur if both the W and R reactions were to involve the same closed structure. This means that the coupling to conformational changes is not the origin of the fidelity (if it was, then the conformational change would lead to larger fidelity).
Figure 11.
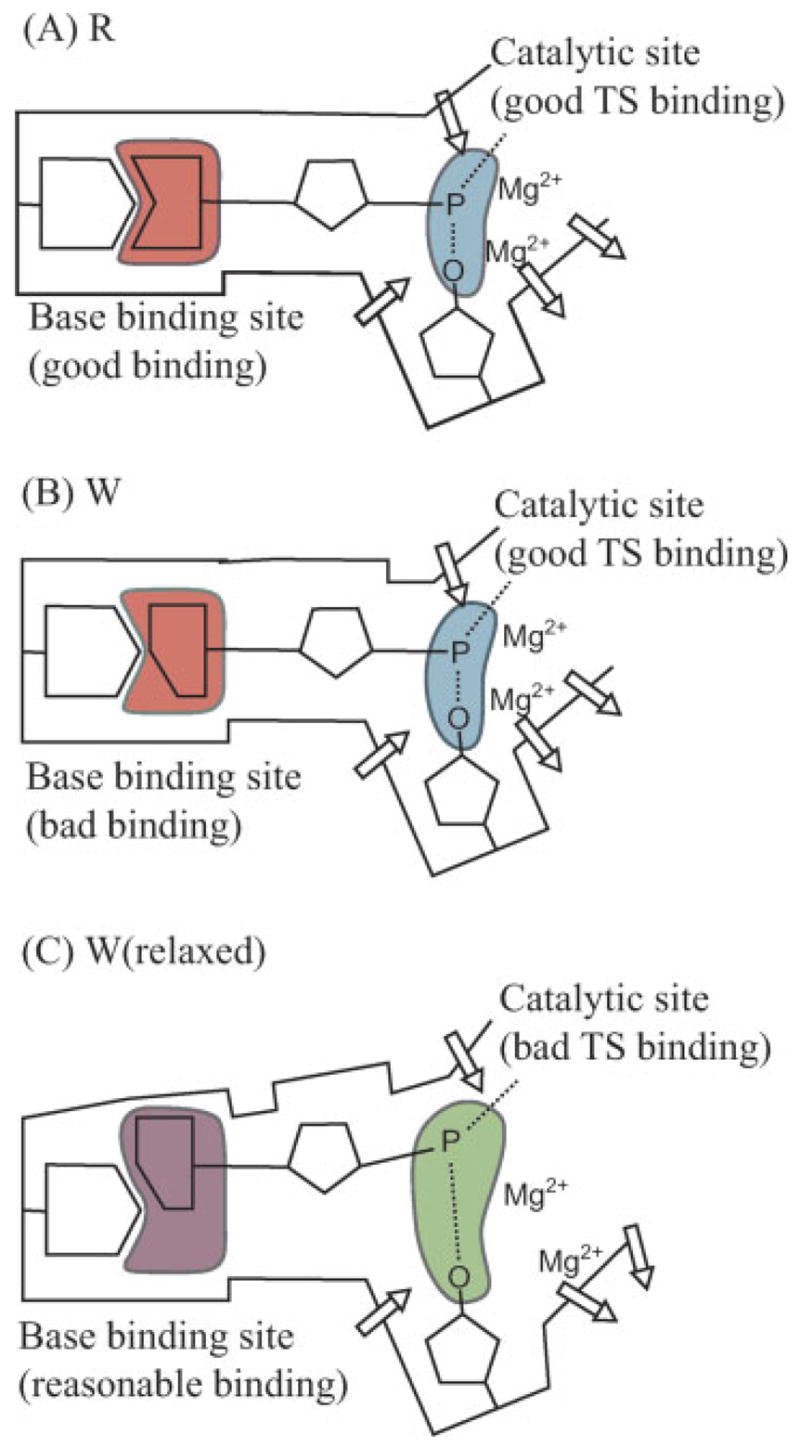
A schematic description of our view of the origin of the fidelity on DNA polymerases. The protein provides perfect sites for both the chemical and base-pairing parts of R. On the other hand, in the case of W, the protein has to relax in the base-pairing site and this relaxation destroys the preorganization in the chemical part. Arrows indicate the protein dipoles.
A recent study66 used a conformationally sensitive fluorophore attached to the recognition domain of T7 DNA polymerase to probe structural changes. Kinetic analyses suggest that the conformational changes associated with the florescence kinetics are those involved in the alignment of the catalytic site for R and for the misalignment of the active site for W. It was then suggested that conformational changes that occur after the binding step and before the chemical step play a major role in controlling the fidelity of DNA polymerases. It was suggested that this step is used to align the active site for the correct nucleotide.
Although these findings are potentially important, it is important to realize that there are many possible structural changes and only some of them have an impact on the chemical step. It is likely that the fluorescence probe reflects changes in the base-binding site and does not necessarily tell us about the preorganization in the catalytic site. That is, the most important catalytic preorganization occurs upon binding of the charged part of the incoming nucleotide, and this preorganization is expected to be similar for R and W. The difference occurs in the base binding process which is used, in the case of W, to destroy the preorganization (see Fig. 11). The florescence changes observed with the current probe may reflect mainly the structural changes in the base binding site rather than the relevant part of the induced fit in the chemical site. It seems that only direct structural studies and/or simulation approaches can tell us about the nature of the preorganization effect that follows the binding step. Using fluorescence labeling can be very useful in estimating the time scale of these changes, but even this should be done with great care, with two or more probes, trying to correlate the position of the given probe with the two allosteric regions.
What is the relationship between induced fit and fidelity?
Since our work explored the role of conformational changes in Pol β, it is important to discuss the idea that the fidelity of DNA polymerase is related to the induced-fit proposal (e.g., 66). The fact that the substrate binding induces conformational changes that bring Pol β to its catalytic configuration can be described as an induced fit effect. However, this does not provide information about the nature of the catalytic effect in the preorganized active site, nor does it tell us how the structure of the ES (or in our case the E-DNA-dNTP) complex is related to the activation barrier of the chemical step. Chemical catalysis is defined by the difference between the activation barrier in the ES complex and the barrier for the reference reaction in water. It does not depend on the structure of the enzyme before it binds the substrate. Thus, the induced fit concept does not describe the origin of the ES structure. Enzyme catalysis can be considered on the same level as other parts of the folding to ES state (in general the folding energy is invested in reorganizing the active site67).
The use of the term “induced fit” to describe the origin of the polymerase fidelity is also problematic. There are opposing views on whether or not the induced fit can lead to increased selectivity or fidelity.68,69 The use of kinetic diagrams of the type considered by Post and Ray68 does not provide a unique thermodynamic analysis because they do not stipulate well defined free energy surfaces. Perhaps this is the basis for the current controversies. In our view, it is most useful to describe an induced fit effect in terms of energy diagrams of the type presented in Figure 8. In this way one can define the relationship between the structural changes upon substrate binding and the corresponding energetics, including: (i) the energy change of the enzyme upon moving from r(E) (where r is the protein configuration at the designated state) to r(ES); (this energy is defined as the reorganization energy upon binding70). (ii) the change in the enzyme-substrate interaction upon moving from r(E) to r(ES) and (iii) the change in the activation barrier for the chemical step as the result of the binding induced structural change (this is defined in terms of the change in the reorganization energy of the chemical step and the work term71). Without such estimates it is likely that the discussion will become circular.
Even the definition of the reference state, where we do not have an induced fit (this is considered usually as the “hypothetical” rigid structure68,69) presents a logical problem since it could be any arbitrary structure (closed or open). Thus the most logical definition is to first take the actual structure of the specific system without the substrate and then to examine what is the effect of the binding process, rather than to talk about an ill defined arbitrary rigid structure. At any rate, the induced fit effect in the binding step is described in the lower part of Figure 8. If we identify the motion from the open to the closed conformation as the induced fit effect in the binding step (this is done with the knowledge that the system is in the open state without the substrate) then the induced fit effect should be larger in R than in W, since the binding free energy in the closed configurations is expected to be smaller for W than for R. A difficulty occurs, however, when we explore the induced fit effect on the binding of the TS, which determines the fidelity. In the likely situation that the chemical step is rate-limiting, we expect kpol/KD to determine the overall fidelity of DNA polymerases.16 Here we have to first define the reference structure (the structure of the isolated E), which is changed by the induced fit effect. Taking the open structure as the reference state, we find that the induced fit always increases fidelity since the reactivity in the open structure is similar to the reactivity in water where we have similar barriers for R and W and no selection for fidelity. This result is not meaningful since it does not tell us about the actual nature of the fidelity, that is, what are the factors that increase it. The situation becomes more problematic if we choose the closed structure with R as the reference state (note that we can consider any possible definition). Once the reference structure is taken as r(ES(R)), the induced fit effect will be described as the motion from r(ES(R)) to r(ES (W)), but here there is no way to predict a priori whether this structural change will increase or decrease the energy difference between the TSs of R and W, which in turn would either decrease or increase the fidelity. If the induced fit concept is extended to the structural changes in the TS and to the configuration that stabilizes the TS, then the reorganization energy associated with the move from r(ES(R)) to r(TS(R)) will generally be smaller than that from r(ES(W)) to r(TS(W)). However, it is not clear what the reorganization energy will be upon moving from r(ES(R)) to r(TS(W)), and so it is not clear if the fidelity will increase or decrease because of the induced fit effect.
Since the induced fit upon binding of R leads to an improved catalytic configuration and since some of the binding energy is being invested in the reorganization process, it might seem reasonable to assume that W will induce less reorganization (less induced fit) because its active site is less preorganized. Unfortunately, this argument, which is equivalent to the assumption of a direct relationship between induced fit and fidelity, is unjustified. That is, W and R are different molecules and there is no way to predict a priori which of them will involve larger reorganization upon binding. In other words, there is no way to tell (without calculations) if the binding of W will lead to smaller or larger reorganization than the binding of R since we only know that the binding of R improves the preorganization of the catalytic site. The binding of W may involve small reorganization or a very large reorganization with a very large cost. For example, the binding of W may be used to move the active site to an anticatalytic configuration.
The idea that the enzyme uses the “intrinsic” substrate binding energy to achieve its optimal catalytic effect (e.g., Ref. 72) has also been invoked in analyzing the induced fit effect.66,73 In particular it has been implied that a portion of the binding energy must be consumed by reorganizing the active site and thus will not be available to stabilize the TS.66 Unfortunately this line of thought is problematic. First, the whole assumption that the enzyme uses the binding energy of distant groups lead to destabilization of the ground state of the chemical part (this is the essence of Jencks’ idea72 about the usage of binding energy) has not been confirmed by careful computational and conceptual studies of specific cases.67 One of the simplest ways to realize this point is to see that most mutations that reduce catalysis also reduce binding rather than increase it. Second, the binding energy in the case of induced fit is invested in part in pushing the TS to the preorganized structure and not “consumed” in destabilizing the ground state. In other words, the binding energy that leads to structural rearrangement increases rather than decrease catalysis. Now, as much as the fidelity is concerned we may try to view the base as the distant part of the substrate (the part whose energy should be used for inducing catalysis). Doing so we face the problem that a good binding of the base (a good base pairing) is used to stabilize the TS rather than destabilize the RS. This point can be seen by noting that mutations that increase kpol significantly for R usually decrease KD (lower KD means stronger binding), or leave it unchanged, rather than increase it,28 as would be expected if the reduction of Δg‡cat is because of the ground state destabilization. Interestingly the distant part is quite effective in destroying rather than increasing catalysis, as is obviously the case with W.
Landscape catalysis and dynamical effects
The present work considered in a preliminary way the effect of the complexity of the landscape in enzyme catalysis. As illustrated in Figure 3, we are faced with a complex situation in assessing the probability of reaching the TS region in the multidimensional surface of the enzyme-substrate complex. However, in contrast to some recent proposals,30 we do not see any fundamental problem with this complexity, nor do we find a catalytic advantage from this complexity. The possibility that the TS region has more configurations than the RS is a simple entropic effect that does not appear to be supported by the fact that the observed values of the activation entropies in enzymes are not large.74 The possible dynamical effects associated with transitions between different conformational subspaces during the fluctuations that lead to the TS (see Fig. 1) are not expected to be large, although simulation studies of this issue are clearly needed. Of course, it is clear that different conformations can be associated with different activation barriers, as indicated by recent single molecule studies of enzymes.29 However, this point has been taken into account (at least in part) already in our approach of averaging over different initial configurations (e.g., Refs. 71, 75 and 76). That is, in our simulations we frequently run series of FEP/US calculations starting with different initial conditions and take the average of the calculated activation barriers. This approach accomplishes more or less what is done in the so called replica exchange studies (see discussion in Ref. 71) and provides an estimate of the effective activation barriers.
We have assumed that kpol is the rate constant for the chemical step, which is consistent with available kinetic evidence. These observed rate constants were converted to activation free energies to compare to the calculated values. Additional experiments may be required to resolve any shortcomings of this assumption, and a more sophisticated model may be needed for a deeper understanding of the kinetics during Pol β catalytic cycling. It may be also reasonable to question whether the measured kpol for the incorporation of correct and incorrect dNTP represents the same microscopic reaction rate constant. Recent experimental38 and theoretical results77 indicated that this is indeed the case, and that the chemistry is generally the rate-determining step at least for Pol β.
Recent ideas that the fidelity of DNA polymerases may involve “gate keeping” dynamical effects78 and related earlier ideas79 are of interest and should be examined further. Time-resolved fluorescence46 and NMR80,81 studies have demonstrated that the motions (which have often been referred to as dynamics) of α-helix N are reduced when Watson-Crick hydrogen bonding occurs (i.e., correct nucleotide binding), but not when hydrogen bonding is absent. In contrast, protein side-chain motions are increased in the vicinity of the active site aspartates when the closed complex is formed.80,81 However, these motional effects are not likely to represent true dynamical effects but merely equilibrium thermal fluctuations that follow the Boltzmann populations in different landscapes. In this case, we simply have well defined entropic effects; an analysis and interpretation of these types of dynamical effects is discussed in Refs. 34 and 65. We have not found convincing theoretical or experimental evidence that dynamical effects play a significant role in catalysis.34
If the dynamical effects are considered as the motions between the open to closed conformations, then it is difficult to see how it would be advantageous to use these as a mechanism to control replication fidelity. Fidelity is determined by the ratio between kpol/KD of W and R. If the rate limiting step is the conformational transition between the open and closed conformations and the barrier for these states is much larger for W than for R, then there could, in principal, be conformational control of fidelity. However, this mechanism is in conflict with the chemical step being rate limiting (see Refs. 15, 16, and 38). If the chemical step is rate limiting, then it seems that the only way for conformational changes to control fidelity is that the TS for both W and R must occur in a different conformation than the RS, and the barrier along the conformational axis in Figure 8 is higher than the chemical barrier, and that this barrier will be higher in W than in R. Although we have not determined the conformational barriers (in part because it is not clear what, if any, conformational transition occurs in Pol β.), our calculations are consistent with R having both the TS and RS in the same closed conformational region. As argued earlier, the situation with W is such that a barrier for the transition to the TS will only push the fidelity above its observed value.
Finally, it may be useful to comment here on the implication of Ref. 18 that pre-chemistry steps can have a major effect on the fidelity. Apparently, as long as the barriers for the pre-chemistry steps (e.g., the open to closed conformational change) are significantly lower than the chemical barrier they cannot change the kinetics and the corresponding fidelity (except in some particular substrate saturation conditions). That is, the reaction rate is determined by the difference between the energy of the TS and the E + S state and the TS for the chemical step. Having many barriers between the open and closed configurations in the binding step of Figure 8 (or Fig. 1) is not going to change the kinetics as long as these barriers are smaller than the TS barrier. An additional insight is obtained for example from inspection of Figure 1 of Ref. 27. This figure describes the calculated barriers for the pre-chemistry steps. Since the barriers for W are smaller than that for R it is very hard to see how these barriers could account for the observed fidelity. The obvious answer is that the real difference is in the chemical step.
CONCLUDING REMARKS
We have explored the idea that the incorporation of incorrect nucleotides (dATP, dGTP, or dTTP opposite template dG) occurs in different protein conformations than incorporation of correct dCTP opposite template dG. It was found that the TS is likely to involve different conformational region of the protein. The structural changes that were consistent with the measured fidelity appear to be much larger than the relatively small rearrangements that follow common changes in the shape of the reacting system during the movement from the ground state to the TS in enzymatic reactions.
Since the conformational changes reduce the TS energy of W incorporation drastically they decrease fidelity rather than increase it. Overall, a better agreement with experimental data is attained when R is incorporated through a TS in a closed conformation and W is incorporated through a TS in one or perhaps several partially open conformations.
The semi-quantitative surfaces obtained in this work allowed us to discuss the induced fit effect in a consistent way. Previous discussions of this issue have been incomplete because they were not related to well defined structure-energy relationships. Although our discussion of the induced fit effect seems complex, we view it as an important step in illustrating that there is no way to predict the trend in fidelity by using the typical induced fit concept since it is ambiguous as to whether or not the fidelity might decrease or increase. In contrast, the calculations described in Figure 8 probe the actual effect of the structural change. These calculations can predict the consequence of the induced fit. Thus accepting that the induced fit concept does not explain fidelity, we can still investigate the effect of substrate induced structural changes on fidelity in specific cases, using computer simulation or experimental approaches.
We also considered the relationship between the landscape and dynamic effects and concluded that convincing evidence for these dynamical effects influencing the fidelity of DNA polymerases is lacking. Similarly we found that the barriers along the path from the open to closed structures in the pre-chemistry step are not likely to contribute to the overall fidelity, unless the corresponding barriers are higher than that for the chemical step.
The present study reflects a hypothetical search along the path between the open and closed N-subdomain conformations. We realize that this conformational space might not include the actual conformational changes that may occur in the reaction of W. However, it is possible that some of the conformers generated here have features in common with the actual structural changes, at least in terms of some key electrostatic interactions. Regardless of the exact nature of the structural changes, it appears from Table II and Figure 8 that the lowest activation barrier for correct base pairs occurs in the closed structure, whereas for the incorrect pairs there are lower barriers in other protein conformations.
In conclusion, our study indicates that the TS for W is likely to be at different conformational states than that of R. The relevant structural change may also involve a shift of the DNA rather than a change in the protein structure. However, the precise nature of the polymerase structural changes cannot be determined without additional X-ray data for ternary complexes containing base mispairs. The missing link would probably be structural data for mispaired TS analogues.
Acknowledgments
We thank Drs. M. Roca, P. Sharma, and P. Oelschlaeger for useful help.
Grant sponsor: National Institutes of Health (NIH); Grant numbers: 5U19CA105010, RO1GM21422; Grant sponsor: National Institute of Environmental Health Sciences.
Abbreviations
- EVB
empirical valence bond
- MD
molecular dynamics
- Pol β
DNA polymerase β
- RMSD
root mean square deviation
- TMD
targeted molecular dynamics
References
- 1.Kornberg A, Baker TA. DNA replication. New York: W.H. Freeman; 1992. [Google Scholar]
- 2.Wolfenden R, Snider MJ. The depth of chemical time and the power of enzymes as catalysts. Acc Chem Res. 2001;34:938–945. doi: 10.1021/ar000058i. [DOI] [PubMed] [Google Scholar]
- 3.Echols H, Goodman MF. Fidelity mechanisms in DNA replication. Annu Rev Biochem. 1991;60:477–511. doi: 10.1146/annurev.bi.60.070191.002401. [DOI] [PubMed] [Google Scholar]
- 4.Johnson KA. Conformational coupling in DNA polymerase fidelity. Annu Rev Biochem. 1993;62:685–713. doi: 10.1146/annurev.bi.62.070193.003345. [DOI] [PubMed] [Google Scholar]
- 5.Joyce CM, Benkovic SJ. DNA polymerase fidelity: kinetics, structure, and checkpoints. Biochemistry. 2004;43:14317–14324. doi: 10.1021/bi048422z. [DOI] [PubMed] [Google Scholar]
- 6.Beard WA, Wilson SH. Structural insights into the origins of DNA polymerase fidelity. Structure. 2003;11:489–496. doi: 10.1016/s0969-2126(03)00051-0. [DOI] [PubMed] [Google Scholar]
- 7.Beard WA, Shock DD, Vande Berg BJ, Wilson SH. Efficiency of correct nucleotide insertion governs DNA polymerase fidelity. J Biol Chem. 2002;277:47393–47398. doi: 10.1074/jbc.M210036200. [DOI] [PubMed] [Google Scholar]
- 8.Goodman MF, Creighton S, Bloom LB, Petruska J. Biochemical basis of dna replication fidelity. Crit Rev Biochem Mol Biol. 1993;28:83–126. doi: 10.3109/10409239309086792. [DOI] [PubMed] [Google Scholar]
- 9.Kunkel TA, Bebenek K. DNA replication fidelity. Annu Rev Biochem. 2000;69:497–529. doi: 10.1146/annurev.biochem.69.1.497. [DOI] [PubMed] [Google Scholar]
- 10.Goodman MF. Error-prone repair DNA polymerases in prokaryotes and eukaryotes. Annu Rev Biochem. 2002;71:17–50. doi: 10.1146/annurev.biochem.71.083101.124707. [DOI] [PubMed] [Google Scholar]
- 11.Showalter AK, Lamarche BJ, Bakhtina M, Su MI, Tang KH, Tsai MD. Mechanistic comparison of high-fidelity and error-prone DNA polymerases and ligases involved in DNA repair. Chem Rev. 2006;106:340–360. doi: 10.1021/cr040487k. [DOI] [PubMed] [Google Scholar]
- 12.Florian J, Goodman MF, Warshel A. Theoretical investigation of the binding free energies and key substrate-recognition components of the replication fidelity of human DNA polymerase b. J Phys Chem B. 2002;106:5739–5753. [Google Scholar]
- 13.Florian J, Goodman MF, Warshel A. Computer simulation of the chemical catalysis of DNA polymerases: discriminating between alternative nucleotide insertion mechanisms for T7 DNA polymerase. J Am Chem Soc. 2003;125:8163–8177. doi: 10.1021/ja028997o. [DOI] [PubMed] [Google Scholar]
- 14.Florian J, Warshel A, Goodman MF. Molecular dynamics free-energy simulations of the binding contribution to the fidelity of T7 DNA polymerase. J Phys Chem B. 2002;106:5754–5760. [Google Scholar]
- 15.Florian J, Goodman MF, Warshel A. Computer simulation studies of the fidelity of DNA polymerases. Biopolymers. 2003;68:286–299. doi: 10.1002/bip.10244. [DOI] [PubMed] [Google Scholar]
- 16.Florian J, Goodman MF, Warshel A. Computer simulations of protein functions: searching for the molecular origin of the replication fidelity of DNA polymerases. Proc Natl Acad Sci USA. 2005;102:6819–6824. doi: 10.1073/pnas.0408173102. [DOI] [PMC free article] [PubMed] [Google Scholar]
- 17.Lin P, Pedersen LC, Batra VK, Beard WA, Samuel SH, Pedersen LG. Energy analysis of chemistry for correct insertion by DNA polymerase beta. Proc Natl Acad Sci USA. 2006;103:13294–23299. doi: 10.1073/pnas.0606006103. [DOI] [PMC free article] [PubMed] [Google Scholar]
- 18.Radhakrishnan R, Schlick T. Orchestration of cooperative events in DNA synthesis and repair mechanism unraveled by transition path sampling of DNA polymerase beta’s closing. Proc Natl Acad Sci USA. 2004;101:5970–5975. doi: 10.1073/pnas.0308585101. [DOI] [PMC free article] [PubMed] [Google Scholar]
- 19.Yang LJ, Beard WA, Wilson SH, Broyde S, Schlick T. Highly organized but pliant active site of DNA polymerase beta: compensatory mechanisms in mutant enzymes revealed by dynamics simulations and energy analyses. Biophys J. 2004;86:3392–3408. doi: 10.1529/biophysj.103.036012. [DOI] [PMC free article] [PubMed] [Google Scholar]
- 20.Martinek V, Bren U, Goodman MF, Warshel A, Florian J. DNA polymerase beta catalytic efficiency mirrors the Asn279-dCTP H-bonding strength. FEBS Lett. 2007;581:775–780. doi: 10.1016/j.febslet.2007.01.041. [DOI] [PMC free article] [PubMed] [Google Scholar]
- 21.Bren U, Martinek V, Florian J. Free energy simulations of uncatalyzed DNA replication fidelity: structure and stability of T center dot G and dTTP center dot G terminal DNA mismatches flanked by a single dangling nucleotide. J Phys Chem B. 2006;110:10557–10566. doi: 10.1021/jp060292b. [DOI] [PubMed] [Google Scholar]
- 22.Feig M, Zacharias M, Pettitt BM. Conformations of an adenine bulge in a DNA octamer and its influence on DNA structure from molecular dynamics simulations. Biophys J. 2001;81:352–370. doi: 10.1016/S0006-3495(01)75705-0. [DOI] [PMC free article] [PubMed] [Google Scholar]
- 23.Orozco M, Perez A, Noy A, Luque FJ. Theoretical methods for the simulation of nucleic acids. Chem Soc Rev. 2003;32:350–364. doi: 10.1039/b207226m. [DOI] [PubMed] [Google Scholar]
- 24.Seibert E, Ross JB, Osman R. Contribution of opening and bending dynamics to specific recognition of DNA damage. J Mol Biol. 2003;330:687–703. doi: 10.1016/s0022-2836(03)00598-9. [DOI] [PubMed] [Google Scholar]
- 25.Oostenbrink C, van Gunsteren WF. Efficient calculation of many stacking and pairing free energies in DNA from a few molecular dynamics simulations. Chemistry. 2005;11:4340–4348. doi: 10.1002/chem.200401120. [DOI] [PubMed] [Google Scholar]
- 26.Arora K, Beard WA, Wilson SH, Schlick T. Mismatch-induced conformational distortions in polymerase support an induced-fit mechanism for fidelity. Biochemistry. 2005;44:13328–13341. doi: 10.1021/bi0507682. [DOI] [PubMed] [Google Scholar]
- 27.Radhakrishnan R, Schlick T. Fidelity discrimination in DNA polymerase beta: differing closing profiles for a mismatched (G: A) versus matched (G: C) base pair. J Am Chem Soc. 2005;127:13245–13252. doi: 10.1021/ja052623o. [DOI] [PMC free article] [PubMed] [Google Scholar]
- 28.Xiang Y, Oelschlaeger P, Florian J, Goodman MF, Warshel A. Simulating the effect of DNA polymerase mutations on transition-state energetics and fidelity: evaluating amino acid group contribution and allosteric coupling for ionized residues in human pol beta. Biochemistry. 2006;45:7036–7048. doi: 10.1021/bi060147o. [DOI] [PubMed] [Google Scholar]
- 29.Min W, English BP, Luo GB, Cherayil BJ, Kou SC, Xie XS. Fluctuating enzymes: lessons from single-molecule studies. Acc Chem Res. 2005;38:923–931. doi: 10.1021/ar040133f. [DOI] [PubMed] [Google Scholar]
- 30.Kumar S, Ma BY, Tsai CJ, Sinha N, Nussinov R. Folding and binding cascades: dynamic landscapes and population shifts. Protein Sci. 2000;9:10–19. doi: 10.1110/ps.9.1.10. [DOI] [PMC free article] [PubMed] [Google Scholar]
- 31.Leulliot N, Varani G. Current topics in RNA-protein recognition: control of specificity and biological function through induced fit and conformational capture. Biochemistry. 2001;40:7947–7956. doi: 10.1021/bi010680y. [DOI] [PubMed] [Google Scholar]
- 32.Hammes-Schiffer S, Benkovic SJ. Relating protein motion to catalysis. Annu Rev Biochem. 2006;75:519–541. doi: 10.1146/annurev.biochem.75.103004.142800. [DOI] [PubMed] [Google Scholar]
- 33.Boehr DD, McElheny D, Dyson HJ, Wright PE. The dynamic energy landscape of dihydrofolate reductase catalysis. Science. 2006;313:1638–1642. doi: 10.1126/science.1130258. [DOI] [PubMed] [Google Scholar]
- 34.Olsson MHM, Parson WW, Warshel A. Dynamical contributions to enzyme catalysis: critical tests of a popular hypothesis. Chem Rev. 2006;106:1737–1756. doi: 10.1021/cr040427e. [DOI] [PubMed] [Google Scholar]
- 35.Koshland DE. The key-lock theory and the induced fit theory. Angew Chem Int Ed Engl. 1995;33:2375–2378. [Google Scholar]
- 36.Yang LJ, Beard WA, Wilson SH, Broyde S, Schlick T. Polymerase beta simulations suggest that Arg258 rotation is a slow step rather than large subdomain motions per se. J Mol Biol. 2002;317:651–671. doi: 10.1006/jmbi.2002.5450. [DOI] [PubMed] [Google Scholar]
- 37.Van de Berg BJ, Beard WA, Wilson SH. DNA structure and aspartate 276 influence nucleotide binding to human DNA polymerase beta—implication for the identity of the rate-limiting conformational change. J Biol Chem. 2001;276:3408–3416. doi: 10.1074/jbc.M002884200. [DOI] [PubMed] [Google Scholar]
- 38.Bakhtina M, Lee S, Wang Y, Dunlap C, Lamarche B, Tsai MD. Use of viscogens, dNTP alpha S, and rhodium(III) as probes in stopped-flow, experiments to obtain new evidence for the mechanism of catalysis by DNA polymerase beta. Biochemistry. 2005;44:5177–5187. doi: 10.1021/bi047664w. [DOI] [PubMed] [Google Scholar]
- 39.Arndt JW, Gong WM, Zhong XJ, Showalter AK, Liu J, Dunlap CA, Lin Z, Paxson C, Tsai MD, Chan MK. Insight into the catalytic mechanism of DNA polymerase beta: structures of intermediate complexes. Biochemistry. 2001;40:5368–5375. doi: 10.1021/bi002176j. [DOI] [PubMed] [Google Scholar]
- 40.Rothwell PJ, Mitaksov V, Waksman G. Motions of the fingers subdomain of klentaq1 are fast and not rate limiting: implications for the molecular basis of fidelity in DNA polymerases. Mol Cell. 2005;19:345–355. doi: 10.1016/j.molcel.2005.06.032. [DOI] [PubMed] [Google Scholar]
- 41.Hwang J-K, King G, Creighton S, Warshel A. Simulation of Free Energy Relationships and dynamics of SN2 reactions in aqueous solution. J Am Chem Soc. 1988;110:5297–5311. [Google Scholar]
- 42.Warshel A, Chu ZT, Hwang J-K. The dynamics of the primary event in rhodopsins revisited. Chem Phys. 1991;158:303–314. [Google Scholar]
- 43.Warshel A. Computer modeling of chemical reactions in enzymes and solutions. New York: Wiley; 1997. [Google Scholar]
- 44.Sawaya MR, Prasad R, Wilson SH, Kraut J, Pelletier H. Crystal structures of human DNA polymerase beta complexed with gapped and nicked DNA: evidence for an induced fit mechanism. Biochemistry. 1997;36:11205–11215. doi: 10.1021/bi9703812. [DOI] [PubMed] [Google Scholar]
- 45.Humphrey W, Dalke A, Schulten K. VMD: visual molecular dynamics. J Mol Graph. 1996;14:33–38. doi: 10.1016/0263-7855(96)00018-5. [DOI] [PubMed] [Google Scholar]
- 46.Kim SJ, Beard WA, Harvey J, Shock DD, Knutson JR, Wilson SH. Rapid segmental and subdomain motions of DNA polymerase beta. J Biol Chem. 2003;278:5072–5081. doi: 10.1074/jbc.M208472200. [DOI] [PubMed] [Google Scholar]
- 47.Beard WA, Wilson SH. Structural insights into DNA polymerase beta fidelity: hold tight if you want it right. Chem Biol. 1998;5:R7–R13. doi: 10.1016/s1074-5521(98)90081-3. [DOI] [PubMed] [Google Scholar]
- 48.King G, Warshel A. A surface constrained all-atom solvent model for effective simulations of polar solutions. J Chem Phys. 1989;91:3647–3661. [Google Scholar]
- 49.Lee FS, Warshel A. A Local reaction field method for fast evaluation of long-range electrostatic interactions in molecular simulations. J Chem Phys. 1992;97:3100–3107. [Google Scholar]
- 50.Lee FS, Chu ZT, Warshel A. Microscopic and semimicroscopic calculations of electrostatic energies in proteins by the POLARIS and ENZYMIX programs. J Comput Chem. 1993;14:161–185. [Google Scholar]
- 51.Cornell WD, Cieplak P, Bayly CI, Gould IR, Merz KM, Jr, Ferguson DM, Spellmeyer DC, Fox T, Caldwell JW, Kollman PA. A second generation force field for the simulation of proteins, nucleic-acids, and organic-molecules. J Am Chem Soc. 1995;117:5179–5197. [Google Scholar]
- 52.Schlitter J, Engels M, Kruger P, Jacoby E, Wollmer A. Targeted molecular-dynamics simulation of conformational change—Application to the T-R transition in insulin. Mol Simul. 1993;10:291–308. [Google Scholar]
- 53.Warshel A. Calculations of enzymic reactions: calculations of pKa, proton transfer reactions, and general acid catalysis reactions in enzymes. Biochemistry. 1981;20:3167–3177. doi: 10.1021/bi00514a028. [DOI] [PubMed] [Google Scholar]
- 54.Izatt RM, Rytting JH, Hansen LD, Christensen JJ. Thermodynamics Of proton dissociation in dilute aqueous solution. V. An entropy titration study of adenosine pentoses hexoses and related compounds. J Am Chem Soc. 1966;88:2641–2645. doi: 10.1021/ja00964a003. [DOI] [PubMed] [Google Scholar]
- 55.Pettersen EF, Goddard TD, Huang CC, Couch GS, Greenblatt DM, Meng EC, Ferrin TE. UCSF chimera—a visualization system for exploratory research and analysis. J Comput Chem. 2004;25:1605–1612. doi: 10.1002/jcc.20084. [DOI] [PubMed] [Google Scholar]
- 56.Werneburg BG, Ahn J, Zhong XJ, Hondal RJ, Kraynov VS, Tsai MD. DNA polymerase beta: pre-steady-state kinetic analysis and roles of arginine-283 in catalysis and fidelity. Biochemistry. 1996;35:7041–7050. doi: 10.1021/bi9527202. [DOI] [PubMed] [Google Scholar]
- 57.Kraynov VS, Showalter AK, Liu J, Zhong XJ, Tsai MD. DNA polymerase beta: contributions of template-positioning and dNTP tri-phosphate-binding residues to catalysis and fidelity. Biochemistry. 2000;39:16008–16015. doi: 10.1021/bi0008480. [DOI] [PubMed] [Google Scholar]
- 58.Beard WA, Osheroff WP, Prasad R, Sawaya MR, Jaju M, Wood TG, Kraut J, Kunkel TA, Wilson SH. Enzyme-DNA interactions required for efficient nucleotide incorporation and discrimination in human DNA polymerase beta. J Biol Chem. 1996;271:12141–12144. doi: 10.1074/jbc.271.21.12141. [DOI] [PubMed] [Google Scholar]
- 59.Osheroff WP, Beard WA, Wilson SH, Kunkel TK. Base substitution specificity of DNA polymerase beta depends on interactions in the DNA minor groove. J Biol Chem. 1999;274:20749–20752. doi: 10.1074/jbc.274.30.20749. [DOI] [PubMed] [Google Scholar]
- 60.Beard WA, Shock DD, Yang XP, DeLauder SF, Wilson SH. Loss of DNA polymerase beta stacking interactions with templating purines, but not pyrimidines, alters catalytic efficiency and fidelity. J Biol Chem. 2002;277:8235–8242. doi: 10.1074/jbc.M107286200. [DOI] [PubMed] [Google Scholar]
- 61.Shea JE, Brooks CL. From folding theories to folding proteins: A review and assessment of simulation studies of protein folding and unfolding. Annu Rev Phys Chem. 2001;52:499–535. doi: 10.1146/annurev.physchem.52.1.499. [DOI] [PubMed] [Google Scholar]
- 62.Plaxco KW, Simons KT, Baker D. Contact order, transition state placement and the refolding rates of single domain proteins. J Mol Biol. 1998;277:985–994. doi: 10.1006/jmbi.1998.1645. [DOI] [PubMed] [Google Scholar]
- 63.Fan ZZ, Hwang JK, Warshel A. Using simplified protein representation as a reference potential for all-atom calculations of folding free energies. Theor Chem Acc. 1999;103:77–80. [Google Scholar]
- 64.Ahn JW, Kraynov VS, Zhong XJ, Werneburg BG, Tsai MD. DNA polymerase β: effects of gapped DNA substrates of dNTP specificity, fidelity, processivity and conformational changes. Biochem J. 1998;331:79–87. doi: 10.1042/bj3310079. [DOI] [PMC free article] [PubMed] [Google Scholar]
- 65.Warshel A, Sharma PK, Kato M, Parson WW. Modeling electrostatic effects in proteins. Biochim Biophys Acta. 2006;1764:1647–1676. doi: 10.1016/j.bbapap.2006.08.007. [DOI] [PubMed] [Google Scholar]
- 66.Tsai YC, Johnson KA. A New paradigm for DNA polymerases specificity. Biochemistry. 2006;45:9675–9687. doi: 10.1021/bi060993z. [DOI] [PMC free article] [PubMed] [Google Scholar]
- 67.Warshel A, Sharma PK, kato M, Xiang Y, Liu H, Olsson MH. Electrostatic basis for enzyme catalysis. Chem Rev. 2006;106:3210–3235. doi: 10.1021/cr0503106. [DOI] [PubMed] [Google Scholar]
- 68.Post CB, Ray WJ. Reexamination of induced fit as a determinant of substrate specificity in enzymatic reactions. Biochemistry. 1995;34:15881–15885. doi: 10.1021/bi00049a001. [DOI] [PubMed] [Google Scholar]
- 69.Fersht AR. Enzyme structure and mechanism. New York: W.H. Freeman; 1985. [Google Scholar]
- 70.Muegge I, Schweins T, Warshel A. Electrostatic contributions to protein-protein binding affinities: application to Rap/Raf interaction. Proteins. 1998;30:407–423. doi: 10.1002/(sici)1097-0134(19980301)30:4<407::aid-prot8>3.0.co;2-f. [DOI] [PubMed] [Google Scholar]
- 71.Liu HB, Warshel A. The catalytic effect of dihydrofolate reductase and its mutants is determined by reorganization energies. Biochemistry. 2007;46:6011–6025. doi: 10.1021/bi700201w. [DOI] [PubMed] [Google Scholar]
- 72.Jencks WP. Catalysis in chemistry and enzymology. New York: Dover; 1986. [Google Scholar]
- 73.Herschlag D. The Role Of induced fit and conformational-changes of enzymes in specificity and catalysis. Bioorg Chem. 1988;16:62–96. [Google Scholar]
- 74.Warshel A, Parson WW. Dynamics of biochemical and biophysical reactions: insight from computer simluations. Q Rev Biophys. 2001;34:563–670. doi: 10.1017/s0033583501003730. [DOI] [PubMed] [Google Scholar]
- 75.Glennon TM, Villa J, Warshel A. How does GAP catalyze the GTPase reaction of Ras? A computer simulation study. Biochemistry. 2000;39:9641–9651. doi: 10.1021/bi000640e. [DOI] [PubMed] [Google Scholar]
- 76.Rosta E, Klahn M, Warshel A. Towards accurate ab initio QM/MM calculations of free-energy profiles of enzymatic reactions. J Phys Chem B. 2006;110:2934–2941. doi: 10.1021/jp057109j. [DOI] [PubMed] [Google Scholar]
- 77.Sucato CA, Upton TG, Kashemirov BA, Batra VK, Martinek V, Xiang Y, Beard WA, Pedersen LC, Wilson SH, McKenna CE, Florian J, Warshel A, Goodman MF. Modifying the beta-gamma leaving-group bridging oxygen alters nucleotide incorporation efficiency, fidelity and catalytic mechanism of DNA polymerase beta. Biochemistry. 2007;46:461–471. doi: 10.1021/bi061517b. [DOI] [PubMed] [Google Scholar]
- 78.Radhakrishnan R, Arora K, Wang YL, Beard WA, Wilson SH, Schlick T. Regulation of DNA repair fidelity by molecular checkpoints: “gates” in DNA polymerase beta’s substrate selected. Biochemistry. 2006;45:15142–15156. doi: 10.1021/bi061353z. [DOI] [PMC free article] [PubMed] [Google Scholar]
- 79.Patel SS, Wong I, Johnson KA. Pre-steady-state kinetic-analysis of processive DNA-replication including complete characterization of an exonuclease-deficient mutant. Biochemistry. 1991;30:511–525. doi: 10.1021/bi00216a029. [DOI] [PubMed] [Google Scholar]
- 80.Kirby TW, DeRose EF, Beard WA, Wilson SH, London RE. A thymine isostere in the templating position disrupts assembly of the closed DNA polymerase beta ternary complex. Biochemistry. 2005;44:15230–15237. doi: 10.1021/bi0511742. [DOI] [PubMed] [Google Scholar]
- 81.Bose-Basu B, DeRose EF, Kirby TW, Mueller GA, Beard WA, Wilson SH, London RE. Dynamic characterization of a DNA repair enzyme: NMR studies of [methyl-C-13]methionine-labeled DNA polymerase beta. Biochemistry. 2004;43:8911–8922. doi: 10.1021/bi049641n. [DOI] [PubMed] [Google Scholar]