

SUMMARY
The yeast actin cytoskeleton is polarized during most of the cell cycle. Certain environmental factors and mutations are associated with depolarization of the actin cytoskeleton. Is depolarization of the actin cytoskeleton a specific response, or is it a nonspecific reaction to harsh conditions or poor metabolism? If depolarization is a nonspecific response, then any mutation that slows growth should induce depolarization. In addition, the number of genes with the depolarization phenotype should constitute a relatively large part of the genome. To address this question, we determined the effect of slow growth on the actin cytoskeleton, and we determined the frequency of mutations that affect the actin cytoskeleton. Eight mutants with slow growth showed no defect in actin polarization, indicating that slow growth alone is not sufficient to cause depolarization. Among 273 viable haploids disrupted for ORFs of chromosome I and VIII and 950 viable haploids with random genome disruptions, none had depolarization of the cytoskeleton. We conclude that depolarization of the actin cytoskeleton is a specific phenotype.
Keywords: Yeast, Actin, Actin-binding protein, Actin cytoskeleton depolarization, ORF disruption, GFP
INTRODUCTION
In a number of genetic systems, mutations have been described that affect the structure or function of the actin cytoskeleton. An important question is how specific these effects are. The gene products may have a direct role in the actin cytoskeleton. On the other hand, the effects on the actin cytoskeleton may be indirect, caused by poor metabolism. Yeast provide an important model system in which to address this question because of the simplicity of their actin cytoskeleton and because of the molecular and genetic approaches available.
A number of mutations and environmental factors are associated with a defect in polarization of the yeast actin cytoskeleton. Normally the actin cytoskeleton, which consists of actin cables and patches, is polarized through most of the cell cycle. Actin patches are clustered in regions of active secretion, and actin cables are oriented toward patch clusters (Kilmartin and Adams, 1984). When the actin cytoskeleton is depolarized, patches are distributed randomly about the cortex, and cables form an isotropic meshwork in the cytoplasm. Many studies have observed this phenotype in a mutant and offered this observation in support of the conclusion that the gene product is involved in the actin cytoskeleton (reviewed by Botstein et al., 1997). However, no one has ever systematically considered whether actin cytoskeleton depolarization is indeed a specific phenotype and therefore how reliable this phenotype is for identification of genes involved in the actin cytoskeleton.
Several considerations suggest that actin cytoskeleton depolarization may not be specific. First, mutations in a large number of different genes cause similar phenotypes, even though the genes encode actin-binding proteins with very different biochemical functions. These phenotypes only differ in terms of severity; they do not include specific features as might be expected based on the diversity of the biochemical functions of the gene products. Examples include actin itself (Novick and Botstein, 1985); capping protein, which binds to barbed ends of actin filaments, preventing polymerization and depolymerization (Amatruda et al., 1990); tropomyosin, which binds to the side of one actin filament, regulating myosin binding and preventing depolymerization (Drees et al., 1995; Liu and Bretscher, 1989); fimbrin, which crosslinks two actin filaments, causing bundles of actin filaments to form (Adams et al., 1989), and Cdc42p, a small G-protein that may regulate actin assembly by as yet unknown mechanisms (Johnson and Pringle, 1990).
Second, a number of different stressful environmental conditions also cause depolarization of the actin cytoskeleton. Those conditions include sudden changes in temperature, osmolarity, and glucose concentration of the medium (Chowdhury et al., 1992; Lillie and Brown, 1994; Novick et al., 1989). Again, it is unclear whether the depolarization phenotype indicates that the actin cytoskeleton has a role in adapting to these stresses or is simply a non-specific response to stress in general.
Third, mutations in certain genes cause actin cytoskeleton depolarization but those genes have no obvious role in the actin cytoskeleton. Examples include MNN10/BED1/SLC2 (galactosyltransferase) (Dean and Poster, 1996; Karpova et al., 1993; Mondesert and Reed, 1996), AIP2 (D-lactate dehydrogenase; Amberg et al., 1995) and SAC1 (endoplasmic reticulum ATP transporter; Mayinger et al., 1995). More of these ambiguous cases are expected to emerge as increasing numbers of new mutants are studied in the future, owing to the progress of the yeast genome project. Indeed, the identification of new regulators and components of the actin cytoskeleton, especially ones not predicted from biochemical and other approaches, is a strength of research in yeast. Knowing whether the actin depolarization phenotype indicates that a gene has a role in the actin cytoskeleton is essential to interpret these results.
To address this question, we decided to determine whether actin depolarization is a specific phenotype in a rigorous and systematic manner. First, we studied mutants with poor metabolism and slow growth. We found that poor metabolism alone is not sufficient to cause depolarization of the actin cytoskeleton. Second, we determined the frequency of the actin depolarization phenotype in collections of random mutations. We found that the phenotype was extremely rare. We conclude that the actin depolarization phenotype is highly specific.
MATERIALS AND METHODS
Strains, media, and growth conditions
The strains used are listed in Table 1 or described below.
Table 1.
Yeast strains used in this study
| Strain | Relevant genotype | Source |
|---|---|---|
| AAY1046 | MATαsac6::LEU2 | (Adams et al., 1993) |
| AAY1048 | MATa SAC6 | (Adams et al., 1993) |
| BY4739 | MATα leu2 lys2 ura3 | H. Bussey (McGill University, Montreal) |
| JC482 | MATα CAP2 | K. Tatchell (Louisiana State Univ., Shreveport) |
| KT903 | MATa cap2-Δ1::URA3 | K. Tatchell (Louisiana State Univ., Shreveport) |
| SWY1191 | MATα gle1-4 | S. Wente (Washington University, St Louis) |
| W303-1B | MATα GLE1 | R. Rothstein (Columbia University, New York) |
| YHR023w | MATa myo1-Δ236::GFP | This study, from the collection of the chromosome VIII ORF deletions |
| YJC103 | MATα TPM1 | Haploid segregant of YJC140 (Adams et al., 1993) |
| YJC108 | MATa cap2::HIS3 leu2 trp1 ade2 his3 | J. Cooper (Sizonenko et al., 1996) |
| YJC161 | MATαtpm1-Δ1::URA3 | Haploid segregant of YJC140 (Adams et al., 1993) |
| YJC1261 | MATa GFP-CAP2 | This study |
| YJC1435 | MATαCAP1-GFP sac6::LEU2 | This study |
| YM4392 | MATα FUR1 | M. Johnston (Washington University, St Louis) |
| YM4393 | MATα fur1 | M. Johnston (Washington University, St Louis) |
| YM4585 | MATa MYO1 | Haploid segregant of YM4587 |
| YM4587 | MATa/MATα his3-Δ200/his3-Δ200 lys2-801/lys2-801 leu2/leu2 trp1/trp1 tyr1/tyr1 | M. Johnston (Washington University, St Louis) |
A collection of viable haploids with disruptions of open reading frames (ORFs) on chromosome VIII was constructed. In the diploid strain YM4587 one copy of each ORF was substituted with a replacement cassette containing the green fluorescent protein (GFP) gene and the HIS3 gene as described (Niedenthal et al., 1996). The replacement cassettes were prepared by polymerase chain reaction (PCR), using plasmid pMB2983 (Niedenthal et al., 1996) as a template. The forward chimeric primer contained 45 bp of sequence upstream of each ORF followed by 19 bp of 5′-coding sequence of GFP. The reverse chimeric primer contained 45 bp sequence downstream of each ORF followed by 19 bp of 3′-coding sequence of HIS3. Transformants were tested by PCR for correct integration and then sporulated to obtain haploid segregants.
Haploid mutants carrying disruptions of the following 199 open reading frames on chromosome VIII were tested: YHL049C, YHL048W, YHL047C, YHL046C, YHL045W, YHL044W, YHL043W, YHL042W, YHL041W, YHL040C, YHL039W, YHL037C, YHL036W, YHL035C, YHL034C, YHL033C, YHL032C, YHL031C, YHL030W, YHL029C, YHL028W, YHL027W, YHL026C, YHL024W, YHL023C, YHL022C, YHL021C, YHL020C, YHL019C, YHL018W, YHL017W, YHL016C, YHL014C, YHL013C, YHL012W, YHL011C, YHL010C, YHL009C, YHL007C, YHL006C, YHL005C, YHL004W, YHL003C, YHL002W, YHL001W, YHR001W, YHR002W, YHR003C, YHR004C, YHR006W, YHR008C, YHR009C, YHR010W, YHR012W, YHR014W, YHR016C, YHR017W, YHR018C, YHR022C, YHR023W, YHR028C, YHR029C, YHR030C, YHR031C, YHR032W, YHR033W, YHR034C, YHR035W, YHR037W, YHR038W, YHR039C, YHR041C, YHR043C, YHR044C, YHR046C, YHR047C, YHR048W, YHR049W, YHR050W, YHR051W, YHR053C, YHR056C, YHR057C, YHR059W, YHR061C, YHR063C, YHR064C, YHR066W, YHR067W, YHR071W, YHR073W, YHR076W, YHR077C, YHR078W, YHR079C, YHR080C, YHR081W, YHR082C, YHR084W, YHR086W, YHR087W, YHR091C, YHR093W, YHR094C, YHR095W, YHR096C, YHR097C, YHR098C, YHR100C, YHR102W, YHR103W, YHR104W, YHR105W, YHR106W, YHR108W, YHR109W, YHR110W, YHR111W, YHR112C, YHR113W, YHR114W, YHR115C, YHR116W, YHR117W, YHR119W, YHR120W, YHR123W, YHR124W, YHR125W, YHR126C, YHR127W, YHR128W, YHR129C, YHR130C, YHR131C, YHR132C, YHR133C, YHR134W, YHR135C, YHR136C, YHR137W, YHR138C, YHR139C, YHR140W, YHR142W, YHR143W, YHR144C, YHR145C, YHR146W, YHR147C, YHR149C, YHR150W, YHR152W, YHR153C, YHR154W, YHR155W, YHR156C, YHR157W, YHR158C, YHR159W, YHR161C, YHR162W, YHR163W, YHR167W, YHR168W, YHR175W, YHR176W, YHR177W, YHR179W, YHR180W, YHR181W, YHR182W, YHR184W, YHR185C, YHR191C, YHR192W, YHR193C, YHR194W, YHR195W, YHR198C, YHR199C, YHR200W, YHR201C, YHR202W, YHR203C, YHR204W, YHR206W, YHR207C, YHR208W, YHR209W, YHR210C, YHR211W, YHR212C, YHR213W, YHR214W, YHR215W, YHR217C, YHR218W, YHR219W.
A collection of viable haploids with disruptions of ORFs on chromosome I was constructed. In a haploid strain, BY4739, each ORF was substituted with a replacement cassette containing a kanamycin resistance gene. Replacement cassettes were prepared by two rounds of the polymerase chain reaction (PCR) from the plasmid pFA6-kanMX4 (Wach et al., 1994). Additional details are available from the Saccharomyces Genome Deletion Project web site, sequence-www.stanford.edu/group/yeast_deletion_project/deletions3.html. Transformants were tested by PCR for correct integration.
Haploid mutants carrying disruptions of the following 74 open reading frames on chromosome I were tested: YAL068C, YAL067C, YAL066W, YAL065C, YAL065C-a, YAL064W, YAL063C, YAL062W, YAL061W, YAL060W, YAL059W, YAL058W, YAL056W, YAL055W, YAL053W, YAL051W, YAL049C, YAL048C, YAL046C, YAL045C, YAL044C, YAL042W, YAL043C, YAL040C, YAL039C, YAL037W, YAL036C, YAL035W, YAL034C, YAL031C, YAL030W, YAL029C, YAL028W, YAL027W, YAL026C, YAL024C, YAL023C, YAL022C, YAL021C, YAL020C, YAL019W, YAL018C, YAL017W, YAL015C, YAL014C, YAL013W, YAL011W, YAL010C, YAL009W, YAL008W, YAL007C, YAL004W, YAL005C, YAL002W, YAR002W, YAR003W, YAR014C, YAR015W, YAR018C, YAR020C, YAR023C, YAR027W, YAR028W, YAR029W, YAR031W, YAR030C, YAR033W, YAR035W, YAR037W, YAR040C, YAR042W, YAR043C, YAR044W, YAR047C.
A collection of viable haploids with disruptions randomly positioned about the genome was produced by a transposon insertion method. A library of 7 kb yeast genome fragments with miniTn3 transposon insertions was generously provided by M. G. Goebl and K. T. Chun (Indiana University, Indianapolis) (Chun and Goebl, 1996). This library was transformed into the haploid strain YJC1261, which contained GFP-Cap2p to allow visualization of cortical actin patches without staining. To prepare YJC1261 the chromosomal cap2::URA3 disruption in KT903 was replaced with a CAP2-GFP fusion gene by integrational transformation. The CAP2-GFP fusion contained the S65T variant of GFP and was prepared from pBJ646 (Waddle et al., 1996). We also prepared a strain carrying CAP2-GFP and the sac6Δ mutation to serve as a positive control in this screen. This strain, YJC1435, was obtained by inserting GFP (S65T) and HIS3 at the C terminus of CAP1 in AAY1046, sac6Δ (Adams et al., 1993). The cassette with GFP (S65T) and HIS3 was prepared by polymerase chain reaction by the methods described by Niedenthal et al. (1996) and above. Two chimeric primers contained 45 bp sequences upstream and downstream of CAP1 stop codon. Plasmid pSW387 (S. Wente, Washington University, St Louis) was used as a template.
Strains were grown on YPD plates (BIO101, LaJolla, CA) except in the following cases. For growth curves and tests of depolarization in fixed cells strains were grown with aeration in liquid YPD. For tests of depolarization in live cells, strains were grown on DOBA-based synthetic medium (BIO101, La Jolla, CA) with aeration.
Doubling times in liquid culture
A 12 hour overnight culture of each strain tested was diluted to 104 cells/ml in YPD and grown at 30°C. 5 ml aliquots was fixed at 1 hour intervals in 3.7% formaldehyde, added directly to the medium from a 37% stock. The fixed cells were sonicated and counted in a hemacytometer.
The doubling time (T) was calculated as the slope of the plot of t(log2) versus log(N), where t is time and N is cell number. T and the standard error of T were derived by unweighted linear regression analysis performed with the Macintosh shareware program Linear Regression Pro (written by G. Hammond, available from Info-Mac Archives). The method of calculation used in the program is described by Press et al. (1991).
Growth rates on plates
The strains with known doubling times in liquid culture were used as standards to assess the growth on plates of haploids with chromosome VIII ORF disruptions. Serial 10-fold dilutions of a 15 hour overnight culture were placed on YPD plates with a multi-prong device. The degree of growth after 36 hours at 30°C was compared with those of the standard strains.
Actin polarization in fixed cells
Polarization of the actin cytoskeleton was assessed by rhodamine phalloidin staining of fixed cells for the cap2Δ, sac6Δ, myo1Δ, tpm1Δ, gle1-4, and fur1 mutants and the viable haploids with chromosome I and VIII disruptions. Cultures were grown at 25°C and fixed at 106 cells/ml in 3.7% formaldehyde, added directly to the medium from 37% stock. Cells were stained with rhodamine phalloidin (Molecular Probes, Eugene, OR) for F-actin and 4,6-diamidino-2-phenylindole (DAPI) (Sigma, St Louis, MO) for DNA with minor modifications from described procedures (Kaiser et al., 1994). Modifications were that the rhodamine phalloidin concentration was 0.165 μM, and the staining was done on ice. Small volumes of cells were mounted on glass slides with coverslips.
Cells were imaged on an epifluorescence microscope (Bmax-60F, Olympus) with a 1.35 NA ×100 UPlanApo objective and U-MNG (rhodamine phalloidin) and U-MWU (DAPI) filter set. Photobleaching was reduced by using an ND25 neutral density filter in the excitation light path. Images were collected with a cooled CCD video camera (RC300, Dage-MIT, Michigan City, IN).
The degree of actin cytoskeleton polarization was examined only in cells at early stages of the cell cycle in which the actin cytoskeleton is normally polarized to the growing bud. We identified these cells as having a single mass of DNA, revealed by DAPI staining. We excluded from this analysis cells at later stages of the cell cycle, identified as having two masses of DNA. At these later stages of the cell cycle, actin is first completely depolarized and then polarized to the site of cell division. Restricting the analysis to stages of the cell cycle in which actin should be polarized was necessary to exclude the possibility that a mutant might have an increased fraction of cells in the later stages of the cell cycle and therefore appear to be impaired in polarization. The myo1, fur1 and gle1 mutants showed an increased fraction of these cells.
For cap2Δ, sac6Δ, myo1Δ, tpm1Δ, gle1-4, and fur1 mutants and slow-growing mutants of the chromosome VIII disruption collection, we counted completely or partially depolarized cells, based on a qualitative assessment of the degree of clustering of patches at the incipient bud site or in the bud as opposed to the mother. 100 cells were counted for each sample. The standard error of proportion (s.e.p.) was calculated as √[p(1 − p)/n] (Spiegel, 1975). The correlation coefficient r for levels of depolarization and doubling times was calculated as (1/n − 1)Σ [(Xi − X)(Yi − Y)/SxSy] (Spiegel, 1975). The P value for r was determined by calculation of Student’s t-value as t = r √(n − 2)/(1 − r2)(Spiegel, 1975).
The 273 strains of the chromosome I and VIII disruption collection were assayed qualitatively for actin polarization in a blinded controlled manner. Strains were divided into sets easily screened in one day. Each set included negative controls (wild-type JC482 and YM4585) and positive controls (KT903 and YJC108, cap2Δ). The controls were coded and mixed among the experimental samples so that the observer did not know the identity of the strains. In each set of strains, the observer always correctly assessed the polarization morphology of both the positive and the negative control strains. In addition, the fact that the control strains always had the appropriate polarization morphology ensured that the strains were grown and processed properly.
Actin polarization in live cells
For the transposon-induced gene disruptions, polarization of the actin cytoskeleton was assessed in living cells. The Cap2p-GFP fusion protein resides in actin patches, so the presence of Cap2p-GFP permitted us to observe actin patches without staining (Waddle et al., 1996). A sac6Δ mutant carrying CAP1-GFP fusion (YJC1435) was used as a positive control, and a wild-type strain (YJC1261) was used as a negative control. Polarization of patches was assessed in cells with small and medium buds, which are normally polarized.
Growth conditions were optimized so that multiple cultures might be grown and screened without loss of polarization. Cells from an agar plate were grown overnight in liquid culture in a 96-well plate, diluted 10-fold into fresh medium in a 96-well plate, grown for 18 hours, again diluted 10-fold into fresh medium in a 96-well, and grown for 6 hours. Cells were mounted on glass slides with coverslips in a volume large enough that the cells were floating. If cells were squeezed between the slide and coverslip, depolarization of actin occurred. Strains were analyzed in sets of ≤90 per day. Control strains were included as described above for fixed cells. Cells were observed as above, except with a U-MWIBA filter set.
RESULTS
Actin cytoskeleton polarization in slow-growing mutants
We hypothesized that actin cytoskeleton depolarization might result from poor metabolism and/or slow growth. To test this hypothesis, we examined the actin cytoskeleton in two poor-growing mutants that carried mutations in genes not obviously involved in the actin cytoskeleton. The genes were FUR1, which encodes uracil phosphoribosyl transferase, involved in regulation of a pyrimidine salvage pathway (Jenness et al., 1987), and GLE1, which encodes an RNA export mediator residing in the nuclear pore (Murphy and Wente, 1996). The gle1-4 and fur1 mutants grew much more slowly than did wild-type strains (Table 2).
Table 2.
Doubling times (minutes) for mutant and isogenic wild-type strains
| Gene | Wild type | Mutant |
|---|---|---|
| FUR1 | 117±1 | 361±10 |
| GLE1 | 105±2 | 305±17 |
| CAP2 | 105±4 | 107±5 |
| SAC6 | 93±4 | 111±4 |
| TPM1 | 121±4 | 145±16 |
| MYO1 | 93±4 | 206±5 |
| YHR038w | 144±6 | |
| YHL011c | 125±6 | |
| YHR051w | 94±6 | |
| YHR047c | 106±5 | |
| YHR091c | 113±2 | |
| YHR098c | 131±5 | |
| YHR100c | 104±6 | |
| YHL027w | 119±5 | |
| YHR057c | 108±3 | |
| YHR120w | 148±11 |
Errors are standard error of the slope derived from linear regression analysis. FUR1 is YM4392, fur1 is YM4393, GLE1 is W303-1B, gle1 is SWY1191, CAP2 is JC482, cap2 is KT903, TPM1 is YJC103, tpm1 is YJC161, SAC6 is AAY1048, sac6 is AAY1046, myo1 is YHR023w. YM4585 is a wild-type isogenic strain for the myo1 mutant and for disruptions of ORFs YHR038w, YHL011c, YHR051w, YHR047c, YHR091c, YHR098c, YHR100c, YHL027w, YHR057c, YHR120w.
Both fur1 and gle1-4 strains showed low levels of actin depolarization similar to the levels seen in wild-type controls (Figs 1 and 2). Therefore, slow growth was not sufficient to cause depolarization of the actin cytoskeleton.
Fig. 1.
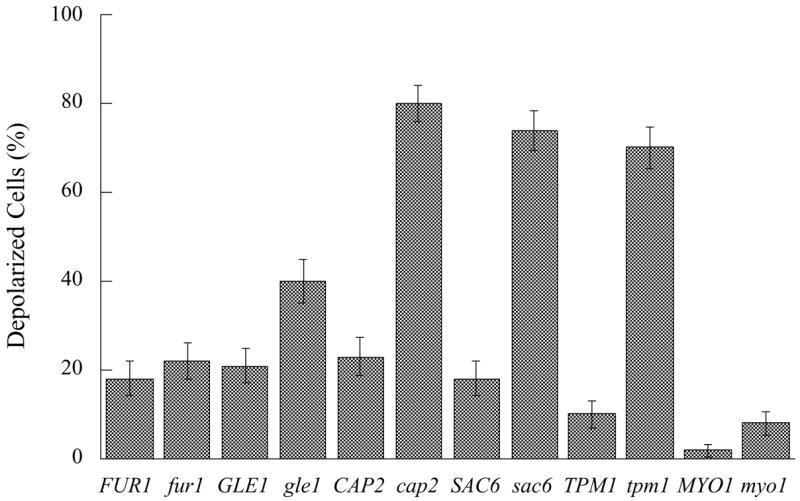
Levels of actin depolarization in budded cells with a single mass of DNA. The error bars are standard error of proportion. FUR1 is YM4392, fur1 is YM4393, GLE1 is W303-1B, gle1 is SWY1191, CAP2 is JC482, cap2 is KT903, TPM1 is YJC103, tpm1 is YJC161, SAC6 is AAY1048, sac6 is AAY1046, MYO1 is YM4585, myo1 is YHR023w.
Fig. 2.
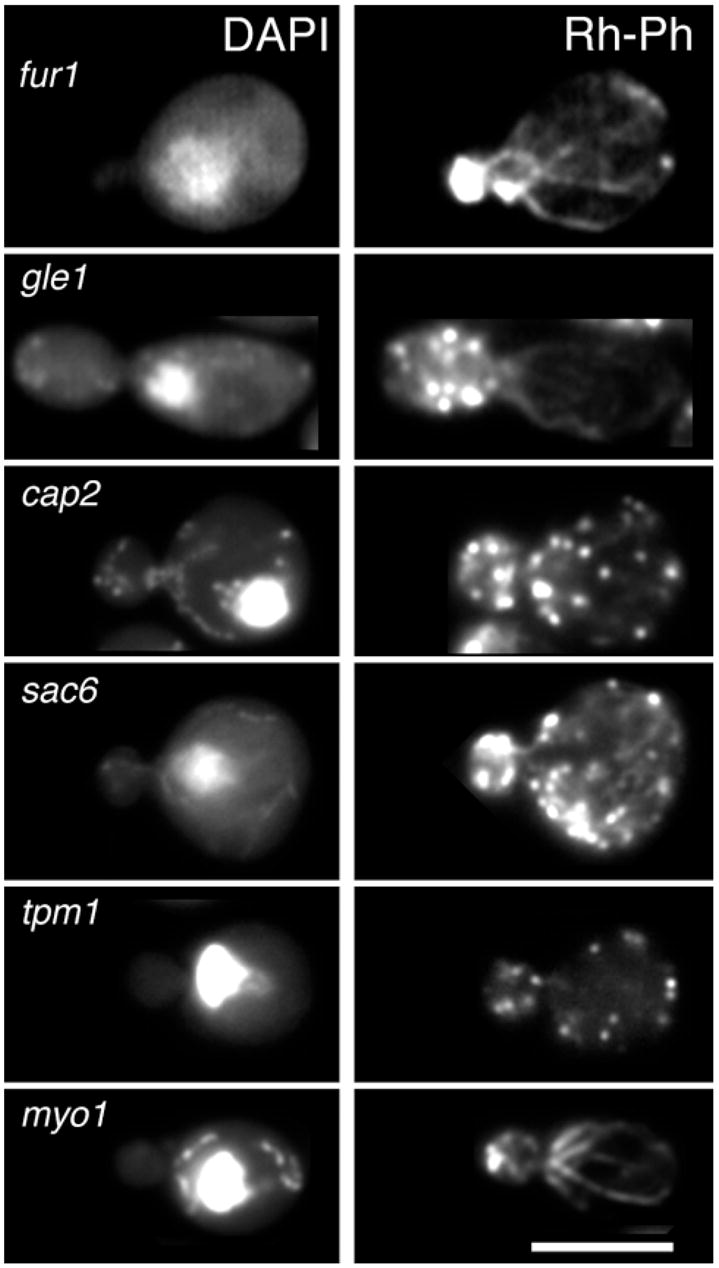
Polarization of the actin cytoskeleton in representative budded cells with a single mass of DNA. Mutant strains are as in Fig. 1. Cells were stained with DAPI to detect nuclei, shown on the left, and with rhodamine phalloidin (Rh-Ph), to detect F-actin, shown on the right. Bar, 5 μm.
To test more slow-growing strains, we selected slow-growing strains from our collection of viable chromosome VIII ORF disruption mutants. Selected strains grew on plates at least as poorly as the actin cytoskeleton tpm1Δ and sac6Δ mutants that have a depolarized actin cytoskeleton. We determined doubling times of those strains in liquid medium. Five strains (YHR091c, YHR038w, YHL011c, YHR098c, YHL027w) grew similarly or slower than sac6, and one strain (YHR120w) grew as slowly as tpm1Δ. The remaining four (YHR051w, YHR100c, YHR057c, YHR047c) grew as well as wild-type strains (Table 2). All ten strains had normal polarization of their actin cytoskeleton based on a qualitative assessment of budded cells.
Correlation of growth and depolarization in known actin cytoskeleton mutants
To further test the hypothesis that slow growth correlates with depolarization, we tested four strains with disruptions in different actin cytoskeleton genes, which show different degrees of defects in growth and depolarization. The cap2Δ, tpm1Δ, and sac6Δ mutants showed partial or complete actin depolarization (Figs 1 and 2). If depolarization is caused by poor growth, then the cap2Δ, tpm1Δ, and sac6Δ mutants are expected to have a growth defect much stronger than fur1 and gle1. In contrast, none of strains had deficits in growth rate as severe as those in the fur1 and gle1 mutants (Table 2).
In addition, the myo1Δ mutant had a moderate growth defect, greater than that of the cap2Δ, tpm1Δ, and sac6Δ strains and less than that of the fur1 and gle1 strains (Table 2). The myo1Δ mutant had no actin depolarization defect, providing further documentation that poor growth does not cause actin depolarization, even among components of the actin cytoskeleton.
Therefore, slow growth did not correlate with and was not sufficient to cause depolarization of the actin cytoskeleton (Fig. 3).
Fig. 3.
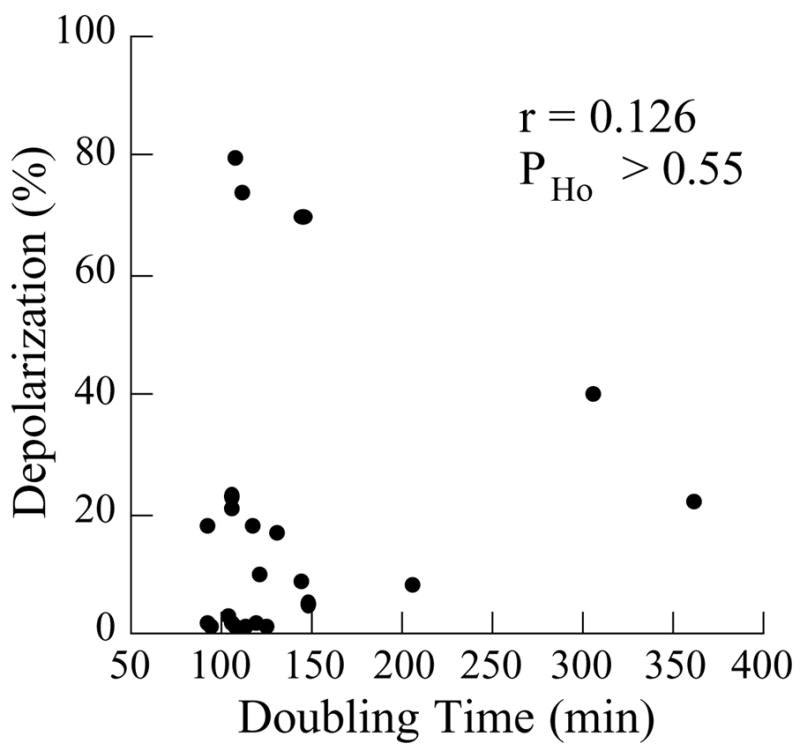
A scatter diagram for levels of depolarization and doubling times. The strains are as in Table 2. r is a correlation coefficient, and PHo is the probability of the null hypothesis (no correlation), calculated as described in Materials and Methods.
Screening of random genome mutations for defects in actin polarization
If depolarization of the actin cytoskeleton can be a consequence of a nonspecific defect in growth or metabolism, then mutations with this phenotype are predicted to be relatively common among random mutations of the genome. To test this prediction, we examined three collections of random mutants for depolarization of the actin cytoskeleton.
One collection consisted of disruptions of 199 nonessential ORFs in chromosome VIII, including 10 described above. The second collection consisted of disruptions of 74 nonessential ORFs in chromosome I. These collections did not contain any genes for which mutations are known to cause depolarization of the actin cytoskeleton. The known genes encoding actin-binding proteins were MYO1 (YHR023W) and MYO4(YAL029C) mutations in which do not cause actin depolarization as described above and by Haarer et al. (1994), respectively.
We designed the analysis taking great care not to miss strains with depolarized actin. We included as a positive control a viable haploid mutant with mild defects in actin polarization, cap2Δ. The majority of cap2Δ cells still display partial asymmetry of patch distribution. Cables are present and show only a partial loss of orientation (Fig. 4). This level of actin polarization defect is characteristic of many actin-binding protein mutants. Viable haploid mutants with far more severe depolarization phenotypes are also known, such as tpm1Δ (Liu and Bretscher, 1992) and bee1Δ (Li, 1997). Therefore, the analysis was designed to detect mutants with mild actin depolarization phenotypes. The cap2Δ positive control samples were mixed with the experimental samples, and the observer was blind to their identity. The observer always identified the positive control samples with a high level of certainty.
Fig. 4.
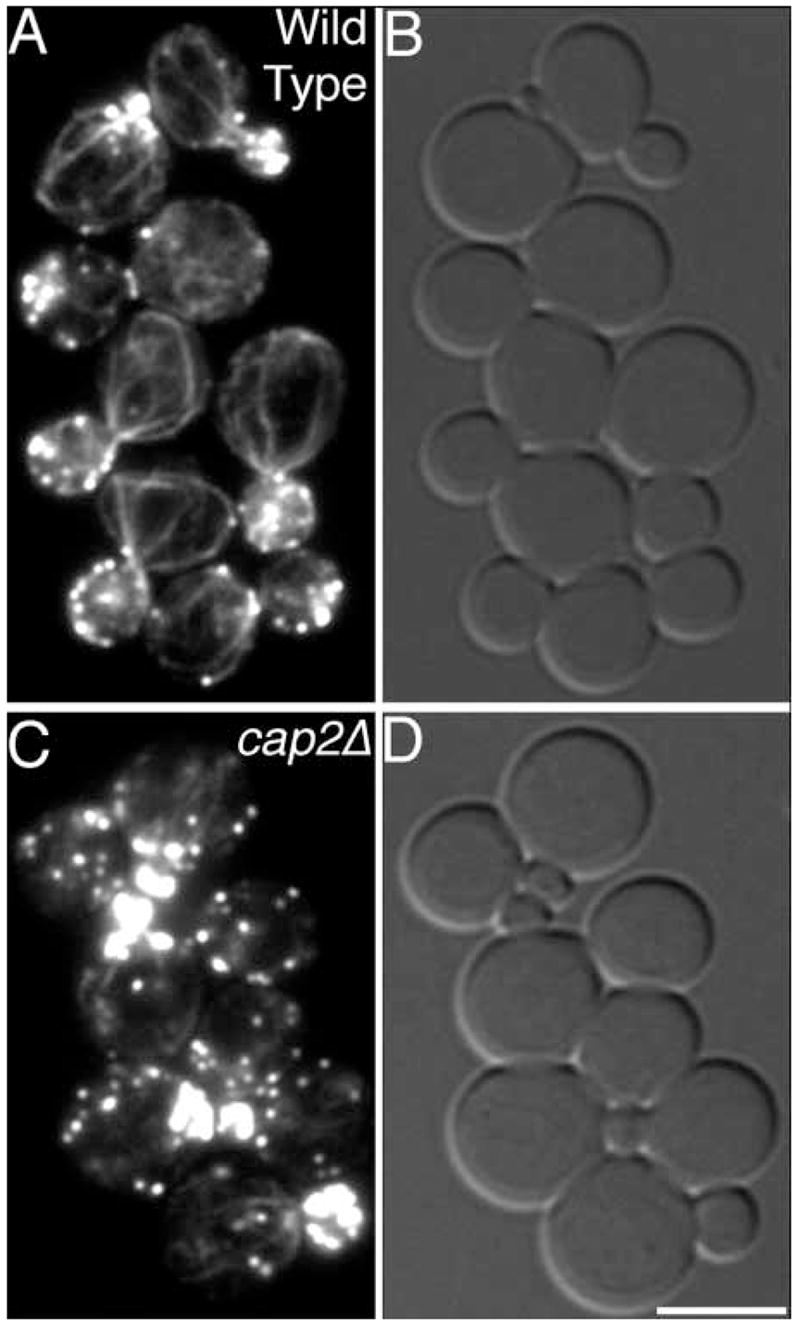
The actin cytoskeleton of the positive and negative control strains used in the screen of chromosome I and VIII disruptions. Rhodamine phalloidin (A,C) and bright-field (B,D) images of wild-type (JC482) and cap2Δ (YJC108) cells are shown. Bar, 5 μm.
None of the 273 strains in the chromosome I and VIII collections had obvious defects in actin polarization. This frequency was remarkably and unexpectedly low.
We were concerned that the analysis may have missed mutants with depolarized actin. However, several observations indicate that this did not occur. First, the positive controls were always correctly identified. Second, 6 strains were initially judged as possibly having a mild defect in polarization. Further examination of those 6 strains showed that they were identical to wild-type. Therefore, the sensitivity of the analysis was high. Third, the analysis identified one mutant with a very subtle phenotype much more difficult to distinguish than actin depolarization. That mutant, YAL010C on chromosome I, was observed to have relatively short actin cables that did not extend the full length of the cell. YAL010C is MDM10, which encodes a mitochondrial protein involved in mitochondrial segregation. The mdm10 mutant has defects in mitochondrial morphology and distribution (Sogo and Yaffe, 1994). The actin cytoskeleton of the mdm10 mutant has not been described. However, the mdm20 mutant, which is also defective in mitochondrial segregation, has a moderate defect in actin polarization (Hermann et al., 1997). Suppression of the mdm20 mutant by overexpression of Tpm1p or Tpm2p partially restores the actin polarization defect but the actin cables are shortened in the manner observed here for mdm10.
Another collection consisted of 950 mutants generated by random transposon insertions. In these strains, actin polarization was assessed qualitatively from the localization of actin patches in living cells, using GFP-Cap2p (Waddle et al., 1996). This collection should have represented mutations in about 216 different genes, as described (Chun and Goebl, 1996).
As above, we ensured that depolarization mutants were not missed by including positive and negative controls in each set of strains (Fig. 5). The positive control was the sac6Δ mutant, which has a moderate defect in polarization. Most sac6Δ cells show partial asymmetry of patch localization; however, the sac6Δ strain was always identified with certainty in the blinded screen. Living cells are prone to lose their actin polarization when growth conditions are unfavorable; therefore, if the screen had a bias, it was towards false positives. Indeed, several false positives were recovered, but they proved to be wild type in subsequent tests. None of the strains of the collection had obvious defects in polarity of the actin cytoskeleton.
Fig. 5.
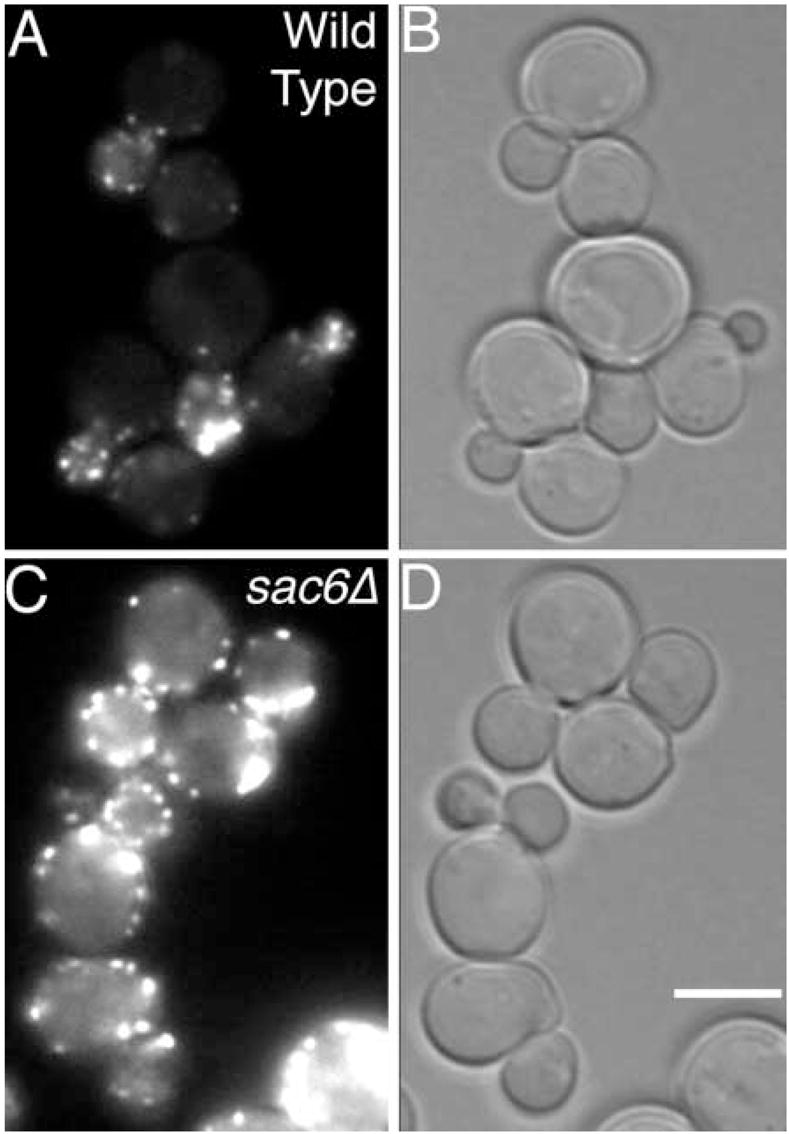
The actin cytoskeleton of the positive and negative control strains used in the screen of random transposon-induced mutants. GFP-Cap2p fluorescence (A,C) and bright-field (B,D) images of wild-type (YJC1261) and sac6Δ (YJC1435) cells are shown. Bar, 5 μm.
Together these results show that the probability of a gene disruption causing depolarization of the actin cytoskeleton is extremely low, which refutes the hypothesis that depolarization is a common and non-specific phenotype.
DISCUSSION
Is depolarization of the actin cytoskeleton in a mutant a reliable indication that a gene is involved in the function of the actin cytoskeleton? Alternatively, could effects on the actin cytoskeleton be nonspecific reflections of strained metabolism and poor growth? This study is the first work to address these questions in a systematic fashion. If mutations or environmental conditions that impair metabolism and growth can induce actin depolarization, two predictions follow. First, any mutation that slows growth should induce actin depolarization. Second, the number of genes that can be mutated to obtain actin cytoskeleton depolarization should constitute a relatively large fraction of the genome. We tested these predictions in this study.
First, we observed no correlation between poor growth and depolarization of the actin cytoskeleton. A number of poorly growing strains showed normal polarization of the actin cytoskeleton. Furthermore, among several mutants of actin cytoskeleton genes, there was no correlation between the rate of growth and the level of actin depolarization.
The absence of correlation between the rate of growth and depolarization is an important and novel conclusion. Even if one assumes that a certain level of polarization is necessary for bud growth, an assumption for which no evidence exists, one must appreciate that the high level of depolarization in some viable actin-binding protein mutants is compatible with viability and growth. Therefore, one might expect that strains growing slower than known mutants with a depolarized cytoskeleton would also have defects in polarization at least as severe as those of the known mutants. In contrast, strains growing slower than known actin cytoskeleton mutants actually had better polarization.
In addition, the frequency of genes that affect actin cytoskeleton polarization is low. Polarization of the actin cytoskeleton was tested in ~1,220 strains that included ~490 different mutants. We tested two collections of viable haploids carrying random mutations. 273 mutants represented viable disruptions of individual ORFs on chromosomes I and VIII. A second collection, obtained by random insertion of a transposon, is expected to include ~216 different gene disruptions. In both collections, we found no strains in which the actin cytoskeleton was depolarized.
The low frequency of actin depolarization mutants is surprising because of the number of such mutants that have been identified by targeted disruption of known genes. Several considerations show that these results are indeed correct. First, the experimental analysis included appropriate positive controls, which where always identified with certainty. Second, the initial analysis was designed to err on the side of sensitivity, and a number of false positives were identified in the initial analysis. Third, the high degree of sensitivity of the initial analysis was documented by our discovery of a very subtle phenotype, much less dramatic than depolarization, in one mutant. This phenotype was short actin cables in the mdm10 mutant of the chromosome I collection. Fourth, there are no known genes on chromosome I or VIII that were expected to produce actin depolarization in a viable haploid mutant.
The low frequency of actin depolarization mutants in this analysis has important implications. First, since the phenotype is highly specific, the test for actin depolarization should be performed on all the mutants being produced by the portion of the yeast genome project in which all genes are being disrupted systematically. Second, the overall number of actin depolarization mutants in the entire genome should be quite low. Therefore, the collection of mutants that have been identified by targeted disruption of known genes may be nearly complete, or at least far more so than one might have imagined before our analysis.
Third, for proteins whose sequence or localization do not suggest a relationship to actin but who have an actin depolarization mutant phenotype, serious consideration and further analysis of their potential role in the actin cytoskeleton is now warranted. A related point is that the role of the actin cytoskeleton in response to stress, such as heat and osmotic shock, is likely to be a specific and functional part of how cells respond and adapt to stress. Therefore, understanding the molecular mechanism of the actin changes is an important part of understanding the cellular stress response.
Acknowledgments
We are grateful to Drs M. G. Goebl and K. T. Chun (Indiana University, Indianapolis) for the generous gift of a library with miniTn3 transposon insertions. We acknowledge the support and helpful discussions of Dr M. Johnston (Washington University, St Louis). This work was supported by grants from NIH (GM47337) to J. A. Cooper, from the US National Center for Human Genome Research (HG00956, R. H. Waterston, PI) to M. Johnston, and from the Medical Research Council of Canada to H. Bussey. J. A. Cooper is an Established Investigator of the American Heart Association. J. H. H. was supported by the FAZIT-Stiftung and the German BMBF-Projekt ‘Functional Analysis of novel Yeast Genes’ (FKZ 0310577).
References
- Adams AEM, Botstein D, Drubin DG. A yeast actin-binding protein is encoded by SAC6, a gene found by suppression of an actin mutation. Science. 1989;243:231–233. doi: 10.1126/science.2643162. [DOI] [PubMed] [Google Scholar]
- Adams AEM, Cooper JA, Drubin DG. Unexpected combinations of null mutations in genes encoding the actin cytoskeleton are lethal in yeast. Mol Biol Cell. 1993;4:459–468. doi: 10.1091/mbc.4.5.459. [DOI] [PMC free article] [PubMed] [Google Scholar]
- Amatruda JF, Cannon JF, Tatchell K, Hug C, Cooper JA. Disruption of the actin cytoskeleton in yeast capping protein mutants. Nature. 1990;344:352–354. doi: 10.1038/344352a0. [DOI] [PubMed] [Google Scholar]
- Amberg D, Basart E, Botstein D. Defining protein interactions with yeast actin in vivo. Struct Biol. 1995;2:28–35. doi: 10.1038/nsb0195-28. [DOI] [PubMed] [Google Scholar]
- Botstein D, Amberg D, Mulholland J, Huffaker T, Adams A, Drubin D, Stearns T. The yeast cytoskeleton. The Molecular and Cellular Biology of the Yeast Saccharomyces. In: Pringle JR, Broach JR, Jones EW, editors. Cell Cycle and Cell Biology. Cold Spring Harbor Laboratory Press; Cold Spring Harbor: 1997. pp. 1–92. [Google Scholar]
- Chowdhury S, Smith K, Gustin M. Osmotic stress and the yeast cytoskeleton: phenotype-specific suppression of an actin mutation. J Cell Biol. 1992;118:561–571. doi: 10.1083/jcb.118.3.561. [DOI] [PMC free article] [PubMed] [Google Scholar]
- Chun KT, Goebl MG. The identification of transposon-tagged mutations in essential genes that affect cell morphology in Saccharomyces cerevisiae. Genetics. 1996;142:39–50. doi: 10.1093/genetics/142.1.39. [DOI] [PMC free article] [PubMed] [Google Scholar]
- Dean N, Poster JB. Molecular and phenotypic analysis of the S. cerevisiae MNN10 gene identifies a family of related glycosyltransferases. Glycobiology. 1996;6:73–81. doi: 10.1093/glycob/6.1.73. [DOI] [PubMed] [Google Scholar]
- Drees B, Brown C, Barrell BG, Bretscher A. Tropomyosin is essential in yeast, yet the TPM1 and TPM2 products perform distinct functions. J Cell Biol. 1995;128:383–392. doi: 10.1083/jcb.128.3.383. [DOI] [PMC free article] [PubMed] [Google Scholar]
- Haarer BK, Petzold A, Lillie SH, Brown SS. Identification of MYO4, a second class V myosin gene in yeast. J Cell Sci. 1994;107:1055–1064. doi: 10.1242/jcs.107.4.1055. [DOI] [PubMed] [Google Scholar]
- Hermann GJ, King EJ, Shaw JM. The yeast gene, MDM20, is necessary for mitochondrial inheritance and organization of the actin cytoskeleton. J Cell Biol. 1997;137:141–153. doi: 10.1083/jcb.137.1.141. [DOI] [PMC free article] [PubMed] [Google Scholar]
- Jenness D, Goldman B, Hartwell L. Saccharomyces cerevisiae mutants unresponsive to alpha-factor pheromone: alpha-factor binding and extragenic suppression. Mol Cell Biol. 1987;7:1311–1319. doi: 10.1128/mcb.7.4.1311. [DOI] [PMC free article] [PubMed] [Google Scholar]
- Johnson DI, Pringle JR. Molecular characterization of CDC42, a Saccharomyces cerevisiae gene involved in the development of cell polarity. J Cell Biol. 1990;111:143–152. doi: 10.1083/jcb.111.1.143. [DOI] [PMC free article] [PubMed] [Google Scholar]
- Kaiser C, Michaelis S, Mitchell A. Methods in Yeast Genetics. Cold Spring Harbor Laboratory Press; Cold Spring Harbor, NY. Plainview: 1994. pp. 1–234. [Google Scholar]
- Karpova TS, Lepetit MM, Cooper JA. Mutations that enhance the cap2 null mutant phenotype in Saccharomyces cerevisiae affect the actin cytoskeleton, morphogenesis, and pattern of growth. Genetics. 1993;135:693–709. doi: 10.1093/genetics/135.3.693. [DOI] [PMC free article] [PubMed] [Google Scholar]
- Kilmartin JV, Adams AEM. Structural rearrangements of tubulin and actin during the cell cycle of the yeast Saccharomyces. J Cell Biol. 1984;98:922–933. doi: 10.1083/jcb.98.3.922. [DOI] [PMC free article] [PubMed] [Google Scholar]
- Li R. Bee1, a yeast protein with homology to Wiskott-Aldrich syndrome protein, is critical for the assembly of cortical actin cytoskeleton. J Cell Biol. 1997;136:649–658. doi: 10.1083/jcb.136.3.649. [DOI] [PMC free article] [PubMed] [Google Scholar]
- Lillie SH, Brown SS. Immunofluorescence localization of the unconventional myosin, Myo2p, and the putative kinesin-related protein, Smy1p, to the same regions of polarized growth in Saccharomyces cerevisiae. J Cell Biol. 1994;125:825–842. doi: 10.1083/jcb.125.4.825. [DOI] [PMC free article] [PubMed] [Google Scholar]
- Liu HP, Bretscher A. Disruption of the single tropomyosin gene in yeast results in the disappearance of actin cables from the cytoskeleton. Cell. 1989;57:233–242. doi: 10.1016/0092-8674(89)90961-6. [DOI] [PubMed] [Google Scholar]
- Liu H, Bretscher A. Characterization of TPM1 disrupted yeast cells indicates an involvement of tropomyosin in directed vesicular transport. J Cell Biol. 1992;118:285–299. doi: 10.1083/jcb.118.2.285. [DOI] [PMC free article] [PubMed] [Google Scholar]
- Mayinger P, Bankaitis VA, Meyer DI. Sac1p mediates the adenosine triphosphate transport into yeast endoplasmic reticulum that is required for protein translocation. J Cell Biol. 1995;131:1377–1386. doi: 10.1083/jcb.131.6.1377. [DOI] [PMC free article] [PubMed] [Google Scholar]
- Mondesert G, Reed SI. BED1, a gene encoding a galactosyltransferase homologue, is required for polarized growth in Saccharomyces cerevisiae. J Cell Biol. 1996;132:137–152. doi: 10.1083/jcb.132.1.137. [DOI] [PMC free article] [PubMed] [Google Scholar]
- Murphy R, Wente S. An RNA-export mediator with an essential nuclear export signal. Nature. 1996;383:357–360. doi: 10.1038/383357a0. [DOI] [PubMed] [Google Scholar]
- Niedenthal RK, Riles L, Johnston M, Hegemann JH. Green fluorescent protein as a marker for gene expression and subcellular localization in budding yeast. Yeast. 1996;12:773–786. doi: 10.1002/(SICI)1097-0061(19960630)12:8%3C773::AID-YEA972%3E3.0.CO;2-L. [DOI] [PubMed] [Google Scholar]
- Novick P, Botstein D. Phenotypic analysis of temperature-sensitive yeast actin mutants. Cell. 1985;40:405–416. doi: 10.1016/0092-8674(85)90154-0. [DOI] [PubMed] [Google Scholar]
- Novick P, Osmond BC, Botstein D. Suppressors of yeast actin mutations. Genetics. 1989;121:659–674. doi: 10.1093/genetics/121.4.659. [DOI] [PMC free article] [PubMed] [Google Scholar]
- Press WH, Flannery BP, Teukolsky SA, Vetterling WT. Numerical Recipes in Pascal. Cambridge University Press; New York: 1991. pp. 1–781. [Google Scholar]
- Sogo LF, Yaffe MP. Regulation of mitochondrial morphology and inheritance by Mdm10p, a protein of the mitochondrial outer membrane. J Cell Biol. 1994;126:1361–1373. doi: 10.1083/jcb.126.6.1361. [DOI] [PMC free article] [PubMed] [Google Scholar]
- Spiegel MR. Shaum’s Outline of Theory and Problems of Probability and Statistics. McGraw-Hill Book Company; New York: 1975. pp. 1–372. [Google Scholar]
- Wach A, Brachat A, Pohlmann R, Philippsen P. New heterologous modules for classical or PCR-based gene disruptions in Saccharomyces cerevisiae. Yeast. 1994;10:1793–1808. doi: 10.1002/yea.320101310. [DOI] [PubMed] [Google Scholar]
- Waddle JA, Karpova TS, Waterston RH, Cooper JA. Movement of cortical actin patches in yeast. J Cell Biol. 1996;132:861–870. doi: 10.1083/jcb.132.5.861. [DOI] [PMC free article] [PubMed] [Google Scholar]