

Abstract
Background
Predictors of antiretroviral treatment (ART) failure are not well characterized for heterogeneous clinic populations.
Methods
A retrospective analysis was conducted of HIV-infected patients followed in an urban HIV clinic with an HIV RNA measurement ≤400 copies/mL on ART between January 1, 2003, and December 31, 2004. The primary endpoint was treatment failure, defined as virologic failure (≥1 HIV RNA measurement >400 copies/mL), unsanctioned stopping of ART, or loss to follow-up. Prior ART adherence and other baseline patient characteristics, determined at the time of the first suppressed HIV RNA load on or after January 1, 2003, were extracted from the electronic health record (EHR). Predictors of failure were assessed using proportional hazards modeling.
Results
Of 829 patients in the clinic, 614 had at least 1 HIV RNA measurement ≤400 copies/mL during the study period. Of these, 167 (27.2%) experienced treatment failure. Baseline characteristics associated with treatment failure in the multivariate model were: poor adherence (hazard ratio [HR] = 3.44; 95% confidence interval [CI]: 2.34 to 5.05), absolute neutrophil count <1000/mm3 (HR = 2.90, 95% CI: 1.26 to 6.69), not suppressed on January 1, 2003 (HR = 2.69, 95% CI: 1.78 to 4.07) or <12 months of suppression (HR = 1.64, 95% CI: 1.10 to 2.45), CD4 count <200 cells/mm3 (HR = 1.90, 95% CI: 1.31 to 2.76), nucleoside-only regimen (HR = 1.75, 95% CI: 1.08 to 2.82), prior virologic failure (HR = 1.70, 95% CI: 1.22 to 2.39) and ≥1 missed visit in the prior year (HR = 1.56, 95% CI: 1.13 to 2.16).
Conclusions
More than one quarter of patients in a heterogeneous clinic population had treatment failure over a 2-year period. Prior ART adherence and other EHR data readily identify patient characteristics that could trigger specific interventions to improve ART outcomes.
Keywords: adherence, antiretroviral therapy, electronic health record, HIV, treatment failure, virologic failure
With the use of combination antiretroviral therapy (ART), HIV mortality has declined dramatically in the United States.1 However, treatment outcomes in the clinic setting continue to be substantially worse than those in clinical trials.2 Treatment failure, whether attributable to virologic failure, stopping ART, or loss to follow-up, has been shown to increase morbidity and mortality.3–5 Predictors of treatment outcomes have generally been analyzed using clinical trial data; however, these results may not be applicable to more heterogeneous clinic cohorts.6–8
Known predictors of ART failure include poor adherence to medications, prior virologic failure, higher baseline HIV RNA measurement (viral load), lower CD4 cell count, missed visits, and younger age.2,9,10 Of these, adherence to ART has been shown to be one of the most important predictors of virologic success and preventing disease progression.11–15 Whether HIV providers’ assessments of patient adherence as documented in the electronic health record (EHR) correlate with treatment failure is unknown, however, and others have questioned whether HIV clinicians are able to estimate patient adherence accurately.13,16,17
In contrast to subjects in clinical trials, clinical cohorts are composed of patients on many different regimens with varying ART histories. Most analyses of these cohorts have focused on homogeneous subsets of patients, for example, those starting their first protease inhibitor–containing regimen.2,18–23 Time is typically measured from when the patients start ART rather than over a uniform period.10,24–32 A less common approach, concurrent analyses of entire cohorts, has been useful in describing predictors for AIDS progression.9 Such results may be generalizable to other clinic populations and could be adapted for disease management interventions. Our objective was to identify predictors of ART treatment failure using a concurrent analysis of EHRs for all patients followed in an urban HIV clinic, with a goal of informing future disease management interventions to improve outcomes.
METHODS
Study Design and Data Source
We conducted a retrospective longitudinal analysis of HIV-infected patients followed in the Massachusetts General Hospital (MGH) HIV Outpatient Clinic. The clinic serves a diverse patient population from the greater Boston metropolitan area. Patients are managed by fellows, residents, or nurse practitioners, all under the supervision of attending physicians, or by attending physicians alone. The clinic also provides primary care for approximately half of the patients. On-site consultative services include: hepatitis C virus (HCV) coinfection, neurology, psychiatry, acupuncture, social work, and case management. Approximately 10% receive some of their care through clinical trials, also offered onsite.
Since 2002, the MGH HIV practice has used a web-based HIV-specific EHR known as Virology On Call. In addition to the electronic record, paper charts are used to store old records, outside laboratory results, and consultant notes. The EHR contains information on patient demographics, HIV risk behaviors, adherence to ART, medications, and diagnoses, which is entered by providers as part of routine clinical documentation. Chart extractors enter patients’ prior HIV problems and ART regimens. MGH laboratory results, billing data, and appointments a re regularly downloaded from hospital databases. Validation of the EHR data has been performed by comparing HIV RNA results from the EHR with the primary laboratory database and by comparing medical problem lists with paper records on a subset of patients. RNA results were perfectly matched, and approximately 95% of key HIV diagnoses were correctly recorded in the EHR.
Inclusion Criteria
We used the Virology On Call database to identify HIV-infected patients who had at least 2 MGH HIV clinic appointments and at least 2 HIV RNA determinations between January 1, 2003, and December 31, 2004. Patients who achieved virologic suppression (defined as at least 1 serum HIV RNA measurement ≤400 copies/mL) on ART during the 2-year interval were included in the analysis. Study entry date was defined as the first HIV RNA measurement ≤400 copies/mL during the study period. The threshold for virologic suppression of ≤400 copies/mL was chosen because it is the higher of the lower limits of detection of the 2 assays used by the MGH laboratory (Standard and Ultrasensitive Roche Amplicor Assays, Indianapolis, IN). This study was approved by the Partners Institutional Review Board.
Data extractions using the EHR and paper records were conducted to determine baseline characteristics for each patient at the time of study entry. Because of small numbers of nonwhite patients other than African Americans, race was classified as white or nonwhite. Other baseline characteristics included age at study entry; HIV risk factors (eg, men who have sex with men [MSM], heterosexual, injection drug users [IDUs]); time since HIV diagnosis; baseline ART regimen; time on baseline regimen; baseline and nadir CD4 cell counts; virologic suppression status (≤400 copies/mL) as of January 1, 2003 (and for those suppressed, the duration of virologic suppression); time since HIV diagnosis; previously cared for at another HIV clinic (transferred care); maximum and baseline HIV RNA loads; prior virologic failure; HCV antibody status; adherence to appointments in the prior year; and routine laboratory values. ART was characterized by the number of previously prescribed regimens, exposure to specific HIV drug classes, and regimen at study entry. Detailed definitions for baseline characteristics are provided in the Appendix.
Adherence to ART is typically documented by HIV providers in the EHR as part of routine clinical care. Patients’ prior adherence to ART was determined by extracting the last 3 clinic notes immediately preceding study entry. When prior assessments of adherence were unavailable (ie, new patients without prior notes), the initial and subsequent clinic notes were used. For the extraction, “good” adherence was defined as ≥85% adherence, missing less than the equivalent of 1 day of ART per week if quantified in the medical record, or use of adjectives such as good, excellent, near-perfect, or perfect. “Poor” adherence was defined as <85% or by use of adjectives such as fair, poor, or partial. Extraction and classification of patient adherence were done before determining virologic outcomes and performing analyses.
Antiretroviral Treatment Outcomes
The primary endpoint, treatment failure, was defined as the first occurrence of any of 3 events: loss to clinic follow-up, virologic failure, or stopping ART for reasons other than provider-sanctioned interruptions. Loss to clinic follow-up was defined as no clinic appointment or HIV RNA measurement for ≥6 months and no evidence of virologic failure at the last HIV RNA measurement (≤400 copies/mL). Deceased patients and those known to have transferred care from the all practice were censored at the date of the last visit. Virologic failure was defined as 2 consecutive HIV RNA measurements >400 copies/mL or a single measurement >400 copies/mL before loss to follow-up or unsanctioned stopping of ART. The third criterion for treatment failure, unsanctioned stopping of ART, was defined as discontinuation of ART for >2 weeks, except when approved by the HIV provider in response to high CD4 cell counts, lipodystrophy, 1 or more concomitant serious medical conditions unrelated to ART that required treatment discontinuation (eg, chemotherapy), or participation in a clinical trial.
We also performed a secondary analysis using virologic failure alone as the endpoint. Patients with virologic failure (as defined previously for the primary endpoint) and those who developed virologic failure within 2 weeks of stopping ART were included. A 2-week window was chosen for this analysis, because virologic rebound from stopping ART was thought to be unlikely to occur within this interval and because HIV RNA results were sometimes logged into the database several days after the actual phlebotomy. For this secondary analysis, patients continued to contribute to the analysis until they experienced virologic failure or stopped having HIV RNA measurements. For the latter, patients were censored on the date of their last HIV RNA measurement.
Statistical Analyses
Median and interquartile ranges (IQRs) were calculated. Univariate analyses were conducted using unadjusted Cox proportional hazards modeling and Kaplan-Meier curves for individual predictors of time to events. The validity of the proportional hazards assumption was verified using log-log plots of the survival function for all potential predictors. A forward stepwise method was used for selecting variables that were significant at the P ≤ 0.10 level in univariate testing, and those with P ≤ 0.10 were retained in the multivariate proportional hazards models. Analyses of maximum likelihood estimates were used to calculate hazard ratios (HRs) and 95% confidence intervals. Differences between adherence groups for time to events were assessed with the log rank test. Finally, 2-way interactions among clinically relevant predictors were examined. All analyses were performed using SAS statistical software (version 8e; SAS Institute, Cary, NC).
RESULTS
Of the 829 HIV-infected patients followed in the HIV clinic, 614 (74.1%) had at least 1 HIV RNA measurement <400 copies/mL (Fig. 1). Among these patients, there were 167 primary endpoints (treatment failure) and 108 secondary endpoints (virologic failure alone) during the 2-year study period. Univariate associations of baseline patient characteristics with endpoints are shown in Table 1.
FIGURE 1.
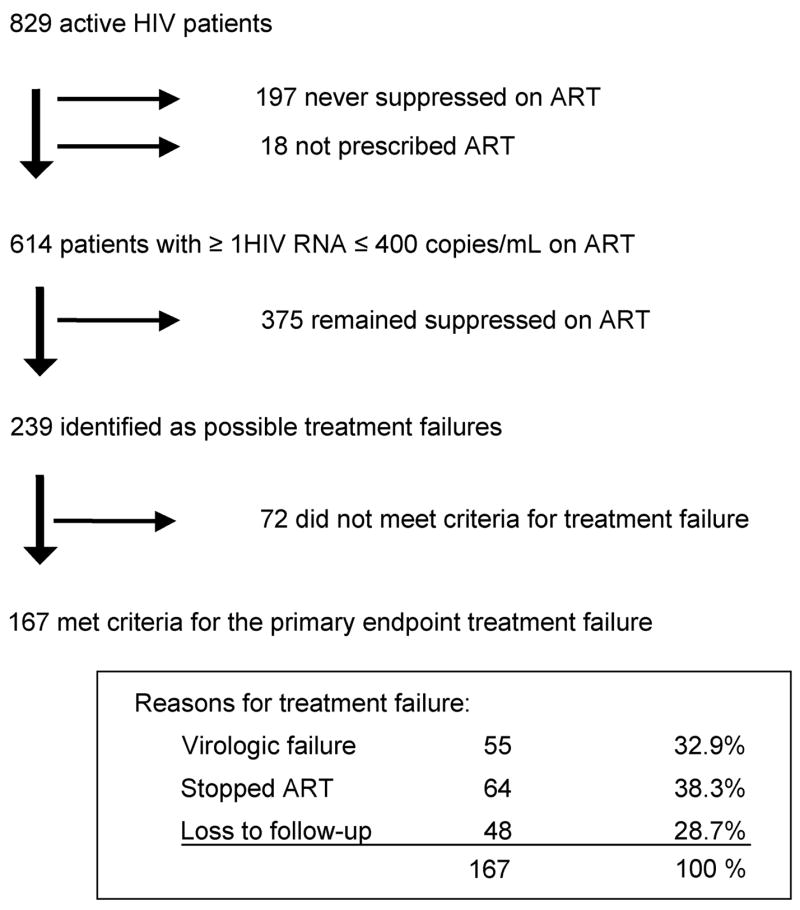
Classification of primary and secondary endpoints in the HIV clinic. Of the 72 patients deemed not to have met the criteria for treatment failure, 24 transferred their care, 16 stopped ART with the permission of their HIV providers because of lipodystrophy or high CD4 cell counts, 14 had approved absences from the clinic, 10 died, 6 stopped because of non–HIV-related serious illnesses, and 2 stopped as part of an interruption trial.
TABLE 1.
Descriptive Statistics and Univariate Analyses for Treatment Failure Among an Urban HIV Clinic Cohort: January 1, 2003, Through December 31, 2004
| Univariate Cox Proportional Hazards Model
|
|||||
|---|---|---|---|---|---|
| Variable (%) | No Treatment Failure (n = 447) | Treatment Failure (n = 167) | HR | 95% CI | P |
| Demographics | |||||
| Age <40 years | 34.7% | 42.5% | 1.44 | (1.06 to 1.96) | 0.020 |
| Male gender | 77.2% | 80.2% | 1.13 | (0.77 to 1.65) | 0.53 |
| Nonwhite race | 37.1% | 46.7% | 1.44 | (1.06 to 1.95) | 0.019 |
| HIV transmission risk factors | |||||
| Heterosexual transmission | 16.1% | 25.2% | 1.56 | (1.10 to 2.21) | 0.013 |
| MSM | 53.9% | 61.1% | 0.84 | (0.616 to 1.13) | 0.25 |
| Injection drug use | 11.2% | 23.4% | 2.07 | (1.45 to 2.96) | <0.0001 |
| Baseline treatment history | |||||
| Not suppressed as of January 1, 2003 | 29.3% | 38.3% | 3.04 | (2.18 to 4.23) | <0.0001 |
| <12 months of suppression | 17.7% | 28.7% | 1.48 | (1.06 to 2.07) | 0.022 |
| Transferred care | 51.2% | 61.1% | 1.45 | (1.06 to 1.97) | 0.021 |
| Missed visits (≥1 in prior year) | 32.4% | 53.3% | 1.86 | (1.37 to 2.52) | <0.0001 |
| No prior ART | 34.9% | 30.5% | 0.77 | (0.56 to 1.08) | 0.13 |
| Poor adherence | 4.0% | 24.0% | 4.92 | (3.44 to 7.04) | <0.0001 |
| Prior virologic failure | 32.2% | 50.3% | 2.33 | (1.72 to 3.16) | <0.0001 |
| Prior exposure to NRTIs only | 9.0% | 4.2% | 0.43 | (0.20 to 0.90) | 0.026 |
| Prior exposure to all 3 HIV drug classes | 21.3% | 27.0% | 1.52 | (1.08 to 2.13) | 0.017 |
| 3 or more prior regimens | 24.2% | 28.1% | 1.33 | (0.95 to 1.87) | 0.10 |
| Baseline ART regimen | |||||
| NRTI only | 6.3% | 12.6% | 1.62 | (1.02 to 2.55) | 0.040 |
| NRTI and PI | 42.1% | 46.7% | 1.35 | (1.00 to 1.83) | 0.051 |
| NRTI and NNRTI | 43.6% | 31.1% | 0.58 | (0.42 to 0.81) | 0.0012 |
| Baseline laboratory values | |||||
| Maximum HIV RNA measurement >100,000 copies/mL | 40.7% | 40.7% | 1.12 | (0.83 to 1.53) | 0.46 |
| CD4 count <200 cells/mm3 | 15.7% | 29.9% | 2.75 | (1.97 to 3.84) | <0.0001 |
| Nadir CD4 count <200 cells/mm3 | 50.6% | 56.9% | 1.25 | (0.92 to 1.70) | 0.15 |
| HCV antibody positive | 11.6% | 24.0% | 1.98 | (1.39 to 2.82) | 0.0002 |
| Absolute neutrophil count <1000 cells/mm3 | 1.6% | 3.6% | 3.01 | (1.33 to 6.82) | 0.0082 |
| Platelet count ≤200,000 cells/mm3 | 24.4% | 34.7% | 1.73 | (1.25 to 2.38) | 0.0008 |
| White blood cell count <2000 cells/mm3 | 1.1% | 1.8% | 2.36 | (0.75 to 7.41) | 0.14 |
| Hemoglobin <13.5 g/dL | 35.4% | 39.5% | 1.26 | (0.92 to 1.71) | 0.15 |
ANC indicates absolute neutrophil count; ART, antiretroviral therapy; NRTI, nucleoside reverse transcriptase inhibitor; CI, confidence interval; NNRTI, non-nucleoside reverse transcriptase inhibitor; PI, protease inhibitor.
Threshold for statistical significance (P < 0.05, not adjusted for multiple comparisons).
Composite Treatment Failure Analysis (Primary Endpoint)
The median follow-up time for the primary analysis was 587 days (IQR: 261–730 days). The association of baseline characteristics with time to treatment failure in univariate Cox proportional hazards modeling is shown in Table 1. There was a strong association of treatment failure with variables that could be surrogates for ART adherence, including ≥1 missed clinic visits in the prior year, prior virologic failure, and poor adherence to ART as documented in the medical record. A baseline CD4 cell count <200 cells/mm3, platelet count ≤200,000 cells/mm3, and absolute neutrophil count <1000 cells/mm3 were also associated with ART treatment failure. In contrast, a baseline regimen composed of nucleosides and nonnucleosides was the only characteristic associated with a lower risk of treatment failure.
Using stepwise selection, a final multivariate model adjusted for age, race, and gender was developed. Baseline characteristics significant in the multivariate model (Table 2) included poor adherence to antiretrovirals (HR = 3.44; P < 0.0001), absolute neutrophil count <1000 cells/mm3 (HR = 2.90; P = 0.013), not having virologic suppression on or before January 1, 2003 (HR = 2.69;P < 0.0001), virologic suppression for <12 months (HR = 1.64; P = 0.015), baseline CD4 count <200 cells/mm3 (HR = 1.90; P = 0.0007), a regimen composed only of nucleoside reverse transcriptase inhibitors (NRTIs; HR = 1.75; P = 0.022), prior virologic failure (HR = 1.70; P = 0.0019), and ≥1 prior missed clinic visits (HR = 1.56; P = 0.0072). A positive HCV antibody test was also selected in the final model but did not reach statistical significance (P = 0.059).
TABLE 2.
Multivariate Proportional Hazards Model for Treatment Outcomes Among an Urban HIV Clinic Cohort: January 1, 2003, Through December 31, 2004
| Treatment Failure (n = 167)
|
Virologic Failure (n = 108)
|
|||||
|---|---|---|---|---|---|---|
| Baseline Variables | HR | 95% CI | P | HR | 95% CI | P |
| Age <40 years | 1.17 | (0.85 to 1.62) | 0.33 | 1.10 | (0.74 to 1.63) | 0.65 |
| Male | 1.18 | (0.79 to 1.76) | 0.43 | 1.13 | (0.69 to 1.87) | 0.62 |
| Nonwhite race | 1.14 | (0.83 to 1.57) | 0.41 | 1.17 | (0.79 to 1.73) | 0.43 |
| Poor adherence | 3.44 | (2.34 to 5.05) | <0.0001 | 3.62 | (2.27 to 5.79) | <0.0001 |
| Prior virologic failure | 1.70 | (1.22 to 2.39) | 0.0019 | 2.08 | (1.38 to 3.13) | 0.0004 |
| Not suppressed as of January 1, 2003 | 2.69 | (1.78 to 4.07) | <0.0001 | 2.10 | (1.26 to 3.51) | 0.0047 |
| <12 months of suppression | 1.64 | (1.10 to 2.45) | 0.015 | 1.57 | (0.94 to 2.63) | 0.083 |
| ANC at baseline <1000 cells/mm3 | 2.90 | (1.26 to 6.69) | 0.013 | 3.41 | (1.35 to 8.61) | 0.0096 |
| CD4 count at baseline <200 cells/mm3 | 1.90 | (1.31 to 2.76) | 0.0007 | 1.82 | (1.15 to 2.87) | 0.010 |
| Regimen: NRTI only | 1.75 | (1.08 to 2.82) | 0.022 | — | — | — |
| Regimen: NRTI and NNRTI | — | — | — | 0.64 | (0.41 to 1.00) | 0.052 |
| Prior missed visits (≥1 in prior year) | 1.56 | (1.13 to 2.16) | 0.0072 | — | — | — |
| HCV antibody positive | 1.44 | (0.99 to 2.09) | 0.059 | 1.66 | (1.06 to 2.60) | 0.028 |
| Prior NRTI | — | — | — | 0.38 | (0.14 to 1.07) | 0.068 |
ANC indicates absolute neutrophil count; ART antiretroviral therapy; CI confidence interval; NRTI, nucleoside reverse transcriptase inhibitor; NNRTI, non-nucleoside reverse transcriptase inhibitor; PI, protease inhibitor.
Threshold for statistical significance (P < 0.05, not adjusted for multiple comparisons).
Virologic Failure Criteria Alone
To compare this study with others, a secondary analysis using only virologic failure criteria was performed. A total of 160 patients experienced at least 1 episode of virologic failure (HIV RNA load >400 copies/mm3) during the 2-year study. Of these, 28 experienced transient viral “blips,” single HIV RNA measurements >400 copies/mL followed by a value under this threshold at the next measurement.8 Twenty-four patients stopped ART more than 2 weeks before losing virologic suppression and were not considered virologic failures. The remaining 108 patients (17.6% of the suppressed cohort) had a repeat HIV RNA measurement >400 copies/mL or were lost to follow-up after their initial failure; these patients were considered to have reached virologic failure. The median follow-up period for this analysis was 623 days (IQR: 292–730 days). With this criterion, patients who stopped ART or were transiently lost to clinic follow-up but later resumed care and then experienced confirmed virologic failure were included as endpoints. Baseline patient characteristics associated with the endpoint of virologic failure were similar to those in the primary analysis, except that <12 months of virologic suppression, an NRTI-only regimen, and ≥1 missed visit in the prior year were not significant in the final multivariate model, whereas a positive HCV antibody was (see Table 2). The multivariate models for treatment failure and virologic failure seemed to be robust, because different selection criteria resulted in similar results.
Adherence to Antiretrovirals
Fifty-eight patients, 9.4% of the suppressed cohort, were categorized as being poorly adherent to antiretrovirals before or at study entry. Forty of these patients (69%) developed treatment failure during the study follow-up, accounting for 24% of all treatment failures. Patients documented as having poor adherence were significantly more likely (P < 0.0001) to experience failure, as defined by either criteria, than patients with good adherence in the univariate and adjusted multivariate models (Fig. 2).
FIGURE 2.
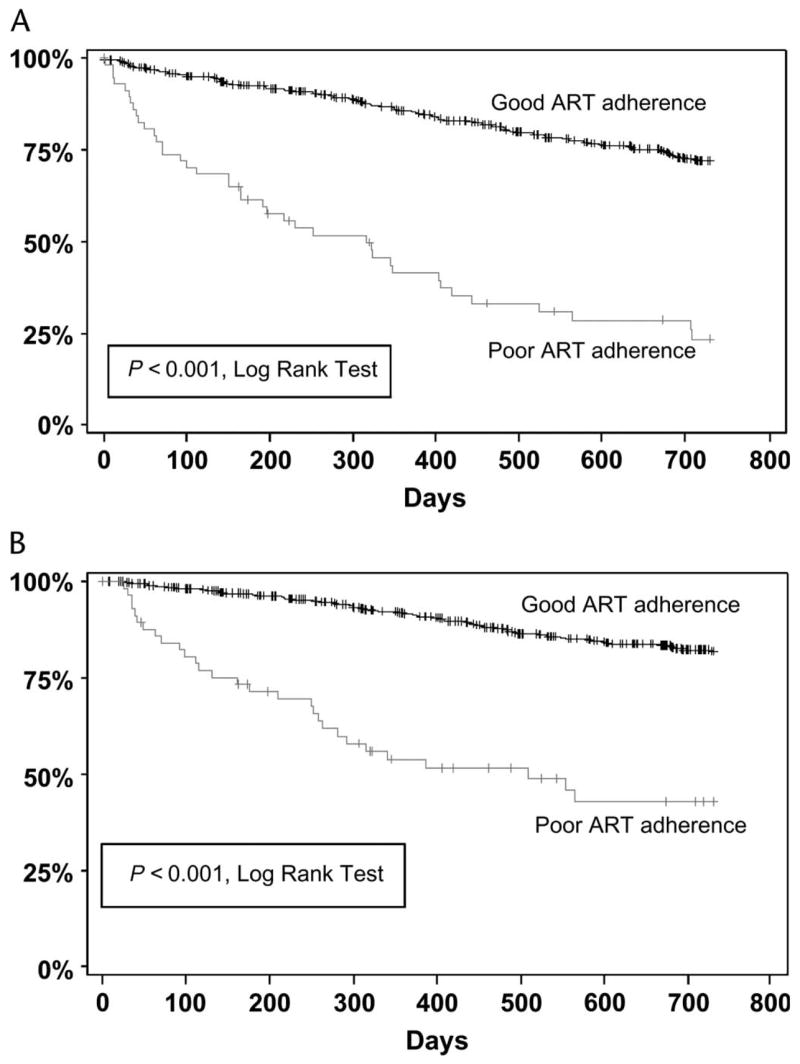
Survival curves for time to treatment failure (A) and virologic failure (B). The vertical axis is the percentage of patients not yet having met the endpoint, and the horizontal axis is time in days. Patients whose adherence was classified as “poor” were significantly more likely to fail than those whose adherence was classified as “good.”
DISCUSSION
We analyzed data from the EHR for patients followed in an urban HIV clinic to understand predictors of ART failure. During a 2-year period, slightly more than a quarter of patients failed their ART, 17.6% by virologic criteria alone. The concurrent analysis, observing all suppressed clinic patients over the same time interval, identified 6 to 8 baseline patient characteristics associated with ART treatment failure. These results seemed to be robust, because the predictors were similar using the composite treatment failure endpoint or virologic failure alone as a criterion and included known risk factors. Other important risk factors were also identified, however, including an absolute neutrophil count <1000 cells/mm3, duration of virologic suppression, prior missed clinic visits, and documentation of prior adherence to ART. This analysis advances knowledge obtained from prior time-adjusted analyses,2,33,34 showing that in a concurrent analysis of a heterogeneous clinical cohort under usual care, a variety of potentially actionable clinical characteristics identify HIV-positive patients at increased risk of treatment failure. Identification of these predictors of treatment failure using the EHR offers the potential to use subsequent disease management interventions to improve outcomes of ART.35,36
Similar to other reports, prior virologic failure, a regimen consisting only of NRTIs, and a lower CD4 cell count were significant predictors of ART failure. In this study, however, a lower CD4 cell count at the beginning of the observation period rather than a low nadir CD4 cell count was associated with increased risk of failure over the following 2 years. The duration of suppression was also correlated with risk of failure. The risk was highest in patients who had only recently achieved virologic suppression but continued for the first 12 months of virologic suppression. The “most recent” CD4 cell count and duration of virologics uppression have both been reported to be independent predictors for loss of virologic suppression in the EuroSIDA cohort in a time-adjusted multivariate analysis.30 A novel predictor, absolute neutrophil count <1000 cells/mm3, was also highly significant for both endpoints and may reflect drug toxicity or concomitant illness.
Whether HCV adversely affects HIV treatment outcomes remains controversial. Analyses of large cohorts have failed to show significant responses to ART among HIV/HCV-coinfected patients,37,38 whereas others have reported poorer treatment outcomes.39–42 In this study, HCV seropositivity was associated with a higher risk for treatment failure, although in the final multivariate model, it was only marginally significant. HCV status was also strongly associated with virologic failure in univariate and multivariate models, suggesting that this should be considered a risk factor for poorer ART outcomes.
One of the notable findings in this study was the highly significant association with failure endpoints and documented patient adherence to ART in the EHR. Although adherence has been demonstrated to be important for clinical cohorts and trial participants, most studies have relied on pill counts, electronic measuring devices, or patient self-reported adherence questionnaires.2,13,18,43–45 Without these validated instruments, clinicians have generally been shown to be poor estimators of patient adherence.13,16,17 This study raises the possibility that HIV providers may have become more astute in their assessment of patient adherence over time. This speculation is further supported by the fact that adherence was documented in more than 90% of patient records in the visits just before or at study entry. Patients without a description of their adherence tended to be new patients to the clinic or individuals who had been doing well on the same regimen for an extended period.
Another important predictor of ART failure in these analyses was 1 or more missed clinic visits in the prior year; this could be another surrogate for medication adherence. Lucas et al2 previously demonstrated that missed clinic visits during the observation period correlated with worse treatment outcomes in a cohort of primarily nonwhite patients. The current study differed in that prior missed visits reflected baseline characteristics. In contrast, in the analysis by Lucas et al,2 missed visits during the observation period were included. Poor adherence and missed visits may reflect patient characteristics that are relatively stable over time, and therefore amenable to disease management interventions. 46–49
Several NRTI-only regimens have been shown to have higher failure rates than currently preferred ART regimens,5,50 and in this analysis, patients on NRTI-only regimens had nearly twice the risk of treatment failure over the 2-year follow-up period. Rates of failure were also higher for virologic failure but were not significant in the adjusted multivariate proportional hazards model, possibly attributable, in part, to the smaller sample size. It may also be that NRTI-only regimens were selected for patients at higher risk of nonadherence to medications and/or clinic visits, which is included in the composite treatment failure endpoint.
Although demographic characteristics have been shown to be important predictors of treatment outcome in other analyses, they were not significant in this study, suggesting that other collinear factors may be responsible for lower treatment success associated with certain demographic groups of patients.
This analysis has several limitations. First, although more reliable than paper charts, EHR data are not as complete and may be less accurate than clinical trial or research databases. Although we did perform partial validation of the data, including confirmation of all treatment failures, it was not feasible to verify all clinical data included in this analysis. Despite this limitation, this study suggests that EHR data collected as part of routine care can be used to identify patients at increased risk of failing their antiretroviral regimens over a 2 -year period. Second, HCV antibody positivity demonstrates prior exposure rather than active HCV infection; therefore, the observed association between HCV antibody and virologic failure could reflect collinear patient characteristics rather than increased failure as a result of HCV coinfection. Third, assessing and documenting patient adherence to ART was not standardized; however, this reflects usual clinical practice and was the strongest predictor for both failure analyses. Finally, because this study was limited to a single cohort, these findings should be confirmed in other clinical settings.
In summary, this analysis of a heterogeneous cohort of HIV-infected patients under usual clinical care showed that predictors of ART failure can be identified using data routinely captured in the EHR. Analyzing cohorts concurrently using EHR data rather than time-adjusted approaches seems to be robust to various definitions of treatment failure and lends itself more readily to population management, prospective monitoring, and targeted treatment interventions. Such interventions might include physician computer alerts and adherence interventions. 35,36 Contrary to previous reports, providers’ documentation of patients’ adherence was a powerful predictor for both failure endpoints. The idea that HIV providers are unable to assess adherence accurately may no longer be true, although standardized adherence assessment may be even more useful. Other important baseline predictors of ART failure in this study included missed clinic visits in the prior year, a low absolute neutrophil count, and a low CD4 count. The approach we took in this study offers the potential for risk-stratifying entire clinical cohorts using routine care data in the EHR and then selecting high-risk patients for targeted disease management interventions to improve outcomes of ART.
Acknowledgments
The authors thank Greg Estey and the Laboratory of Computer Science for development of the HIV-specific EHR; Alice Cort, MD, Jo Ann David-Kasdan, RN, Sonia Ehrlich, MD, and Jon Gothing, RN, for performing chart extractions; and the MGH HIV Clinic patients and staff.
Supported by National Institute of Allergy and Infectious Diseases grants K01AI062435, K24AI062476, and P30AI60354 and by the Massachusetts General Hospital Clinical Research Program.
APPENDIX
Definitions for patient baseline characteristics in a study of patients followed in an urban HIV clinic with virologic suppression on ART are provided in Table 3.
TABLE 3.
Definitions for Patient Baseline Characteristics in a Study of Patients Followed in an Urban HIV Clinic With Virologic Suppression on ART
| Baseline Characteristics | Definition |
|---|---|
| Study entry date | January 1, 2003 for suppressed patients or date of first HIV RNA measurement ≤400 copies/mL |
| Time since HIV diagnosis | Known or estimated time of HIV diagnosis to study entry |
| Transferred care | Whether patients previously received care at another HIV clinic |
| Baseline regimen | Regimen at the time of study entry |
| Time on baseline regimen | From start of baseline regimen to study entry; in case of staggered ART start, time measured from when the last drug was added |
| Baseline CD4 cell count | CD4 cell count at study entry or nearest known value |
| Nadir CD4 cell count | Lowest CD4 cell count at or before study entry |
| Suppressed as of January 1, 2003 | Whether subjects were known to have had a HIV RNA measurement ≤400 copies/mL on or before January 1, 2003 |
| <12 months of suppression | Whether patients were known to have had more than 12 months of suppression before study entry |
| ANC < 1000 cells/mm3 | Absolute neutrophil count <1000 cells/mm3 at study entry |
| Prior missed visit (≥1 in prior year) | Whether patients missed one or more clinic visits prior to study entry |
|
| |
| Baseline ART Regimen | Definition |
|
| |
| NRTI | A regimen containing one or more NRTIs |
| NNRTI | A regimen containing one or more NNRTIs |
| PI | A regimen containing one or more PIs |
| HCV antibody status | Positive or negative |
| Missed visit | ≥1 missed appointment in the year before study entry |
|
| |
| Prior ART Use | Definition |
|
| |
| Number of prior regimens | Naive (0), 1, 2, or ≥3 regimens; a regimen was considered to be new if 2 or more antiretrovirals in at least 2 classes had been changed |
| Prior NRTI | >7 days of prior NRTI |
| Prior NNRTI | >7 days of prior NNRTI |
| Prior PI | >7 days of prior PI |
| Prior NRTI and NNRTI | >7 days of concurrent NRTI and NNRTI |
| Prior NRTI and PI | >7 days of concurrent NRTI and PI |
| Prior NRTI, NNRTI, and PI | >7 days of concurrent NRTI, NNRTI, and PI |
ANC indicates absolute neutrophil count; ART, antiretroviral therapy; NRTI, nucleoside reverse transcriptase inhibitor; NNRTI, non-nucleoside reverse transcriptase inhibitor; PI, protease inhibitor.
References
- 1.Palella FJ, Jr, Delaney KM, Moorman AC, et al. Declining morbidity and mortality among patients with advanced human immunodeficiency virus infection. HIV Outpatient Study Investigators. N Engl J Med. 1998;338:853–860. doi: 10.1056/NEJM199803263381301. [DOI] [PubMed] [Google Scholar]
- 2.Lucas GM, Chaisson RE, Moore RD. Highly active antiretroviral therapy in a large urban clinic: risk factors for virologic failure and adverse drug reactions. Ann Intern Med. 1999;131:81–87. doi: 10.7326/0003-4819-131-2-199907200-00002. [DOI] [PubMed] [Google Scholar]
- 3.Zaccarelli M, Tozzi V, Lorenzini P, et al. Multiple drug class-wide resistance associated with poorer survival after treatment failure in a cohort of HIV-infected patients. AIDS. 2005;19:1081–1089. doi: 10.1097/01.aids.0000174455.01369.ad. [DOI] [PubMed] [Google Scholar]
- 4.Ledergerber B, Lundgren JD, Walker AS, et al. Predictors of trend in CD4-positive T-cell count and mortality among HIV-1-infected individuals with virological failure to all three antiretroviral-drug classes. Lancet. 2004;364:51–62. doi: 10.1016/S0140-6736(04)16589-6. [DOI] [PubMed] [Google Scholar]
- 5.Bartlett JG, Lane LH, et al. Guidelines for the use of antiretroviral agents in HIV-1-infected adults and adolescentsAvailable at: http//:www.actis.orgAccessed July 10, 2006 [PubMed]
- 6.Powderly WG, Saag MS, Chapman S, et al. Predictors of optimal virological response to potent antiretroviral therapy. AIDS. 1999;13:1873–1880. doi: 10.1097/00002030-199910010-00009. [DOI] [PubMed] [Google Scholar]
- 7.Demeter LM, Hughes MD, Coombs RW, et al. Predictors of virologic and clinical outcomes in HIV-1-infected patients receiving concurrent treatment with indinavir, zidovudine, and lamivudine. AIDS Clinical Trials Group Protocol 320. Ann Intern Med. 2001;135:954–964. doi: 10.7326/0003-4819-135-11-200112040-00007. [DOI] [PubMed] [Google Scholar]
- 8.Havlir DV, Bassett R, Levitan D, et al. Prevalence and predictive value of intermittent viremia with combination HIV therapy. JAMA. 2001;286:171–179. doi: 10.1001/jama.286.2.171. [DOI] [PubMed] [Google Scholar]
- 9.Lundgren JD, Mocroft A, Gatell JM, et al. A clinically prognostic scoring system for patients receiving highly active antiretroviral therapy: results from the EuroSIDA study. J Infect Dis. 2002;185:178–187. doi: 10.1086/338267. [DOI] [PubMed] [Google Scholar]
- 10.Deeks SG, Hecht FM, Swanson M, et al. HIV RNA and CD4 cell count response to protease inhibitor therapy in an urban AIDS clinic: response to both initial and salvage therapy. AIDS. 1999;13:35–43. doi: 10.1097/00002030-199904160-00001. [DOI] [PubMed] [Google Scholar]
- 11.Gross R, Bilker WB, Friedman HM, et al. Effect of adherence to newly initiated antiretroviral therapy on plasma viral load. AIDS. 2001;15:2109–2117. doi: 10.1097/00002030-200111090-00006. [DOI] [PubMed] [Google Scholar]
- 12.Gifford AL, Bormann JE, Shively MJ, et al. Predictors of self-reported adherence and plasma HIV concentrations in patients on multidrug antiretroviral regimens. J Acquir Immune Defic Syndr. 2000;23:386–395. doi: 10.1097/00126334-200004150-00005. [DOI] [PubMed] [Google Scholar]
- 13.Patterson DL, Swindells S, Mohr J, et al. Adherence to protease inhibitor therapy and outcomes in patients with HIV infection. Ann Intern Med. 2000;133:21–30. doi: 10.7326/0003-4819-133-1-200007040-00004. [DOI] [PubMed] [Google Scholar]
- 14.Bangsberg DR, Hecht FM, Clague H, et al. Provider assessment of adherence to HIV antiretroviral therapy. J Acquir Immune Defic Syndr. 2001;26:435–442. doi: 10.1097/00126334-200104150-00005. [DOI] [PubMed] [Google Scholar]
- 15.Haubrich RH, Little SJ, Currier JS, et al. The value of patient-reported adherence to antiretroviral therapy in predicting virologic and immunologic response. California Collaborative Treatment Group. AIDS. 1999;13:1099–1107. doi: 10.1097/00002030-199906180-00014. [DOI] [PubMed] [Google Scholar]
- 16.Gross R, Bilker WB, Friedman HM, et al. Provider inaccuracy in assessing adherence and outcomes with newly initiated antiretroviral therapy. AIDS. 2002;16:1835–1837. doi: 10.1097/00002030-200209060-00021. [DOI] [PubMed] [Google Scholar]
- 17.Osterberg L, Blaschke T. Adherence to medication. N Engl J Med. 2005;353:487–497. doi: 10.1056/NEJMra050100. [DOI] [PubMed] [Google Scholar]
- 18.Lucas GM, Chaisson RE, Moore RD. Survival in an urban HIV-1 clinic in the era of highly active antiretroviral therapy: a 5-year cohort study. J Acquir Immune Defic Syndr. 2003;33:321–328. doi: 10.1097/00126334-200307010-00005. [DOI] [PubMed] [Google Scholar]
- 19.Lucas GM, Chaisson RE, Moore RD. Comparison of initial combination antiretroviral therapy with a single protease inhibitor, ritonavir and saquinavir, or efavirenz. AIDS. 2001;15:1679–1686. doi: 10.1097/00002030-200109070-00011. [DOI] [PubMed] [Google Scholar]
- 20.Egger M, May M, Chene G, et al. Prognosis of HIV-1-infected patients starting highly active antiretroviral therapy: a collaborative analysis of prospective studies. Lancet. 2002;360:119–129. doi: 10.1016/s0140-6736(02)09411-4. [DOI] [PubMed] [Google Scholar]
- 21.Palella FJ, Jr, Deloria-Knoll M, Chmiel JS, et al. Survival benefit of initiating antiretroviral therapy in HIV-infected persons in different CD4+ cell strata. Ann Intern Med. 2003;138:620–626. doi: 10.7326/0003-4819-138-8-200304150-00007. [DOI] [PubMed] [Google Scholar]
- 22.Knobel H, Guelar A, Carmona A, et al. Virologic outcome and predictors of virologic failure of highly active antiretroviral therapy containing protease inhibitors. AIDS Patient Care STDS. 2001;15:193–199. doi: 10.1089/10872910151133729. [DOI] [PubMed] [Google Scholar]
- 23.Le Moing V, Chene G, Carrieri MP, et al. Clinical, biologic, and behavioral predictors of early immunologic and virologic response in HIV-infected patients initiating protease inhibitors. J Acquir Immune Defic Syndr. 2001;27:372–376. doi: 10.1097/00126334-200108010-00007. [DOI] [PubMed] [Google Scholar]
- 24.Mocroft A, Gill MJ, Davidson W, et al. Predictors of a viral response and subsequent virological treatment failure in patients with HIV starting a protease inhibitor. AIDS. 1998;12:2161–2167. doi: 10.1097/00002030-199816000-00011. [DOI] [PubMed] [Google Scholar]
- 25.Paredes R, Mocroft A, Kirk O, et al. Predictors of virological success and ensuing failure in HIV-positive patients starting highly active antiretroviral therapy in Europe: results from the EuroSIDA study. Arch Intern Med. 2000;160:1123–1132. doi: 10.1001/archinte.160.8.1123. [DOI] [PubMed] [Google Scholar]
- 26.Paris D, Ledergerber B, Weber R, et al. Incidence and predictors of virologic failure of antiretroviral triple-drug therapy in a community-based cohort. AIDS Res Hum Retroviruses. 1999;15:1631–1638. doi: 10.1089/088922299309676. [DOI] [PubMed] [Google Scholar]
- 27.Mocroft A, Miller V, Chiesi A, et al. Virological failure among patients on HAART from across Europe: results from the EuroSIDA study. Antivir Ther. 2000;5:107–112. [PubMed] [Google Scholar]
- 28.Easterbrook PJ, Newson R, Ives N, et al. Comparison of virologic, immunologic, and clinical response to five different initial protease inhibitor–containing and nevirapine-containing regimens. J Acquir Immune Defic Syndr. 2001;27:350–364. doi: 10.1097/00126334-200108010-00005. [DOI] [PubMed] [Google Scholar]
- 29.Palella FJ, Chmiel JS, Moorman AC, et al. Durability and predictors of success of highly active antiretroviral therapy for ambulatory HIV-infected patients. AIDS. 2002;16:1617–1626. doi: 10.1097/00002030-200208160-00007. [DOI] [PubMed] [Google Scholar]
- 30.Mocroft A, Ruiz L, Reiss P, et al. Virological rebound after suppression on highly active antiretroviral therapy. AIDS. 2003;17:1741–1751. doi: 10.1097/00002030-200308150-00003. [DOI] [PubMed] [Google Scholar]
- 31.Mocroft A, Ledergerber B, Viard JP, et al. Time to virological failure of 3 classes of antiretrovirals after initiation of highly active antiretroviral therapy: results from the EuroSIDA study group. J Infect Dis. 2004;190:1947–1956. doi: 10.1086/425424. [DOI] [PubMed] [Google Scholar]
- 32.Nicastri E, Chiesi A, Angeletti C, et al. Clinical outcome after 4 years follow-up of HIV-seropositive subjects with incomplete virologic or immunologic response to HAART. J Med Virol. 2005;76:153–160. doi: 10.1002/jmv.20352. [DOI] [PubMed] [Google Scholar]
- 33.Valdez H, Lederman MM, Woolley I, et al. Human immunodeficiency virus 1 protease inhibitors in clinical practice: predictors of virological outcome. Arch Intern Med. 1999;159:1771–1776. doi: 10.1001/archinte.159.15.1771. [DOI] [PubMed] [Google Scholar]
- 34.Rastegar DA, Fingerhood MI, Jasinski DR. Highly active antiretroviral therapy outcomes in a primary care clinic. AIDS Care. 2003;15:231–237. doi: 10.1080/0954012031000068371. [DOI] [PubMed] [Google Scholar]
- 35.Chaudhry B, Wang J, Wu S, et al. Systematic review: impact of health information technology on quality, efficiency, and costs of medical care. Ann Intern Med. 2006;144:742–752. doi: 10.7326/0003-4819-144-10-200605160-00125. [DOI] [PubMed] [Google Scholar]
- 36.Halamka JD. Health information technology: shall we wait for the evidence? Ann Intern Med. 2006;144:775–776. doi: 10.7326/0003-4819-144-10-200605160-00013. [DOI] [PubMed] [Google Scholar]
- 37.Rockstroh JK, Mocroft A, Soriano V, et al. Influence of hepatitis C virus infection on HIV-1 disease progression and response to highly active antiretroviral therapy. J Infect Dis. 2005;192:992–1002. doi: 10.1086/432762. [DOI] [PubMed] [Google Scholar]
- 38.Lincoln D, Petoumenos K, Dore GJ. Australian HIVOD. HIV/HBV and HIV/HCV coinfection, and outcomes following highly active antiretro-viral therapy. HIV Med. 2003;4:241–249. doi: 10.1046/j.1468-1293.2003.00152.x. [DOI] [PubMed] [Google Scholar]
- 39.De Luca A, Bugarini R, Lepri AC, et al. Coinfection with hepatitis viruses and outcome of initial antiretroviral regimens in previously naive HIV-infected subjects. Arch Intern Med. 2002;162:2125–2132. doi: 10.1001/archinte.162.18.2125. [DOI] [PubMed] [Google Scholar]
- 40.Greub G, Ledergerber B, Battegay M, et al. Clinical progression, survival, and immune recovery during antiretroviral therapy in patients with HIV-1 and hepatitis C virus coinfection: the Swiss HIV Cohort Study. Lancet. 2000;356:1800–1805. doi: 10.1016/s0140-6736(00)03232-3. [DOI] [PubMed] [Google Scholar]
- 41.Sulkowski MS, Thomas DL, Mehta SH, et al. Hepatotoxicity associated with nevirapine or efavirenz-containing antiretroviral therapy: role of hepatitis C and B infections. Hepatology. 2002;35:182–189. doi: 10.1053/jhep.2002.30319. [DOI] [PubMed] [Google Scholar]
- 42.Sulkowski MS, Thomas DL, Chaisson RE, et al. Hepatotoxicity associated with antiretroviral therapy in adults infected with human immunodeficiency virus and the role of hepatitis C or B virus infection. JAMA. 2000;283:74–80. doi: 10.1001/jama.283.1.74. [DOI] [PubMed] [Google Scholar]
- 43.Chesney M, Carrieri P, Gallais H, et al. Limited patient adherence to highly active antiretroviral therapy for HIV-1 infection in an observational cohort study. J Acquir Immune Defic Syndr. 2002;31(Suppl):S149–S153. [Google Scholar]
- 44.Chesney MA, Ickovics JR, Chambers DB, et al. Self-reported adherence to antiretroviral medications among participants in HIV clinical trials: the AACTG adherence instruments. Patient Care Committee and Adherence Working Group of the Outcomes Committee of the Adult AIDS Clinical Trials Group (AACTG) AIDS Care. 2000;12:255–266. doi: 10.1080/09540120050042891. [DOI] [PubMed] [Google Scholar]
- 45.Reynolds NR, Testa MA, Marc LG, et al. Factors influencing medication adherence beliefs and self-efficacy in persons naive to antiretroviral therapy: a multicenter, cross-sectional study. AIDS Behav. 2004;8:141–150. doi: 10.1023/B:AIBE.0000030245.52406.bb. [DOI] [PubMed] [Google Scholar]
- 46.Landon BE, Wilson IB, McInnes K, et al. Effects of a quality improvement collaborative on the outcome of care of patients with HIV infection: the EQHIV study. Ann Intern Med. 2004;140:887–896. doi: 10.7326/0003-4819-140-11-200406010-00010. [DOI] [PubMed] [Google Scholar]
- 47.Grant RW, Cagliero E, Sullivan CM, et al. A controlled trial of population management: diabetes mellitus: putting evidence into practice (DM-PEP) Diabetes Care. 2004;27:2299–2305. doi: 10.2337/diacare.27.10.2299. [DOI] [PubMed] [Google Scholar]
- 48.Macharia WM, Leon G, Rowe BH, et al. An overview of interventions to improve compliance with appointment keeping for medical services. JAMA. 1992;267:1813–1817. [PubMed] [Google Scholar]
- 49.Goldie SJ, Paltiel AD, Weinstein MC, et al. Projecting the cost-effectiveness of adherence interventions in persons with human immunodeficiency virus infection. Am J Med. 2003;115:632–641. doi: 10.1016/j.amjmed.2003.07.007. [DOI] [PubMed] [Google Scholar]
- 50.Gulick RM, Ribaudo HJ, Shikuma CM, et al. Triple-nucleoside regimens versus efavirenz-containing regimens for the initial treatment of HIV-1 infection. N Engl J Med. 2004;350:1850–1861. doi: 10.1056/NEJMoa031772. [DOI] [PubMed] [Google Scholar]