

Abstract
Background
India has more than 5.7 million people infected with human immunodeficiency virus (HIV). In 2004, the Indian government began providing antiretroviral therapy (ART), and there are now an estimated 56 500 people receiving ART.
Objective
To project the life expectancy, cost, and cost-effectiveness associated with different strategies for using ART in India, to inform treatment programs.
Methods
We utilized an HIV disease simulation model, incorporating data on natural history, treatment efficacy, and costs of care from India. Input parameters for the simulated cohort included mean age 32.6 years and mean CD4 count 318 cells/μl (SD 291 cells/μl). We examined different criteria for starting and stopping ART with a first-line regimen of stavudine/lamivudine/nevirapine, and the impact of a second-line protease-inhibitor-based regimen. Cost-effectiveness in US dollars per year of life saved (US$/YLS) was compared incrementally among alternative starting, sequencing, and stopping criteria.
Results
Discounted (undiscounted) mean survival ranged from 34.5 (37.5) months with no ART to 64.7 (73.6) months with one line of therapy initiated at CD4 < 350 cells/μl, to 88.9 (106.5) months with two lines of therapy initiated at CD4 < 350 cells/μl. Lifetime medical costs ranged from US$530 (no ART) to US$5430 (two ART regimens) per person. With one line of therapy, the incremental cost-effectiveness ratios ranged from US$430/YLS to US$550/YLS as the CD4 starting criterion was increased from CD4 < 250 cells/μl to < 350 cells/μl. Use of two lines of therapy had an incremental cost-effectiveness ratio of US$1880/YLS compared with the use of first-line therapy alone. Results were sensitive to the costs of second-line therapy and criteria for stopping therapy.
Conclusions
In India, antiretroviral therapy will lead to major survival benefits and is cost-effective by World Health Organization criteria. The availability of second-line regimens will further increase survival, but their cost-effectiveness depends on their relative cost compared with first-line regimens.
Keywords: antiretroviral therapy, HIV/AIDS, India
Introduction
There are an estimated 5.7 million people in India who are infected with human immunodeficiency virus (HIV); of these, approximately 785 000 are in need of antiretroviral therapy (ART) [1,2]. The availability of generic ART in India since the year 2000 has reduced the price of first-line drugs to less than US$1 per day and significantly increased access to treatment [3]. In 2004, the government of India began providing ART free to patients as part of its National AIDS Control Program, with the objective of starting 100 000 people on treatment by 2007 [1]. By the beginning of 2007, approximately 56 500 people were receiving ART through the government program and 10 000–20 000 were receiving ART through other sources [4]. The government now aims to provide ART to 300 000 adults and 40 000 children over the next 5 years as part of the next phase of the National AIDS Control Program [4].
As the government and private sector continue to develop HIV treatment programs in India, evidence on optimal strategies for initiation and stopping ART might help inform treatment guidelines. The government of India National AIDS Control Organization (NACO), the Association of Physicians of India, and the World Health Organization (WHO) guidelines recommend starting ART in patients with CD4 counts less than 200 cells/μl and considering ART in patients with CD4 counts between 200 and 350 cells/μl [5–7]. The optimal timing of initiation of ART between CD4 counts of 200 and 350 cells/μl, and the importance of opportunistic infections in that policy, remain to be determined. Further, as second-line ART has a greater role in the management of HIV infection, the need for evidence to inform the criteria for sequencing and stopping ART is becoming critical. This analysis examines the clinical impact and costs associated with different strategies for starting and stopping treatment, in addition to the cost-effectiveness of both first- and second-line ART.
Methods
Analytic overview
We utilized an international simulation model of HIV disease that incorporates data on natural history, treatment efficacy, and costs of care from India. We projected both the life expectancy and the cost-effectiveness associated with one effective ART regimen (‘first-line’), and the incremental cost-effectiveness of switching to a second regimen (‘second-line’) after a diagnosis of failure of the initial regimen.
Model outputs included projected undiscounted life expectancy, discounted life expectancy, and discounted lifetime direct costs. All costs are reported in 2005 US dollars (US$). Costs and life years were discounted at a rate of 3% per year [8]. The comparative value of alternative strategies for starting ARTwas evaluated using cost-effectiveness ratios in which the cost and clinical benefit associated with each strategy were compared incrementally with those of the next less expensive strategy within an appropriate comparison set [8]. Cost-effectiveness results are reported in 2005 US$ per year of life saved (YLS).
The Cost-Effectiveness of Preventing AIDS Complications International Model
The Cost-Effectiveness of Preventing AIDS Complications (CEPAC) International model is a previously published, state-transition model of HIV disease [9,10]. The model simulates disease progression in a hypothetical cohort of HIV-infected patients and tracks outcomes on a monthly basis. Patients move between three main health states – chronic disease, acute event, and death –with the intention of capturing the frequency of both clinical events and resource use. Patients enter the model in the chronic state and may experience decreases or increases in CD4 cell count, depending on the availability of effective ART. Patients enter a temporary acute state when an opportunistic infection or drug-related toxicity occurs. Death as a result of HIV disease or other causes can occur from either a chronic or acute state.
In the absence of effective ART, the level of HIV RNA determines the rate of decrease in CD4 cell count [11]. Disease progression is characterized by decreases in CD4 cell count, and CD4 cell count determines the incidence of opportunistic infections and mortality resulting from HIV disease. ART that effectively suppresses HIV RNA generally results in both an increase in CD4 cell count at rates reported in clinical trials and a decrease in the incidence of opportunistic infections and mortality that is independent of changes in CD4 cell count [7,12–15]. Co-trimoxazole prophylaxis is initiated at CD4 cell counts less than 200 cells/μl or at the occurrence of any opportunistic infection [16,17]; its use decreases the incidence of bacterial infections and Pneumocystis jiroveci pneumonia, but increases the rates of mild fungal infections [18]. Prophylaxis is included with all ART strategies and, once started, co-trimoxazole prophylaxis is stopped only in the case of major toxicity.
Simulated patients are followed in the model one at a time, and the model tracks each patient’s clinical progression. After a patient dies, the model tallies clinical events, total life months, and accrued costs, and a new patient enters the model. One million patients are simulated for each treatment strategy, to obtain stable estimates of long-term outcomes per patient. The model is programmed in C and compiled in Visual C + + 6.0 (Microsoft). Additional details regarding the model structure have been described elsewhere [9,10,19].
Simulated strategies
Antiretroviral therapy was initiated on the basis of CD4 cell count or with the occurrence of any severe opportunistic infection (severe bacterial infection, severe fungal infection, tuberculosis, malaria, toxoplasmosis, Pneumocystis jiroveci pneumonia, or any other severe infection), whichever came first. When the criterion was CD4 cell count, ARTwas initiated when a laboratory test detected a CD4 cell count at or below the thresholds of 200, 250, or 350 cells/μl. CD4 cells were measured every 6 months, and opportunistic infections were assumed to be detected during the first month in which they occurred.
Antiretroviral therapy was stopped after it was presumed to ‘fail’ as defined by either a 90% decline from peak CD4 cell count during treatment or upon the occurrence of any severe opportunistic infection that occurred 6 or more months after the initiation of treatment. We included this 6-month lag time for consideration of opportunistic infections as treatment failure in order to avoid discontinuation of ART in the case of immune reconstitution syndromes [20]. In strategies in which two regimens of ARTwere available, a patient was switched to the second regimen at the first of the following two events: (1) after a 50% decline from peak CD4 cell count on the first regimen; (2) upon the occurrence of any severe opportunistic infection 6 or more months after the start of the first regimen.
Baseline estimates for model variables
The simulated cohort consisted of treatment-naive, HIV-infected adults having age, sex, initial CD4 cell count, and HIV RNA levels similar to those of the cohort of 6918 patients who presented for care at the Y.R. Gaitonde Centre for AIDS Research and Education (YRG CARE) in Chennai, India from 1996 to 2005 (Table 1) [21]. Mean age was 32.6 years (SD 8.1 years), 66% of patients were male, and the initial mean CD4 count was 318 cells/μl (SD 291 cells/μl) at the time of presentation.
Table 1.
Selected model input variables: initial cohort.
| Variable | Base case | Reference |
|---|---|---|
| Age (years) | 32.6 ± 8.1 | [21] |
| Men/women (%) | 66/34 | [21] |
| CD4 cell count (cells/μl) | 318 ± 291 | [21] |
| Distribution of initial HIV RNA (copies/ml) | [21] | |
| > 100 000 | 0.352 | |
| 30 001–100 000 | 0.260 | |
| 10 001–30 000 | 0.172 | |
| 3001–10 000 | 0.103 | |
| 501–3000 | 0.022 | |
| 21–500 | 0.062 | |
| 0–20 | 0.029 | |
| Mean monthly CD4 cell decline (cells/μl) | [11,22] | |
| HIV RNA stratum (copies/ml) | ||
| > 30 000 | 6.375 | |
| 10 001–30 000 | 5.400 | |
| 3001–10 000 | 4.600 | |
| 501–3000 | 3.733 | |
| 0–500 | 3.025 | |
Values are mean ± SD or number.
The incidence of opportunistic infections in the absence of ART was derived using incidence density analysis, stratified by CD4 cell count, from patients in the YRG CARE cohort (Table 2) [23].
Table 2.
Selected model variables: incidence of opportunistic infections, stratified by CD4 cell count.
| Base case monthly risk (%)
|
|||||||
|---|---|---|---|---|---|---|---|
| CD4 stratum (cells/μl)
|
|||||||
| Disease | 0–50 | 51–100 | 101–200 | 201–350 | 351–500 | > 500 | Reference |
| Severe | |||||||
| Bacterial | 0.00 | 0.25 | 0.08 | 0.02 | 0.04 | 0.06 | |
| Fungal | 1.73 | 0.66 | 0.08 | 0.08 | 0.00 | 0.00 | |
| Tuberculosis | 5.90 | 5.98 | 2.55 | 1.08 | 0.58 | 0.25 | |
| Malaria | 0.00 | 0.00 | 0.00 | 0.02 | 0.02 | 0.00 | |
| Toxoplasmosis | 0.58 | 0.00 | 0.25 | 0.08 | 0.00 | 0.01 | |
| Pneumocystis jiroveci pneumonia | 1.73 | 0.00 | 0.17 | 0.08 | 0.00 | 0.02 | [23] |
| Other severe | 4.72 | 2.96 | 2.14 | 1.24 | 0.50 | 0.50 | |
| Mild | |||||||
| Bacterial | 0.00 | 0.50 | 0.33 | 0.25 | 0.50 | 0.33 | |
| Fungal | 8.15 | 0.58 | 2.55 | 1.08 | 0.66 | 0.33 | |
| Other mild | 7.07 | 2.63 | 2.63 | 2.39 | 1.24 | 0.66 | |
Because of a lack of detailed data on AIDS-related mortality in India stratified by CD4 cell count, for the derivation of data on mortality (Table 3) we used estimates for opportunistic infection mortality and for the independent effect of ARTon mortality from the placebo arm of ANRS 059 in Côte d’Ivoire [10,13,25]. Non AIDS age- and sex-adjusted mortality estimates were from WHO life tables for India [26].
Table 3.
Selected model variables: chronic mortality.
As there are no published data on the efficacy of co-trimoxazole in India, its efficacy (Table 4) was estimated from the results of ANRS 059, a randomized controlled trial of co-trimoxazole prophylaxis in another resource-limited setting (Abidjan, Côte d’Ivoire), and from US data [18,27]. We used an annual cost of US$9 for co-trimoxazole prophylaxis [28].We estimated the virologic efficacy of ART (Table 5) using published clinical trial data. For the first-line regimen, we included a combination of the non nucleoside reverse transcriptase inhibitor (NNRTI), nevirapine, and the nucleoside reverse transcriptase inhibitors (NRTIs), stavudine and lamivudine, as recommended by the India National AIDS Control Organization and the WHO [5,30]. We projected the efficacy of this regimen to be 55% (HIV RNA < 400 copies/ml) at 48 weeks, with a concomitant mean increase in CD4 count of 132 cells/μl at 24 weeks. This efficacy was based on data from the Therapeutics Research, Education, and AIDS Training in Asia cohort and a previously published calibration of suppression in the model, with a per-person annual cost of US$222 [14,28,29]. In strategies with available options after first-line failure, the second-line regimen consisted of ritonavir-boosted indinavir, and didanosine and lamivudine. The virologic efficacy of this regimen is 65% suppression (HIV RNA < 400 copies/ml) at 48 weeks (mean CD4 count increase of 180 cells/μl at 48 weeks), with a per-person annual cost of US$1435 [15,28]. Adherence reflects the background adherence rate that was in the population from which the efficacy data were derived. In the absence of long-term follow-up data in this setting, we conservatively assumed that a patient could maintain HIV RNA suppression for no more than 10 years on any given regimen. Therefore, for patients in the model who had not yet had virologic failure after 10 years on any specific regimen, we assumed virologic failure at 10 years.
Table 4.
| Infection | Base case reduction in probability of infection (%) |
|---|---|
| Mild bacterial infection | 48.8 |
| Severe bacterial infection | 49.8 |
| Severe malaria | 88.4 |
| Isosporiasis | 81.8 |
| Toxoplasmic encephalitis | 83.2 |
| Pneumocystis jiroveci pneumonia | 97.3 |
| Mild fungal infectionsa | −46.4 |
| Other severe infections | 17.9 |
Table 5.
Selected model variables: efficacy of antiretroviral therapy.
| Variable | Base case efficacy | Reference |
|---|---|---|
| NNRTI-based regimen | ||
| HIV RNA suppression | 73% at 24 weeks | [14,29] |
| 55% at 48 weeks | ||
| CD4 cell increase | 132 cells/μl at 24 weeks | |
| PI-based regimen | ||
| HIV RNA suppression | 78% at 24 weeks | [15] |
| 65% at 48 weeks | ||
| CD4 cell increase | 180 cells/μl at 48 weeks | |
NNRTI, non nucleoside reverse transcriptase inhibitor; PI, protease inhibitor.
Resource utilization was estimated using data from the YRG CARE cohort, updated to include an additional 1913 patients who presented to care at YRG CARE from 2005 to 2006. We calculated the number of inpatient and outpatient days associated with routine chronic care, acute events, and death, stratified by CD4 cell count (Table 6). We multiplied utilization in days for each patient by the respective daily costs of inpatient and outpatient care at YRG CARE, updated to 2005 US$ [31]. The daily costs were derived from an analysis of costs at YRG CARE conducted by Family Health International [31].
Table 6.
Selected model variables: costs.
| Variable | Cost (2005 US$) | Reference |
|---|---|---|
| Annual costs of treatment | ||
| Co-trimoxazole prophylaxis | 9.29 | [28] |
| NNRTI-based antiretroviral therapy | 222.24 | [28] |
| PI-based antiretroviral therapy | 1434.62 | [28] |
| Drug toxicity costs | ||
| Minor drug toxicity | 13.00 | [18,31] |
| Major drug toxicity | 141.47 | [18,31] |
| Cost of CD4 cell count, per test | 9.10 | [28] |
| Severe opportunistic infection treatment costs | ||
| Severe bacterial infection | 80.68 | [21,31] |
| Severe fungal infection | 205.03 | [21,31] |
| Tuberculosis | 110.88 | [21,31] |
| Malaria | 93.84 | [21,31] |
| Toxoplasmosis | 172.56 | [21,31] |
| Pneumocystis jiroveci pneumonia | 141.45 | [21,31] |
| Other severe infection | 105.98 | [21,31] |
| Mild opportunistic infection treatment costs | ||
| Mild bacterial infection | 79.92 | [21,31] |
| Mild fungal infection | 137.05 | [21,31] |
| Other mild infection | 125.85 | [21,31] |
| Costs of chronic care | ||
| CD4 stratum (cells/μl) | ||
| < 50 | 9.90 | [21,31] |
| 51–200 | 3.54 | [21,31] |
| 201–350 | 3.19 | [21,31] |
| 351–500 | 3.32 | [21,31] |
| > 500 | 3.06 | [21,31] |
| Terminal care cost (last month of life) | 10.29 | [21,31] |
| Other unit costs of care | ||
| Clinic visit | 13.00 | [31] |
| Hospital day | 20.21 | [31] |
NNRTI, non nucleoside reverse transcriptase inhibitor; PI, protease inhibitor.
Sensitivity analyses
We completed extensive sensitivity analyses on model variables to determine which had the greatest impact on study results. These included, but were not limited to, starting and stopping criteria for ART, including whether ART was continued after clinical failure, efficacy of co-trimoxazole and first-line ARTregimens, relative efficacy of ART regimens when used as second-line for treatment-experienced patients, baseline distribution of CD4 counts, costs of ART drugs, CD4-specific mortality rates and incidence rates of opportunistic infections, rates of CD4 decline, and utilization and costs of CD4 tests and routine care. Sensitivity analyses were also conducted on all model variables that were not derived from data specific to India.
Incremental cost-effectiveness analysis
We evaluated incremental cost-effectiveness within sets of competing strategies. First, we compared alternative starting rules for ART, assuming no availability of second-line therapy. Next, we evaluated the incremental value of two lines of ART compared with a single line of ART, for each possible starting rule. Thirdly, we evaluated the incremental cost-effectiveness of the full set of strategies, including different starting rules, both with and without available second-line therapy. Finally, we performed several sensitivity analyses, in which we varied the criteria for stopping or switching therapies. We also considered one-line protease-inhibitor-based regimens and two-line strategies that began with a regimen containing a protease inhibitor, followed by a regimen containing an NNRTI [12,13].
Within each set of competing treatment strategies, we followed standard procedures for conducting incremental cost-effectiveness analyses [32]. Incremental cost-effectiveness ratios were calculated by comparing each strategy with the next less costly strategy in the ranked list. Strategies that had a greater incremental cost-effectiveness ratio than the next more costly one were considered ‘weakly’ dominated; they were eliminated from further consideration and incremental ratios for the remaining strategies were recalculated until no remaining strategies were dominated.
In order to place in perspective the potential cost-effectiveness of different strategies for HIV care in India, we compared their cost-effectiveness ratios with the per-person Gross Domestic Product (GDP) in India (US$586 in 2005 US$). The WHO has suggested that, in many countries, health interventions that have an incremental cost-effectiveness ratio less than 3 times the per-person GDP (i.e., less than US$1758) would be considered ‘cost-effective,’ and those less than the GDP itself would be ‘very cost-effective’ [33].
Results
Base case analysis
Patients receiving neither ART nor co-trimoxazole prophylaxis, starting with mean CD4 counts of 318 cells/μl, had a projected discounted life expectancy of 34.5 months (37.5 months undiscounted), and a discounted lifetime cost of US$530 (Table 7). Co-trimoxazole prophylaxis alone increased discounted life expectancy by 0.4 months for an additional discounted cost of US$50. With one line of ART available, co-trimoxazole prophylaxis in combination with stavudine/lamivudine/nevirapine, starting at CD4 < 200 cells/μl, increased discounted life expectancy to 62.4 months (70.8 months undiscounted) at a total discounted lifetime cost of US$1540. Starting ART earlier, at CD4 < 250 cells/μl, increased discounted life expectancy by an additional 1.3 months. This earlier starting strategy weakly dominated the strategy of starting ART at CD4< 200 cells/μl, and its associated increase in life expectancy is achieved at an incremental cost-effectiveness ratio of US$430/YLS compared with no treatment. Starting ART at CD4 < 350 cells/μl increased projected discounted life expectancy to 64.7 months (73.6 months undiscounted), with an incremental cost-effectiveness ratio of US$550/YLS compared with a starting criterion of 250 cells/μl.
Table 7.
Clinical benefits and cost-effectiveness of alternative ART starting strategies in a simulated cohort of patients in Chennai, India.
| ART starting criteria | Discounted mean per-person lifetime costs (2005 US$)a | Discounted mean per-person life expectancy (months) | Cost-effectiveness ratio (US$/YLS) |
|---|---|---|---|
| One line of ART, NNRTI-based regimen | |||
| No co-trimoxazole or ART | 530 | 34.5 | – |
| Co-trimoxazole alone | 580 | 34.9 | Dominatedb |
| ART < 200 cells/μlc | 1540 | 62.4 | Dominated |
| ART < 250 cells/μl | 1580 | 63.7 | 430 |
| ART < 350 cells/μl | 1630 | 64.7 | 550 |
| Two lines of ART, NNRTI-based regimen followed by PI-based regimen | |||
| No co-trimoxazole or ART | 530 | 34.5 | – |
| Co-trimoxazole alone | 580 | 34.9 | Dominated |
| ART < 200 cells/μl | 4980 | 84.8 | Dominated |
| ART < 250 cells/μl | 5140 | 86.7 | 1060 |
| ART < 350 cells/μl | 5430 | 88.9 | 1530 |
ART, antiretroviral therapy; NNRTI, non nucleoside reverse transcriptase inhibitor; PI, protease inhibitor; YLS, years of life saved.
Life expectancy results have been rounded to the nearest one-tenth of a month, and cost and cost-effectiveness results have been rounded to the nearest ten dollars.
Weakly dominated: higher incremental cost-effectiveness ratio than a more costly strategy. The incremental cost-effectiveness ratios for co-trimoxazole alone, one line of ART starting at CD4 < 200 cells/μl, and two lines of ART starting at CD4 < 200 cells/μl, all compared with no treatment, are US$1490/YLS, US$430/YLS, and US$1060/YLS, respectively.
All CD4-based starting strategies include starting with onset of a severe opportunistic infection, regardless of CD4 cell count. Severe opportunistic infections include severe bacterial infections, severe fungal infections, tuberculosis, malaria, toxoplasmosis, Pneumocystis jiroveci pneumonia, and any other severe infection.
When we examined the implications of making available a second-line protease-inhibitor-based regimen, the life expectancy and costs of all ART strategies increased. Starting ART at CD4 < 200 cells/μl provided a discounted life expectancy of 84.8 months (101.1 months undiscounted) at a discounted lifetime cost of US$4980. As in the case of a single ART regimen, this strategy was weakly dominated by a strategy that started ARTearlier, at a CD4 < 250 cells/μl. The incremental cost-effectiveness ratios for the two-line ART strategies increased progressively from US$1060/YLS for starting ART at < 250 cells/μl compared with no treatment, to US$1530/YLS for starting at CD4 < 350 cells/μl compared with starting at < 250 cells/μl.
We then compared life expectancy and cost-effectiveness for two lines versus one line of available ART, under different starting criteria for CD4 cell count (Table 8). Depending on the CD4 starting threshold, the inclusion of second-line therapy increased discounted life expectancy by 22.4–24.2 months, with discounted lifetime cost increases of US$3440–3790. For all CD4 starting thresholds examined, the cost-effectiveness ratios for adding a second line of therapy compared with just one line ranged from US$1850 to US$1880/YLS.
Table 8.
Incremental cost-effectiveness of a second line of ART under alternative ART starting criteria.
| ART starting criteria | Discounted mean per-person lifetime costs (2005 US$)a | Discounted mean per-person life expectancy (months) | Cost-effectiveness ratio (US$/YLS) |
|---|---|---|---|
| ART < 200 cells/μlb,c | |||
| One line of ART, NNRTI | 1540 | 62.4 | – |
| Two lines of ART, NNRTI then PI | 4980 | 84.8 | 1850 |
| ART < 250 cells/μl | |||
| One line of ART, NNRTI | 1580 | 63.7 | – |
| Two lines of ART, NNRTI then PI | 5140 | 86.7 | 1850 |
| ART < 350 cells/μl | |||
| One line of ART, NNRTI | 1630 | 64.7 | – |
| Two lines of ART, NNRTI then PI | 5430 | 88.9 | 1880 |
ART, antiretroviral therapy; NNRTI, non nucleoside reverse transcriptase inhibitor; PI, protease inhibitor; YLS, years of life saved.
Life expectancy results have been rounded to the nearest one-tenth of a month, and cost and cost-effectiveness results have been rounded to the nearest ten dollars.
All CD4-based starting strategies include starting with onset of a severe opportunistic infection, regardless of CD4 cell count. Severe opportunistic infections include severe bacterial infections, severe fungal infections, tuberculosis, malaria, toxoplasmosis, Pneumocystis jiroveci pneumonia, and any other severe infection.
Co-trimoxazole is included in all strategies.
Figure 1 shows differences in mean discounted life expectancy and costs for all 14 starting strategies examined, including the use of a single-line protease inhibitor regimen, and the two-line strategies that begin with the protease inhibitor regimen. The solid curve, known as the efficient frontier, contains all those strategies that provided increased life expectancy for progressively increased cost. Strategies lying below and to the right of the curve were dominated. Strategies involving one line of an NNRTI-based regimen starting at CD4 < 250 cells/μl or < 350 cells/μl lie on the efficient frontier. The only efficient two-line strategies were those that started at CD4 counts < 350 cells/μl. Strategies beginning with a protease-inhibitor-based regimen and not including a second-line regimen were all inefficient compared with two-line treatment strategies.
Fig. 1. Cost-effectiveness of alternative ART strategies in India.
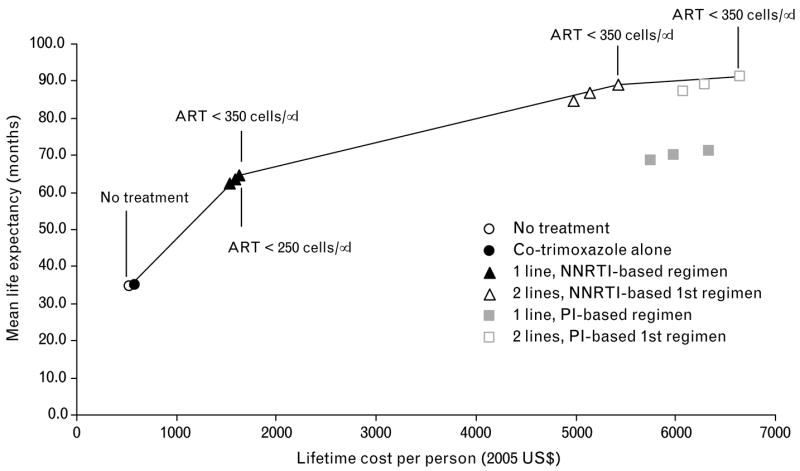
Moving up and to the right, points on the curve show strategies that are more effective and increasingly expensive. Points below and to the right of the line are dominated, or less efficient than, strategies that lie on the curve (see text for details and regimens). ART, antiretroviral therapy; NNRTI, non nucleoside reverse transcriptase inhibitor; PI, protease inhibitor.
Sensitivity analysis
Relative efficacy and costs of the second-line ART regimen, and whether therapy was stopped after immunologic failure, had the greatest impact on results, whereas stage-specific mortality, incidence of opportunistic infections, CD4 decline, frequency of CD4 tests, efficacy of co-trimoxazole, and routine care costs were less influential.
If the cost of the protease inhibitor (indinavir/ritonavir) was decreased by 50%, then the total per-person lifetime cost of the strategy involving two lines of ART starting at CD4 < 250 cells/μl decreased from US$5140 to US$3940, and the incremental cost-effectiveness ratio compared with single-line ART with the same starting criterion decreased from US$1850 to US$1230/YLS (Table 9).
Table 9.
Sensitivity analysis on key model variables.
| ART starting criteria | Discounted mean per-person lifetime costs (2005 US$)a | Discounted mean per-person life expectancy (months) | Cost-effectiveness ratio (US$/YLS) |
|---|---|---|---|
| Cost of PI | |||
| Decrease PI cost 30% | |||
| ART < 250 cells/μlb | |||
| Co-trimoxazole alone | 580 | 34.9 | – |
| One line of ART, NNRTI | 1580 | 63.7 | 420 |
| Two lines of ART, NNRTI then PI | 4420 | 86.7 | 1480 |
| ART < 350 cells/μl | |||
| Co-trimoxazole alone | 580 | 34.9 | – |
| One line of ART, NNRTI | 1630 | 64.7 | 420 |
| Two lines of ART, NNRTI then PI | 4650 | 88.9 | 1500 |
| Decrease PI cost 50% | |||
| ART < 250 cells/μl | |||
| Co-trimoxazole alone | 580 | 34.9 | – |
| One line of ART, NNRTI | 1580 | 63.7 | 420 |
| Two lines of ART, NNRTI then PI | 3940 | 86.7 | 1230 |
| ART < 350 cells/μl | |||
| Co-trimoxazole alone | 580 | 34.9 | – |
| One line of ART, NNRTI | 1630 | 64.7 | 420 |
| Two lines of ART, NNRTI then PI | 4140 | 88.9 | 1240 |
| Initial mean CD4 | |||
| Increase initial mean CD4 from 318 cells/μl to 418 cells/μl | |||
| ART < 250 cells/μl | |||
| Co-trimoxazole alone | 610 | 42.2 | – |
| One line of ART, NNRTI | 1650 | 71.4 | 430 |
| Two lines of ART, NNRTI then PI | 5270 | 94.1 | 1920 |
| ART < 350 cells/μl | |||
| Co-trimoxazole alone | 610 | 42.2 | – |
| One line of ART, NNRTI | 1710 | 72.5 | 430 |
| Two lines of ART, NNRTI then PI | 5590 | 96.5 | 1940 |
| Decrease initial mean CD4 from 318 cells/μl to 218 cells/μl | |||
| ART < 250 cells/μl | |||
| Co-trimoxazole alone | 540 | 26.0 | – |
| One line of ART, NNRTI | 1520 | 55.2 | 410 |
| Two lines of ART, NNRTI then PI | 5110 | 79.3 | 1780 |
| ART < 350 cells/μl | |||
| Co-trimoxazole alone | 540 | 26.0 | – |
| One line of ART, NNRTI | 1560 | 55.9 | 410 |
| Two lines of ART, NNRTI then PI | 5320 | 81.0 | 1800 |
| Efficacy of PI-based regimen | |||
| Decrease efficacy 20% | |||
| ART < 250 cells/μl | |||
| Co-trimoxazole alone | 580 | 34.9 | – |
| One line of ART, NNRTI | 1580 | 63.7 | 420 |
| Two lines of ART, NNRTI then PI | 4840 | 83.6 | 1960 |
| ART < 350 cells/μl | |||
| Co-trimoxazole alone | 580 | 34.9 | – |
| One line of ART, NNRTI | 1630 | 64.7 | 420 |
| Two lines of ART, NNRTI then PI | 5100 | 85.6 | 1990 |
| Increase efficacy 20% | |||
| ART < 250 cells/μl | |||
| Co-trimoxazole alone | 580 | 34.9 | – |
| One line of ART, NNRTI | 1580 | 63.7 | 420 |
| Two lines of ART, NNRTI then PI | 5430 | 89.7 | 1770 |
| ART < 350 cells/μl | |||
| Co-trimoxazole alone | 580 | 34.9 | – |
| One line of ART, NNRTI | 1630 | 64.7 | 420 |
| Two lines of ART, NNRTI then PI | 5730 | 92.1 | 1800 |
| ART stopping criteria | |||
| Last regimen continued until death | |||
| ART < 250 cells/μl | |||
| Co-trimoxazole alone | 580 | 34.9 | – |
| One line of ART, NNRTI | 2700 | 77.6 | 600 |
| Two lines of ART, NNRTI then PIc | 8010 | 97.3 | 3240 |
| ART < 350 cells/μl | |||
| Co-trimoxazole alone | 580 | 34.9 | – |
| One line of ART, NNRTI | 2800 | 79.2 | 600 |
| Two lines of ART, NNRTI then PI | 8420 | 100.0 | 3250 |
ART, antiretroviral therapy; NNRTI, non nucleoside reverse transcriptase inhibitor; PI, protease inhibitor; YLS, years of life saved.
Life expectancy results have been rounded to the nearest one-tenth of a month, and cost and cost-effectiveness results have been rounded to the nearest ten dollars.
All CD4-based starting strategies include starting with onset of a severe opportunistic infection, regardless of CD4 cell count. Severe opportunistic infections include severe bacterial infections, severe fungal infections, tuberculosis, malaria, toxoplasmosis, Pneumocystis jiroveci pneumonia, and any other severe infection.
The incremental cost-effectiveness ratio for this strategy, compared with stopping ART after failure, is US$3250/YLS.
The initial mean CD4 count of the cohort had a substantial effect on life expectancy. For example, a cohort that had a mean CD4 cell count of 218 cells/μl had a discounted life expectancy of 79.3 months, compared with 86.7 months for a cohort starting at a mean CD4 of 318 cells/μl when starting a two-line regimen at a CD4 count of < 250 cells/μl. Despite changes in life expectancy, total lifetime costs also increased as the life expectancy of the cohort increased, and therefore incremental cost-effectiveness ratios – both between starting criteria and between single-line and two-line strategies – did not vary substantially. Similarly, efficacy of the protease-inhibitor-based regimen had an impact on overall survival but not on the cost-effectiveness of therapy.
Life expectancy and lifetime costs were also affected by whether ART was continued after clinical or virologic failure of the last regimen. If ART was continued until death, then lifetime costs increased from US$1580 to US$2700 for one line of therapy and from US$5140 to US$8010 for two lines of therapy, each starting at CD4 < 250 cells/μl. For the two-line strategy with a starting criterion of CD4 < 250 cells/μl, the incremental cost-effectiveness ratio of not stopping ART after virologic failure compared with stopping ART after failure was US$3250/YLS.
Because an increased number of regimens may require increased laboratory testing and clinical skills, we performed sensitivity analysis on the frequency and cost of CD4 tests, the addition of HIV RNA testing every 6 months, or increasing the cost of routine HIV care to account for increased clinical skills for ART decision-making. None of these showed a change in the ordering of strategies or policy conclusions about cost-effectiveness. In addition, if the results of the base-case government roll-out program are compared with a suboptimal program that might take place in the private sector, with potentially lower virologic and clinical success rates, the cost-effectiveness of the government program does not change substantially.
Discussion
In 2004 the Indian government began a program of public coverage of ART to address the growing problem of HIV/AIDS in India. Using an initial regimen of stavudine, lamivudine and nevirapine, at a cost of US$222 per person per year, the program has now enrolled 56 500 patients in more than 100 centers nationally [4]. The goal is to increase those numbers more than fivefold over the next 5 years.
We used a detailed HIV simulation model with data from YRG CARE in Chennai, India, to project the clinical outcomes and cost-effectiveness of alternative HIV treatment strategies, and the impact of more expensive second-line therapy. We found that co-trimoxazole alone provided a small clinical benefit with very little additional cost. This is consistent with data from several countries, and reflects that co-trimoxazole is both highly effective and inexpensive [18,25,27,34]. By preventing very common HIV complications, including bacterial infections and Pneumocystis jiroveci pneumonia, it can provide a simple, rapid, highly effective intervention for the initial management of HIV infection.
The analysis showed that a single regimen of ART nearly doubled discounted life expectancy, from 34.5 life months with no therapy to 63.7 life months with ART starting at CD4 < 250 cells/μl and co-trimoxazole. Starting ART with CD4 < 350 cells/μl further increased discounted life expectancy to 64.7 life months, with a cost-effectiveness ratio of US$550/YLS compared with starting at < 250 cells/μl, suggesting that starting ART in India at CD4 < 350 cells/μl is cost-effective. However, strategies beginning with a protease inhibitor rather than an NNRTI were very expensive, without substantial added efficacy.
As HIV-infected patients in India begin to fail first-line therapy, the question of second-line therapy is becoming increasingly important [35]. We found that the inclusion of second-line therapy with a ritonavir-boosted indinavir-based regimen further increased discounted life expectancy to between 84.8 and 88.9 months, depending on starting CD4 cell count. The lifetime costs of care also increased, but were highly dependent on the cost of the protease inhibitor. At current protease inhibitor costs, however, the incremental cost-effectiveness ratio for two lines of therapy compared with one line of therapy, ranging from US$1850 to US$1880/YLS, is very close to the three-times GDP threshold for cost-effectiveness as cited by WHO [33].
In sensitivity analyses, we identified the clinical and cost parameters with the greatest impact on the results. Cost of the protease-inhibitor-based regimen had a major impact on the cost-effectiveness of any strategies that included protease inhibitors. Furthermore, decisions about whether to stop a protease-inhibitor-based regimen after clinical failure had a greater impact on the results than did decisions about CD4 thresholds for starting therapy. This is because, whereas ART in patients with virologic failure provides some benefit through a decreased incidence of opportunistic infections or death, the magnitude of the benefit is much less than in patients in whom HIV is successfully suppressed [12,13]. Any decisions about stopping therapy in patients who are deriving minimal, but some, benefit should be part of a wider discussion of the strategic use of resources for HIV prevention and treatment by persons living with HIV/AIDS, policy makers, clinicians, and public health officials in India.
This study offers several advantages over previous work on the cost-effectiveness of ART in India and other developing countries [36–38]. First, the model we used is based on more recent and fully documented data regarding the impact of ART on HIV-infected patients in India. Secondly, this study included more detailed modeling of the biologic processes involved in HIV disease and its treatment, including opportunistic infections, in addition to the distinctive benefits of different therapies in patients with varying biological characteristics.
The study also has several limitations. Although we used a previously published model, and derived India-specific data for each available model parameter, some data were unavailable for India, including the efficacy of co-trimoxazole and HIV-related mortality. For these parameters, we used data from another resource-limited setting, Côte d’Ivoire [10,13,18,25,27]. Similarly, the natural history and cost data were from one center in Chennai, so any generalization to other centers in India should be made with caution. However, we examined these model parameters in sensitivity analyses, and found that most site-specific parameters did not have a major influence on the outcomes. Moreover, varying the estimates for data not derived specifically from India had little impact on the results. The annual treatment costs used in our study (US$300/year for one line of ART), were also very similar to those published in a 2006 study (US$223–335/year) of the national governmental ART program in India [39]. We also did not consider economies of scale that occurred during roll-out. It is likely that there would be such economies during the early stages as treatment is expanded, and probable diseconomies in the later stages [37].
This analysis also used a patient-based, rather than a population-based model such as that recently published by Over et al. [36]. Thus it does not capture in detail issues of HIV transmission or the role of transmission of resistant virus. However, the findings of several recent studies from the USA suggested that the impact and cost-effectiveness of ART is much greater for treated individuals than for transmitted ‘secondary’ cases [40–42].
If ART regimens can achieve the efficacy found in published trials, ART will be highly effective and cost-effective in India. Should the cost of protease inhibitors be decreased by at least 50%, as has been accomplished with NNRTIs, then the total lifetime per-person costs of care in India would be decreased from US$5140 to US$3940. If the national target is achieved, this would translate into savings of US$360 million over the lifetimes of the 300 000 adult patients who might be treated over the next 5 years. The pace of ART scale-up in India is beyond the scope of this paper, but decisions made by the government about that pace, and whether efforts are made to identify and prioritize for care those with advanced disease, will have a major impact both on survival and on total costs of care during the scale-up [43]. For 300 000 patients, total costs of care to payers would range from US$462 million for one line of ARTwith co-trimoxazole starting at CD4 < 200 cells/μl, to US$1628 million for two lines of ARTwith co-trimoxazole starting with CD4 < 350 cells/μl.
Finally, we have modeled a standard of care based on current regimens and costs in India. Tenofovir has replaced stavudine in developed countries for first-line therapy, because it is associated with less lipodystrophy [44]. With recently announced decreases in the cost of tenofovir in middle-income and developing countries, it may also replace stavudine in initial ART regimens in India, with implications for long-term toxicity, survival, and cost [7,45].
India has now surpassed South Africa as the country with the largest number of HIV-infected people in the world [2]. The findings of this study show that current NNRTI-based therapy, if started before CD4 counts reach 250 cells/μl, will have a dramatic effect on survival and be very cost-effective. With a modest decrease in protease inhibitor costs, starting therapy with CD4 counts < 350 cells/μl and including a second-line protease-inhibitor-based regimen will have a further dramatic effect on survival and still be cost-effective.
Acknowledgments
We are indebted to the entire CEPAC-International team and investigators for their contributions, including: Eugène Messou, Catherine Seyler, Siaka Touré (Programme PACCI, Abidjan, Côte d’Ivoire); Yazdan Yazdanpanah (Service Universitaire des Maladies Infectieuses et du Voyageur, Centre Hospitalier de Tourcoing, EA 2694, Faculté de Mé decine de Lille, and Laboratoire de Recherches Èconomiques et Sociales, Centre National de la Recherche Scientifique Unité de Recherche Associée 362, Lille, France); Xavier Anglaret (INSERM U593, Université Victor Segalen Bordeaux 2, Bordeaux, France and Programme PACCI, Abidjan, Côte d’Ivoire); Robin Wood (University of Cape Town, Cape Town, South Africa); Glenda Gray, James McIntyre, Neil A. Martinson, Lerato Mohapi (Perinatal HIV Research Unit, WITS Health Consortium, Johannesburg, South Africa); Kara Cotich, Sue Goldie, April Kimmel, Marc Lipsitch, Chara Rydzak, George R. Seage III, Hong Zhang (Harvard School of Public Health, Boston, Massachusetts, USA); A. David Paltiel (Yale University, New Haven, Connecticut, USA); Heather E. Hsu (University of Pittsburgh School of Medicine, Pittsburgh, Pennsylvania, USA); Wendy Aaronson, Sarah Chung, Mariam Fofana, Anjali Saxena, Stacie Waldman, Lindsey Wolf (Massachusetts General Hospital, Boston, Massachusetts, USA).
We are also indebted to the CEPAC-International Scientific Advisory Board, including: Richard Chaisson (Johns Hopkins University, Baltimore, Maryland, USA); Joseph Eron (University of North Carolina, Chapel Hill, North Carolina, USA); R.R. Gangakhedkar (National AIDS Research Institute, Pune, India); Jonathan Kaplan (Centers for Disease Control and Prevention, Atlanta, Georgia, USA); Therese N’Dri Yoman (University of Cocody-Abidjan, Abidjan, Côte d’Ivoire); Douglas Owens (Stanford University, Palo Alto, California, USA); Olive Shisana (Human Sciences Research Council, Cape Town, South Africa).
Sponsorship: This work was supported by the National Institute of Allergy and Infectious Diseases (R01 AI058736, K23 AI01794, K24 AI062476, K25 AI50436, P30 AI060354, T32 AI07433, and U01 AI038858) and the Doris Duke Charitable Foundation Clinical Scientist Development Award to Rochelle P. Walensky, MD, MPH.
Disclaimer: The production of this special Supplement was supported by the World Bank, the Joint United Nations Programme on HIV/AIDS and the World Health Organization. The findings, interpretations and conclusions presented in this paper do not necessarily reflect the views of these institutions or their constituent agencies or governments.
References
- 1.WHO. [Accessed: 30 March 2007];Summary country profile for HIV/AIDS treatment scale-up: India. http://www.who.int/hiv/HIVCP_IND.pdf.
- 2.UNAIDS/WHO. [Accessed: 30 March 2007];AIDS epidemic update: special report on HIV/AIDS: December 2006. http://www.unaids.org/en/HIV_data/epi2006/default.asp.
- 3.Kumarasamy N, Solomon S, Chaguturu SK, Cecelia AJ, Vallabhaneni S, Flanigan TP, Mayer KH. The changing natural history of HIV disease: before and after the introduction of generic antiretroviral therapy in southern India. Clin Infect Dis. 2005;41:1525–1528. doi: 10.1086/497267. [DOI] [PubMed] [Google Scholar]
- 4.Steinbrook R. HIV in India – the challenges ahead. N Engl J Med. 2007;356:1197–1201. doi: 10.1056/NEJMp078011. [DOI] [PubMed] [Google Scholar]
- 5.National AIDS Control Organization, Ministry of Health and Family Welfare, India Go. [Accessed: 30 March 2007];National guidelines for implementation of antiretroviral therapy (ART) http://www.nacoonline.org/guidelines/ART_Guidelines.pdf.
- 6.Gupta SB, Pujari SN, Joshi SR, Patel AK. API consensus guidelines for use of antiretroviral therapy in adults (API–ART guidelines). Endorsed by the AIDS Society of India. J Assoc Physicians India. 2006;54:57–74. [PubMed] [Google Scholar]
- 7.WHO. Antiretroviral therapy for HIV infection in adults and adolescents in resource-limited settings: towards universal access. [Accessed: 30 March 2007]; http://www.who.int/HIV/pub/guidelines/arvguidelines2006.pdf.
- 8.Gold MR, Siegel JE, Russell LB, Weinstein MC, editors. Cost Effectiveness in Health and Medicine. New York, NY: Oxford University Press; 1996. [Google Scholar]
- 9.Freedberg KA, Losina E, Weinstein MC, Paltiel AD, Cohen CJ, Seage GR, et al. The cost effectiveness of combination antiretroviral therapy for HIV disease. N Engl J Med. 2001;344:824–831. doi: 10.1056/NEJM200103153441108. [DOI] [PubMed] [Google Scholar]
- 10.Goldie SJ, Yazdanpanah Y, Losina E, Weinstein MC, Anglaret X, Walensky RP, et al. Cost-effectiveness of HIV treatment in resource-poor settings – the case of Cote d’Ivoire. N Engl J Med. 2006;355:1141–1153. doi: 10.1056/NEJMsa060247. [DOI] [PubMed] [Google Scholar]
- 11.Mellors JW, Munoz A, Giorgi JV, Margolick JB, Tassoni CJ, Gupta P, et al. Plasma viral load and CD4R lymphocytes as prognostic markers of HIV-1 infection. Ann Intern Med. 1997;126:946–954. doi: 10.7326/0003-4819-126-12-199706150-00003. [DOI] [PubMed] [Google Scholar]
- 12.Cole SR, Hernan MA, Robins JM, Anastos K, Chmiel J, Detels R, et al. Effect of highly active antiretroviral therapy on time to acquired immunodeficiency syndrome or death using marginal structural models. Am J Epidemiol. 2003;158:687–694. doi: 10.1093/aje/kwg206. [DOI] [PubMed] [Google Scholar]
- 13.Losina E, Yazdanpanah Y, Deuffic-Burban S, Wang B, Wolf L, Messou E, et al. The independent effect of highly active antiretroviral therapy on severe opportunistic disease incidence and mortality in HIV-infected adults in Côte d’Ivoire. Antiviral Therapy. in press. [PMC free article] [PubMed] [Google Scholar]
- 14.Zhou J, Kumarasamy N, Ditangco R, Kamarulzaman A, Lee CK, Li PC, et al. The TREAT Asia HIV Observational Database: baseline and retrospective data. J Acquir Immune Defic Syndr. 2005;38:174–179. doi: 10.1097/01.qai.0000145351.96815.d5. [DOI] [PMC free article] [PubMed] [Google Scholar]
- 15.Young B, Fischl MA, Wilson HM, Finn TS, Jensen EH, DiNubile MJ, Zeldin RK. Open-label study of a twice-daily indinavir 800-mg/ritonavir 100-mg regimen in protease inhibitor-naive HIV-infected adults. J Acquir Immune Defic Syndr. 2002;31:478–482. doi: 10.1097/00126334-200212150-00004. [DOI] [PubMed] [Google Scholar]
- 16.Kumarasamy N, Solomon S, Flanigan TP, Hemalatha R, Thyagarajan SP, Mayer KH. Natural history of human immunodeficiency virus disease in southern India. Clin Infect Dis. 2003;36:79–85. doi: 10.1086/344756. [DOI] [PubMed] [Google Scholar]
- 17.WHO. Guidelines on co-trimoxazole prophylaxis for HIV-related infections among children, adolescents and adults: recommendations for a public health approach. [Accessed: 9 March 2007]; http://www.who.int/HIV/pub/guidelines/ctxguidelines.pdf.
- 18.Yazdanpanah Y, Losina E, Anglaret X, Goldie SJ, Walensky RP, Weinstein MC, et al. Clinical impact and cost-effectiveness of co-trimoxazole prophylaxis in patients with HIV/AIDS in Cote d’Ivoire: a trial-based analysis. AIDS. 2005;19:1299–1308. doi: 10.1097/01.aids.0000180101.80888.c6. [DOI] [PubMed] [Google Scholar]
- 19.Walensky RP, Weinstein MC, Yazdanpanah Y, Losina E, Mercincavage LM, Toure SM, et al. HIV drug resistance surveillance for prioritizing treatment in resource limited settings. AIDS. 2007;21:973–982. doi: 10.1097/QAD.0b013e328011ec53. [DOI] [PMC free article] [PubMed] [Google Scholar]
- 20.Kumarasamy N, Chaguturu S, Mayer KH, Solomon S, Yepthomi HT, Balakrishnan P, Flanigan TP. Incidence of immune reconstitution syndrome in HIV/tuberculosis-coinfected patients after initiation of generic antiretroviral therapy in India. J Acquir Immune Defic Syndr. 2004;37:1574–1576. doi: 10.1097/00126334-200412150-00007. [DOI] [PubMed] [Google Scholar]
- 21.Cecelia AJ, Christybai P, Anand S, Jayakumar K, Gurunathan T, Vidya P, et al. Usefulness of an observational database to assess antiretroviral treatment trends in India. Natl Med J India. 2006;19:14–17. [PubMed] [Google Scholar]
- 22.Multicenter AIDS Cohort Study (MACS) Public Dataset: Release PO4. Springfield, VA: National Technical Information Service; 1995. [Google Scholar]
- 23.Wang B, Kumarasamy N, Divi N, Cecilia AJ, Mayer KH, Lu Z, et al. Incidence of opportunistic infections (OIs) within specific CD4 strata in HIV-infected patients in Southern India [abstract WePe0279.]. XVI International AIDS Conference; 16 August 2006. Toronto, Canada. [Google Scholar]
- 24.Losina E, Anglaret X, Yazdanpanah Y, Wang B, Toure S, Seage GR, 3rd, et al. Impact of opportunistic diseases on chronic mortality in HIV-infected adults in Côte d’Ivoire. S Afr Med J. 2006;96:526–529. [PubMed] [Google Scholar]
- 25.Anglaret X, Chêne G, Attia A, Toure S, Lafont S, Combe P, et al. Early chemoprophylaxis with trimethoprim–sulphamethoxazole for HIV-1-infected adults in Abidjan, Côte d’Ivoire: a randomised trial. Cotrimo-CI Study Group. Lancet. 1999;353:1463–1468. doi: 10.1016/s0140-6736(98)07399-1. [DOI] [PubMed] [Google Scholar]
- 26.Lopez A, Ahmad O, Guillot M, Ferguson B, Saloman J, Murray CJL, et al. World Mortality in 2000: Life Tables for 191, Countries. Geneva: World Health Organization; 2002. [Google Scholar]
- 27.Goldie SJ, Kaplan JE, Losina E, Weinstein MC, Paltiel AD, Seage GR, 3rd, et al. Prophylaxis for human immunodeficiency virus-related Pneumocystis carinii pneumonia: using simulation modeling to inform clinical guidelines. Arch Intern Med. 2002;162:921–928. doi: 10.1001/archinte.162.8.921. [DOI] [PubMed] [Google Scholar]
- 28.Unit Costs for Components of HIV-Related Health Care 2005. Chennai, India: YRG CARE Pharmacy; [Google Scholar]
- 29.Weinstein MC, Goldie SJ, Losina E, Cohen CJ, Baxter JD, Zhang H, et al. Use of genotypic resistance testing to guide HIV therapy: clinical impact and cost-effectiveness. Ann Intern Med. 2001;134:440–450. doi: 10.7326/0003-4819-134-6-200103200-00008. [DOI] [PubMed] [Google Scholar]
- 30.Dabis F, Balestre E, Braitstein P, Miotti P, Brinkhof WG, Schneider M, et al. Cohort profile: Antiretroviral Therapy in Lower Income Countries (ART-LINC): international collaboration of treatment cohorts. Int J Epidemiol. 2005;34:979–986. doi: 10.1093/ije/dyi164. [DOI] [PubMed] [Google Scholar]
- 31.Homan RK, Ganesh AK, Duraisamy P, Castle C, Sripriya M, Franklin B, Solomon S, et al. Economic Analyses of YRG CARE Services. Research Triangle Park: Family Health International; 2000. [Google Scholar]
- 32.Weinstein MC. Decision rules for incremental cost-effectiveness analysis. In: Jones AM, editor. The Elgar Companion to Health Economics. Cheltenham: Edward Elgar Publishing Ltd; 2006. pp. 469–478. [Google Scholar]
- 33.WHO. [Accessed: 19 March 2007];The world health report 2002: reducing risks, promoting health life. doi: 10.1080/1357628031000116808. http://www.who.int/whr/2002/en/whr02_en.pdf. [DOI] [PubMed]
- 34.Badri M, Ehrlich R, Wood R, Maartens G. Initiating co-trimoxazole prophylaxis in HIV-infected patients in Africa: an evaluation of the provisional WHO/UNAIDS recommendations. AIDS. 2001;15:1143–1148. doi: 10.1097/00002030-200106150-00009. [DOI] [PubMed] [Google Scholar]
- 35.Kumarasamy N, Vallabhaneni S, Cecelia AJ, Yepthomi T, Balakrishnan P, Saghayam S, et al. Reasons for modification of generic highly active antiretroviral therapeutic regimens among patients in southern India. J Acquir Immune Defic Syndr. 2006;41:53–58. doi: 10.1097/01.qai.0000188123.15493.43. [DOI] [PubMed] [Google Scholar]
- 36.Over M, Marseille E, Sudhakar K, Gold J, Gupta I, Indrayan A, et al. Antiretroviral therapy and HIV prevention in India: modeling costs and consequences of policy options. Sex Transm Dis. 2006;33:S145–S152. doi: 10.1097/01.olq.0000238457.93426.0d. [DOI] [PubMed] [Google Scholar]
- 37.Over M, Heywood P, Gold J, Gupta I, Hira S, Marseille E. [Accessed: 21 May 2007];HIV/AIDS treatment and prevention in India: modeling the cost and consequences. doi: 10.1097/01.olq.0000238457.93426.0d. http://siteresources.worldbank.org/INTINDIA/Resources/IndiaARTReport1.pdf. [DOI] [PubMed]
- 38.Ravenga A, Over M, Masaki E, et al. The economics of effective AIDS treatment: evaluating policy options for Thailand. [Accessed: 21 May 2007]; doi: 10.1097/01.aids.0000279713.39675.1c. http://siteresources.worldbank.org/INTEAPREGTOPHIVAIDS/Resources/AIDS-Treatment-effectiveness-TOC.pdf. [DOI] [PubMed]
- 39.Gupta I, Trivedi M, Kandamuthan S. [Accessed: 21 May 2007];Costing of the free ART programme of the Government of India. http://iegindia.org/dis_111_2006.pdf.
- 40.Paltiel AD, Walensky RP, Schackman BR, Seage GR, 3rd, Mercincavage LM, Weinstein MC, Freedberg KA. Expanded HIV screening in the United States: effect on clinical outcomes, HIV transmission, and costs. Ann Intern Med. 2006;145:797–806. doi: 10.7326/0003-4819-145-11-200612050-00004. [DOI] [PubMed] [Google Scholar]
- 41.McCormick AW, Walensky RP, Lipsitch M, Losina E, Hsu H, Weinstein MC, et al. The effect of antiretroviral therapy on secondary transmission of HIV among men who have sex with men. Clin Infect Dis. 2007;44:1115–1122. doi: 10.1086/512816. [DOI] [PMC free article] [PubMed] [Google Scholar]
- 42.Sanders GD, Bayoumi AM, Sundaram V, Bilir SP, Neukermans CP, Rydzak E, et al. Cost-effectiveness of screening for HIV in the era of highly active antiretroviral therapy. N Engl J Med. 2005;352:570–585. doi: 10.1056/NEJMsa042657. [DOI] [PubMed] [Google Scholar]
- 43.Walensky RP, Wood R, Losina E, Martinson N, Weinstein MC, Mercincavage LM, et al. Waiting for ART in South Africa: deaths averted with a more aggressive scale-up [abstract 549]. 14th Conference on Retroviruses and Opportunistic Infections; February 25–28, 2007; Los Angeles, California. [Google Scholar]
- 44.A Working Group of the Office of AIDS Research Advisory Council (OARAC) DHHS Panel on Antiretroviral Guidelines for Adults and Adolescents. [Accessed: 21 May 2007];Guidelines for the use of antiretroviral agents in HIV-1-infected adults and adolescents. http://aidsinfo.nih.gov/ContentFiles/AdultandAdolescentGL.pdf.
- 45.The Clinton Foundation. Antiretroviral (ARV) price list. [Accessed: 21 May 2007]; http://www.clintonfoundation.org/pdf/chai-arv-price-list-050807.pdf.