

Abstract
Background
The main goals are to investigate the effects of chronic active heavy drinking on N-acetylaspartate (NAA) and other metabolites throughout the brain and to determine whether they are affected by family history (FH) of alcoholism and long-term drinking pattern.
Methods
Forty-six chronic heavy drinkers (HD) and 52 light drinkers (LD) were recruited from the community and compared on measures of regional brain structure using magnetic resonance imaging and measures of common brain metabolites in gray matter (GM) and white matter (WM) of the major lobes, subcortical nuclei, brainstem, and cerebellum using short–echo time magnetic resonance spectroscopic imaging. Regional atrophy-corrected levels of NAA, myoinositol (mI), creatine, and choline-containing metabolites were compared as a function of group, FH of alcoholism, and bingeing.
Results
Frontal WM NAA was lower in FH-negative HD than FH-positive HD and tended to be lower in women than men. Creatine-containing metabolites in parietal GM were higher in HD than LD. FH-negative compared with FH-positive HD also had more mI in the brainstem and tended to have lower NAA and more mI in frontal GM. Although parietal GM NAA was not significantly lower in HD than LD, it was lower in non–binge drinkers than bingers. Frontal WM NAA was lower in HD than LD, with the difference driven by a small number of women, FH-negative HD, and older age. Lower frontal WM NAA in HD was associated with lower executive and working memory functions and with lower P3b amplitudes at frontal electrodes.
Conclusions
Community-dwelling HD who are not in alcoholism treatment have brain metabolite changes that are associated with lower brain function and are likely of behavioral significance. Age, FH, and binge drinking modulate brain metabolite abnormalities. Metabolite changes in active HD are less pronounced and present with a different spatial and metabolite pattern than reported in abstinent alcoholics.
Keywords: Magnetic Resonance, Brain, Social Drinking, Binge Drinking, Family History
Long-term chronic alcohol consumption is associated with regional structural and metabolite brain damage, as determined by human neuroimaging studies (e.g., Rosenbloom et al., 1995; Sullivan, 2000). This conclusion has been drawn from studies typically performed in short-term sober alcoholics recruited from substance abuse treatment programs. These treatment-seeking individuals represent only a small fraction of the approximately 9% of American adults who exhibit an alcohol use disorder at some time during their lives (Grant, 1994a,b; Harwood et al., 1994) but never undergo alcoholism treatment. Socially functioning heavy drinkers (HD) often do not recognize that their level of drinking constitutes a problem that warrants treatment. It is unknown to what extent such active HD display structural or metabolic brain damage, whether the spatial pattern of potential damage is similar to that described in sober recovering alcoholics, and to what extent such damage is associated with cognitive deficits that may interfere with daily routines. On the basis of the available literature and epidemiological data, we previously hypothesized (Fein et al., 2002) that alcohol-dependent subjects who seek treatment have more comorbid conditions—including substance abuse, affective symptoms, and other psychopathology—than the socially functioning HD population. Therefore, it cannot be assumed that the brain damage described in alcohol-dependent treatment samples appropriately reflects the type, extent, and magnitude of brain damage possibly present in community samples of socially functioning drinkers.
Genetic factors, including a family history of alcoholism (FHA), may play a role in the vulnerability to, and severity of, alcohol-induced brain damage (McGue, 1994). Also, the pattern of heavy drinking, i.e., binge alcohol drinking as opposed to continual heavy drinking, may be a significant and specific contributor to brain damage in chronic alcoholics (Agartz et al., 1999; Crews, 1999; Crews et al., 2000; Fadda and Rossetti, 1998; Hunt, 1993a). Therefore, we examined the effects of FHA and drinking pattern on brain damage.
Proton magnetic resonance spectroscopy imaging (1H MRSI) studies of abstinent alcoholics in treatment show alterations of brain metabolites primarily in the frontal lobes, cerebellum, and thalami—mostly brain regions that also show tissue loss at neuroimaging and pathologic changes at autopsy (Sullivan, 2000). These metabolite alterations are consistent with regional neuronal/axonal damage [inferred from N-acetylaspartate (NAA) concentrations] and with changes in glial and general cell membrane metabolism [inferred from myoinositol (mI) measures]. Recently, we showed in a preliminary study that NAA concentrations are indeed low in the frontal WM of active HD (Goldmann et al., 2000); this prompted us to investigate metabolite levels throughout the brains of these individuals by using multislice 1H MRSI.
Our primary hypothesis was that in HD compared with light drinkers (LD), NAA is lower and mI is higher in those brain regions that are also affected in recovering alcoholics, i.e., the frontal lobes, cerebellum, and thalamus. A secondary aim was to determine the extent to which the density of FHA affects chronic alcohol-induced brain metabolite changes. Then, we hypothesized that a predominant pattern of binge drinking is associated with greater NAA loss and higher mI than continual heavy drinking. Finally, we assessed the clinical relevance of metabolite alterations by correlation with cognitive test performance and electrophysiological characteristics, knowing that recently abstinent alcoholics have impaired executive or frontal lobe functions (Fein et al., 1990; Oscar-Berman, 2000; Parsons and Nixon, 1993; Ratti et al., 1999) and that heavy social drinkers have been hypothesized to have at least mild cognitive deficits (Parsons and Nixon, 1998). Specifically, we hypothesized that lower frontal lobe NAA in HD is associated with lower executive functioning and working memory and with smaller P3a amplitude, as well as prolonged latency of P3 event-related potentials.
METHODS
Participants
LD and HD were recruited from the general community via advertisements in local newspapers and flyers. Table 1 lists demographic and alcohol use data on 46 chronic HD (8 women) and 52 LD (20 women) participating in this study. The enrollment criterion for HD was the consumption of more than an average of 100 alcoholic drinks per month for men over 3 years before the study (80 drinks for women). A drink was defined as containing 13.6 g of pure alcohol. The criterion for LD was the consumption of fewer than an average of 45 drinks per month for men (35 for women) over lifetime. Drinking history since the onset of regular drinking (defined as drinking more than one alcoholic drink per month) was ascertained by using a structured interview (Skinner and Sheu, 1982; Sobell and Sobell, 1992; Sobell et al., 1988). An individual who over 3 years before the study drank on average more than 100 alcoholic drinks per month (80 for women) on fewer than 21 drinking days per month (i.e., not a daily continual drinker) was defined as a binge drinker. This working definition accepts bingeing as the consumption of more than five drinks per day (four for women) but not per occasion and is therefore slightly different from definitions used in the literature (Wechsler and Austin, 1998). An FHA was obtained via questionnaire (Mann et al., 1985) by asking participants to classify all first- and second-degree blood relatives over the age of 18 years as “abstainers,” “social drinkers,” or “problem drinkers.” Individuals with at least one parent or sibling identified as a problem drinker were defined as family history–positive (FH+) for alcoholism.
Table 1.
Demographic and Drinking History Data in Light Drinkers (LD) and Heavy Drinkers (HD) (mean ± SD)
| Measure | LD | HD |
|---|---|---|
| n (female) | 52 (20) | 46 (8) |
| Age, years (range) | 41.0 ± 8.5 (21–56) | 41.3 ± 9.4 (27–56) |
| Education, years (range) | 15.7 ± 2.1 (12–21) | 14.0 ± 2.0 (11–20) |
| Ethnicitya (%) | 76 C, 7 A, 11 L, 6 O | 61 C, 27 AA, 10 L, 2 O |
| Family history (% positive)b | 42 | 65 |
| Drinks per month last year | 10 ± 12 | 196 ± 114 |
| Drinks per month last 3 years | 11 ± 12 | 204 ± 104 |
| Drinks per month over lifetime | 13 ± 11 | 169 ± 126 |
| Drinks over lifetime | 3373 ± 3139 | 48,715 ± 51,543 |
| Duration of regular drinking (years) | 22.8 ± 8.1 | 23.6 ± 9.4 |
| Duration of heavy drinking (years) | NA | 22.4 ± 9.3 |
| Onset age of heavy drinking (years) | NA | 17.5 ± 4.9 |
| Time since last alcoholic drinkc (hr) | 17.8 ± 6.9 (n = 6) | 14.0 ± 3.9 (n = 22) |
| Drinks during 24 hr before MRIc | 0.50 ± 0.65 (n = 6) | 2.7 ± 3.4 (n = 22) |
NA, not applicable.
Self-identified. C, Caucasian; A, Asian; AA, African American; L, Latino; O, other.
χ2 = 4.5; p < 0.05.
In only those who reported drinking more than one drink within the last 24 hr before MRI.
Before the study, all participants gave written, informed consent approved by the institutional review boards of the San Francisco Department of Veterans Affairs Medical Center and the University of California–San Francisco. All participants were screened to exclude those with a history of psychiatric or neurological disorders, a history of head trauma with loss of consciousness, human immunodeficiency virus infection, dependence on substances other than alcohol within the past 12 months, pregnancy, or magnetic resonance imaging (MRI) hazards (i.e., metal implants or pacemakers). No HD exhibited neurological signs of Wernicke-Korsakoff syndrome. Exclusion criteria at the time of study were a positive breath test for alcohol (i.e., >0.005%, the lower detection level of our breathalyzer) or obvious signs of alcohol withdrawal (e.g., nausea or vomiting, tremor, or paroxysmal sweats). Participants were asked to abstain from drugs and alcohol for 12 hr before all experimental procedures, and this was verified via a short questionnaire. Only those HD were enrolled who could abstain for up to 12 hr without going into withdrawal. Most HD reported that they usually drank at night after work, only two reported having consumed one and four alcoholic drinks 2 and 10 hr before the study, respectively, and less than half of all participants reported drinking at all within the 24 hr before the MRI study (Table 1). This indicates that participation in this study did not cause significant alterations of drinkers’ typical drinking patterns and that HD likely were not in acute alcohol withdrawal at the time of MRI.
MRI Acquisition and Processing
Brain MRI data were obtained with a standard 1.5-T scanner (Vision, Siemens Medical Systems, Inc., Iselin, NJ). Structural MRI data were acquired by using a double spin-echo sequence with TR, TE1, and TE2 (repetition and echo times) of 2500, 20, and 80 msec, respectively; 1 × 1 mm2 in-plane resolution; and 50 contiguous 3-mm-thick axial slices oriented along an imaginary line connecting the anterior and posterior commissures as seen on midsagittal scout MRI. A volumetric magnetization-prepared rapid gradient echo was acquired with TR, TE, and TI of 10, 5, and 300 msec, respectively; 15° flip angle; 1 × 1 mm2 inplane resolution; and 1.5-mm-thick coronal partitions oriented along the main long axes of bilateral hippocampi as seen on sagittal scout MRI.
To obtain metabolite measures by tissue type, we co-registered MRSI data with MRIs that had been segmented into gray matter (GM), white matter (WM), and cerebrospinal fluid (CSF). We used probabilistic segmentation of T1-weighted images similar to that in other reported methods (Ashburner and Friston, 2000; Shattuck et al., 2001; Van Leemput et al., 1999; Wells et al., 1996). We then used an atlas-based method to identify regions of interest (ROI) in the brain (Collins et al., 1994; Dawant et al., 1999; Gee et al., 1993; Iosifescu et al., 1997). A single high-resolution reference MRI was manually edited to delineate ROIs. The ROIs included the hemispheres, the major lobes of the brain, subcortical structures, brainstem, and cerebellum. A entropy-driven B-spline free-form deformation program (Studholme et al., 2001a,b) was used to register each scan to the reference brain. The use of a B-spline model of the deformation provided a direct, analytical estimate of the transformation that was then inverted and applied to the atlas labels to demarcate subject-specific ROIs on each MRI. After careful inspection of all automatically marked images for quality, GM, WM, and CSF volumes within the lobar ROIs were computed.
MRSI Acquisition and Processing
MRI was followed by automated head shimming and a multislice 1H MRSI sequence with TR, TI, and TE of 1800, 165, and 25 msec, respectively; circular k-space sampling; and three slices, each 15 mm thick with a slice gap of at least 6 mm, angulated parallel to the double spin-echo slices, covering the major cerebral lobes, subcortical nuclei, brainstem, and the anterior superior cerebellar vermis (see Fig. 1 for slice positions). Details of the sequence and MRSI results have been published (e.g., Soher et al., 2000; Wiedermann et al., 2001). The total acquisition time was approximately 90 min for MRI and MRSI.
Fig. 1.
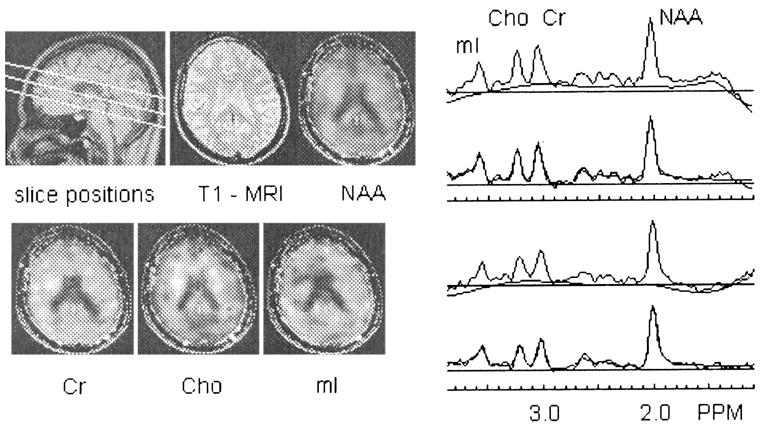
Example of one slice of a three-slice 1H MRSI dataset acquired with TR and TE of 1800 and 25 msec, respectively: MRSI slice positions are overlaid on a midsagittal MRI, a T1-weighted MRI corresponding to the center of the top MRSI slice, corresponding metabolite maps with overlaid MRI outline (left), two examples of cortical spectra, their automatically determined baselines, and overlaid spectral fits.
Multislice 1H MRSI data processing and analysis were applied offline with mostly automated techniques to obtain absolute metabolite concentrations in all voxels sampled (Soher et al., 2000; Wiedermann et al., 2001). The MRSI dataset was water-suppressed with a finite impulse response deconvolution filter (Kuroda et al., 1989), and spectral regions of noise in each voxel were then suppressed without affecting resonance line widths by using principal components analysis based on a deformation shape-intensity model (Zhu et al., 2002). Integrals for the resonances corresponding to N-acetyl–containing metabolites (NAA), creatine (Cr)-containing metabolites, choline (Cho)-containing metabolites, and mI were estimated, including baseline correction. Metabolite integrals were corrected for differences in receiver gain and coil loading between participants. Furthermore, metabolite peak quantities in each voxel were divided by the volume fraction of tissue (volumes of GM and WM in the voxel divided by total voxel volume), which was obtained from the co-registered tissue-segmented MRI (Schuff et al., 2001) (see below). The final result was CSF-corrected absolute metabolite concentrations expressed in institutional units, herein referred to as concentrations. Spectral data were subjected to automated quality-control measures, and 1H MRSI voxels that did not meet the following inclusion criteria were rejected from further analysis: (1) spectral line width, 3 to 11 Hz; (2) NAA chemical shift, 1.96 –2.06 ppm; (3) chemical shift difference between Cr and NAA peaks, 0.95–1.07 ppm; (4) chemical shift difference between Cr and mI peaks, 0.63–0.43 ppm; and (5) volume fraction of brain tissue in voxel, 33% or more. Because of this quality-control step, slightly different numbers of participants contributed to metabolite concentrations derived for different brain regions. Figure 1 shows MRSI slice positions and an example of the kind of spectroscopic information obtained.
MRI/1H MRSI Co-Processing
To calculate metabolite concentrations for GM and WM in each ROI identified on MRI, the segmented MRI was spatially co-registered to the 1H MRSI dataset and reduced to MRSI resolution, taking into account the MRSI point-spread function, chemical-shift displacement, and slice profile (Schuff et al., 2001). This operation permitted computation of the tissue composition of each voxel in the 1H MRSI acquisition volume. Tissue composition values were used to implement CSF correction of metabolite concentrations. For each tissue category in each ROI, metabolite concentrations from all automatically selected voxels containing a sufficiently high tissue fraction (volume of targeted tissue category in the voxel divided by total tissue volume in the voxel) were averaged together. In the various ROIs, “sufficiently high” was defined as 90% or more for frontal and parietal WM; 80% or more for temporal WM; 60% or more for frontal GM; 50% or more for parietal GM, temporal GM, cerebellar GM and WM, thalamus, and brainstem tissue; and 30% or more for caudate and lenticular nucleus tissue. The average numbers of voxels per ROI analyzed were as follows: 25 to 60 for lobar WM regions; 35 to 70 for lobar GM regions; 15 to 30 for thalami, lenticular nuclei, and brainstem; 18 for vermian WM; and 10 for caudate. Only approximately 40% of subjects had more than two caudate spectra of sufficient quality to be included in statistical analyses. Sulcal and ventricular CSF was assumed to have a concentration of 0 for all metabolites, an assumption supported by a lack of metabolite signal in voxels containing exclusively CSF. Metabolite concentrations in bilateral ROIs were analyzed separately by side, but because no significant side effects were found, left and right measures were averaged.
Neurocognitive Testing
Typically within 0 to 7 days of the MRI examination, all participants underwent extensive neuropsychological testing (Rothlind et al., 2004, unpublished data). Raw test scores were converted to z scores with reference to the entire sample. Domain scores were calculated by averaging the z scores of the contributing measures. Domains were verbal intelligence, processing speed, balance, working memory, visuospatial function, executive function, and learning and memory. Domain scores were based on a selection of standardized computerized and paper-and-pencil tests (Meyerhoff et al., 1999), including the MicroCog Computerized Assessment of Cognitive Functioning, Controlled Oral Word Association Test, Wisconsin Card Sorting Test, Category Test, Trail Making, Grooved Pegboard, Symbol Digit, Brown-Peterson Auditory Trigrams, American version of the Nelson Adult Reading Task (AMNART), California Verbal Learning Test, Rey-Osterrieth Complex Figure Drawing Test, Brief Visuospatial Memory Test, Stroop Test, and Fregly Ataxia Battery. These scores were used in correlation analyses with metabolite measures to test our a priori hypotheses.
Electrophysiological Measurements Indexing Brain Function
Electrophysiological measurements were obtained, typically within 0 to 3 days of the MRI examination, while subjects performed oddball paradigms similar to those described in previous studies (Fein et al., 1995). Methodological differences from Fein et al. included the use of an Electro-Cap (Electro-Cap International, Inc., Eaton, OH) with 64 tin electrodes and the Neuroscan data-acquisition system (Neuroscan, Inc., El Paso, TX). We quantified visual and auditory P3a and P3b event-related potential components at three midline electrodes in the frontal (Fz), central (Cz), and parietal (Pz) cortex and averaged over the frontal (FP1, FP2, AF1, AF2, F3, Fz, F4, F7, and F8), central (FC1, FC2, FC5, FC6, C3, Cz, and C4), parietal (CP1, CPz, Cp2, P3, Pz, and P4), and temporal (CP5, Cp6, T3, T4, T5, and T6) electrodes. These measures were used in analyses of associations with metabolite measures.
Statistical Analysis
We evaluated the categorical effects of HD, drinking pattern, and presence of FHA on metabolite measures by using the general linear model procedures in SAS (SAS Institute Inc., Cary, NC). Initial analyses revealed gender effects on some outcome measures. Because the relatively small proportion of female participants precluded a thorough and meaningful analysis with gender as a factor in an ANOVA, we analyzed data independently of gender and repeated the analyses on men-only or women-only groups. Although the main groups were age matched, age was used as a covariate in analyses because of known age effects on metabolite measures and because of the relatively wide age range of the study participants (21–56 years). Associations within each study group of demographic, drinking, cognitive domain, and electrophysiological variables with MRSI measures used Spearman correlations, and effects of age were partialed out where appropriate. Selection of associations was guided by our a priori hypotheses of greater metabolite damage with greater drinking severity and with worse scores on neurocognitive or functional tests. In these tests of a priori hypotheses, we did not correct for multiple comparisons. In all tests, p < 0.05 was considered statistically significant, except in metabolite/electrophysiological relationships, where the criterion for significance was p < 0.01. All measures are reported as mean ± SD.
RESULTS
Participants
All HD were non–treatment seeking at the time of enrollment and met the DSM-IV criteria for alcohol dependence (41 of 46 HD) or abuse (5 of 46 HD) during the last year before enrollment. Although none of the HD was in a formal alcoholism treatment at the time of enrollment, an estimated 75% were in motivational conflict about changing their drinking behavior. Therefore, we made a list of treatment programs in the San Francisco Bay Area available to those who were interested (located at a Veterans Administration hospital, we were not able to offer treatment to our nonveteran HD). As shown in Table 1, HD consumed an average of 200 standard alcoholic drinks per month over the last 1 or 3 years before the study and had a lifetime average alcohol consumption of 169 monthly drinks, or 663 kg over 23.6 years of regular drinking. Age of onset of HD (> 100 drinks per month) was 17.5 ± 4.9 years, with only 9 of 46 HD reporting having started heavy drinking at age 21 years or older. This contrasts with a typical monthly alcohol consumption of 280 drinks over 31 years of heavy drinking in a typical sample of recovering alcoholics in treatment (Durazzo et al., 2004). Furthermore, and in contrast with the typical alcoholic in treatment described in the literature, HD were relatively young, highly educated, and of relatively high socioeconomic status. The mean duration of education was 14 years, 25% were college graduates, 29% were working at the time of study, only 25% were on disability, and approximately 60% reported incomes between $20,000 and greater than $100,000 the year preceding the study. LD consumed an average of 13 drinks per month over approximately 23 years of regular drinking, corresponding to a lifetime average alcohol consumption of 46 kg.
Effects of HD and Alcohol Dependence
Regional 1H MRSI metabolite concentrations in the entire HD sample are shown in Table 2. NAA in frontal WM was 5% lower in all HD compared with all LD (p = 0.04). No other cortical or subcortical region, cerebellum, or brainstem showed significant NAA loss. Cr in parietal GM was 8% higher in HD compared with LD (p = 0.005), whereas Cr differences in parietal WM were less significant (p = 0.13). Similarly, parietal GM mI (p = 0.05) and Cho (p = 0.07) were also higher in HD versus LD, whereas the corresponding WM measures showed no significant group differences. Metabolite concentrations in the cerebellum and in the three subcortical nuclei, including the thalami, were not significantly affected by heavy drinking.
Table 2.
Metabolite Concentrations (Arbitrary Units) in LD and HD and in Alcohol-Dependent HD: Men and Women Combined (mean ± SD)
| Metabolite | Region of interest | All LD (n = 52) | All HD (n = 46) | LD vs. HD | Dependent HD (n = 41) | LD vs. dependent HD |
|---|---|---|---|---|---|---|
| NAA | Fro WMa | 32.91 ± 4.38 | 31.11 ± 4.21 | F(2,89) = 4.30; p = 0.04 | 30.96 ± 4.32 | F(2,84) = 3.59; p = 0.06 |
| Fro GM | 34.73 ± 3.43 | 34.70 ± 4.61 | NS | 34.70 ± 4.71 | NS | |
| Par WM | 30.86 ± 4.23 | 30.22 ± 4.49 | NS | 30.22 ± 4.64 | NS | |
| Par GM | 32.93 ± 3.43 | 33.57 ± 4.07 | NS | 33.66 ± 3.92 | NS | |
| Cr | Fro WM | 18.98 ± 2.21 | 19.75 ± 2.94 | F(2,91) = 2.07; p = 0.15 | 19.92 ± 2.95 | F(2,86) = 2.97; p = 0.09 |
| Fro GM | 22.95 ± 3.22 | 23.33 ± 3.23 | NS | 23.72 ± 3.28 | NS | |
| Par WM | 17.53 ± 2.49 | 18.37 ± 2.55 | F(2,78) = 2.36; p = 0.13 | 18.72 ± 2.40 | F(2,73) = 3.97; p = 0.05 | |
| Par GM | 19.99 ± 2.17 | 21.50 ± 2.88 | F(2,93) = 8.44; p = 0.005 | 21.79 ± 2.75 | F(2,88) = 11.95; p = 0.0008 | |
| Cho | Fro WM | 6.45 ± 1.08 | 6.17 ± 1.13 | NS | 6.27 ± 1.14 | NS |
| Fro GM | 6.47 ± 1.25 | 6.59 ± 1.29 | NS | 6.79 ± 1.27 | NS | |
| Par WM | 5.38 ± 0.94 | 5.38 ± 1.00 | NS | 5.54 ± 0.99 | NS | |
| Par GM | 5.06 ± 0.63 | 5.31 ± 0.73 | F(2,92) = 3.30; p = 0.07 | 5.41 ± 0.71 | F(2,87) = 5.75; p = 0.02 | |
| mI | Fro WM | 17.74 ± 3.51 | 17.77 ± 3.03 | NS | 18.06 ± 2.93 | NS |
| Fro GM | 21.02 ± 4.19 | 20.37 ± 3.00 | NS | 20.69 ± 2.98 | NS | |
| Par WM | 17.57 ± 2.73 | 18.15 ± 2.85 | NS | 18.53 ± 2.52 | NS | |
| Par GM | 17.74 ± 2.54 | 18.94 ± 3.29 | F(2,92) = 3.84; p = 0.05 | 19.16 ± 3.23 | F(2,87) = 4.74; p = 0.03 | |
| NAA | Brainstem | 33.14 ± 5.08 | 32.48 ± 5.16 | NS | 31.82 ± 4.69 | NS |
| Thalamus | 36.97 ± 4.54 | 37.21 ± 4.77 | NS | 37.12 ± 4.82 | NS | |
| Cr | Brainstem | 27.58 ± 3.25 | 29.04 ± 5.10 | NS | 28.46 ± 4.57 | NS |
| Thalamus | 24.66 ± 2.67 | 25.00 ± 3.43 | NS | 25.22 ± 3.43 | NS | |
| Cho | Brainstem | 8.03 ± 1.41 | 8.21 ± 1.42 | NS | 8.04 ± 1.35 | NS |
| Thalamus | 7.10 ± 1.00 | 6.99 ± 1.06 | NS | 7.05 ± 1.07 | NS | |
| mI | Brainstem | 22.86 ± 4.68 | 23.28 ± 5.78 | NS | 22.64 ± 5.48 | NS |
| Thalamus | 20.22 ± 3.37 | 20.75 ± 3.85 | NS | 21.07 ± 3.90 | NS |
Fro, frontal; Par, parietal; NS, not significant.
Female HD versus female LD: − 13%; F(2,24) = 3.77; p = 0.06.
When statistical analyses were restricted to the smaller sample of female LD and HD (20 LD and 8 HD), we found trends to lower frontal WM NAA [− 13%; F(2,24) = 3.77; p = 0.06] and lower brainstem NAA [− 15%; F(2,18) = 3.02; p = 0.10]. The magnitude of these NAA losses was greater than in men, despite similar drinking quantity measures. When statistical analyses included only those HD with a DSM-IV diagnosis of current alcohol dependence, metabolite differences that distinguished HD from LD widened and statistical significances increased, particularly in the parietal lobe (Table 2). An exception was the lower significance of a nominally greater frontal WM NAA group difference (−6%; p = 0.06) between dependent HD and LD.
When only individuals older than 38 years (mean age, 47 years) were analyzed, group differences generally widened [e.g., lower frontal WM NAA in HD: F(2,60) = 5.40; p = 0.02; higher parietal GM mI in HD: F(2,63) = 7.26; p = 0.009]. Correspondingly, and after partialing out the effects of duration of drinking at more than 100 drinks per month, frontal WM NAA concentrations in HD inversely correlated with age (r = −0.39; p = 0.01), whereas parietal GM mI in HD increased with age (r = 0.35; p = 0.02). The same relationships were insignificant in LD (r < 0.21; p > 0.15).
Table 3 shows metabolite comparisons in male participants only. Compared with group differences in the entire sample, frontal WM NAA and parietal GM mI measures lost statistical significance, whereas Cr measures in frontal and parietal WM and in the brainstem became significantly higher in male HD than male LD. Similar to the entire sample, the effect sizes, i.e., the significance or magnitude of almost all metabolite differences, increased when the analyses were restricted to alcohol-dependent men.
Table 3.
Metabolite Concentrations (Arbitrary Units) in LD and HD and in Alcohol-Dependent HD: Male Participants Only (mean ± SD)
| Measure | Region of interest | Male LD (n = 32) | Male HD (n = 38) | Male LD vs. male HD | Male dependent HD (n = 33) | Male LD vs. male dependent HD |
|---|---|---|---|---|---|---|
| NAA | Fro WM | 31.63 ± 3.91 | 31.26 ± 3.81 | NS | 31.11 ± 3.91 | NS |
| Cr | Fro WM | 18.22 ± 1.81 | 19.49 ± 2.57 | F(2,63) = 2.53; p = 0.03 | 19.66 ± 2.53 | F(2,58) = 7.09; p = 0.01 |
| Par WM | 16.95 ± 1.89 | 18.13 ± 2.29 | F(2,53) = 4.57; p = 0.04 | 18.54 ± 2.04 | F(2,48) = 8.12; p = 0.006 | |
| Par GM | 19.57 ± 2.01 | 21.21 ± 2.72 | F(2,64) = 7.62; p = 0.008 | 21.52 ± 2.55 | F(2,59) = 11.70; p = 0.001 | |
| Brainstem | 27.81 ± 2.95 | 29.78 ± 4.99 | F(2,66) = 3.83; p = 0.05 | 29.20 ± 4.42 | F(2,61) = 2.38; p = 0.13 | |
| Cho | Par GM | 5.01 ± 0.60 | 5.31 ± 0.79 | F(2,63) = 2.88; p = 0.09 | 5.43 ± 0.76 | F(2,58) = 5.50; p = 0.02 |
| mI | Par GM | 17.95 ± 2.43 | 18.95 ± 3.31 | F(2,63) = 1.95; p = 0.17 | 19.24 ± 3.23 | F(2,58) = 2.84; p = 0.10 |
| Par WM | 17.26 ± 2.12 | 18.14 ± 2.96 | F(2,55) = 2.23; p = 0.14 | 18.62 ± 2.55 | F(2,50) = 4.55; p = 0.04 |
Fro, frontal; Par, parietal; NS, not significant.
Effects of FHA
To investigate whether metabolite differences reflect premorbid factors that dispose individuals to heavy drinking rather than being the result of years of heavy drinking, we studied the effects of FHA on brain metabolites. A larger proportion of the HD group than the LD group had a positive FHA (65% vs. 42%; χ2 = 4.5; p < 0.05). Within HD, FH+ individuals (n = 28) tended to be older than FH+ individuals (n = 18; p = 0.06; 43.3 ± 8.7 years versus 38.2 ± 9.2 years). Drinking severity was similar between FH+ and FH− HD samples. Table 4 shows that, after covarying for age, frontal WM NAA in FH− was significantly lower than in FH+ HD (−6%; p = 0.04); note that it was also significantly lower than in FH− LD [−8%; F(2,44) = 7.35; p = 0.01]. Frontal GM NAA also tended to be lower in FH− than FH+ HD (−5%; p = 0.07). This difference was driven by the five female FH+ HD, who had significantly higher frontal GM NAA compared with their male counterparts (p < 0.002), and the only female FH− HD with relatively low frontal GM NAA. Similarly, frontal GM Cr and mI, as well as parietal WM Cr, were at least 10% lower in FH− versus FH+ HD [all F(2,29) > 3.45; p < 0.07]. By contrast, brainstem mI was 22% higher in FH− HD versus FH+ HD (p = 0.01). We did not observe similar effects of FHA in LD, except for 15% higher brainstem mI in 17 FH− LD (24.45 ± 3.83) versus 19 FH− LD [21.22 ± 4.98; F(2,43) = 6.71; p = 0.01]. Thus, across all participants independent of drinking status, FH− individuals had 18% higher brainstem mI than FH+ participants [F(2,86) = 13.36; p = 0.0004].
Table 4.
Metabolite Concentrations (Arbitrary Units) in All HD as a Function of Family History (FH) of Alcoholism (mean ± SD)
| Metabolite | Region of interest | All FH− HD (n = 18) | All FH+ HD (n = 28) | F and p values |
|---|---|---|---|---|
| NAA | Fro WM | 30.04 ± 3.57 | 31.79 ± 4.60 | F(2,37) = 4.77; p = 0.04 |
| Fro GM | 33.43 ± 3.27 | 35.23 ± 5.27a | F(2,29) = 3.53; p = 0.07 | |
| Cr | Par WM | 17.20 ± 2.24 | 19.25 ± 2.42 | F(2,29) = 3.77; p = 0.06 |
| Fro GM | 21.93 ± 2.12 | 24.18 ± 3.67 | F(2,29) = 3.47; p = 0.07 | |
| mI | Fro GM | 18.93 ± 2.08 | 21.13 ± 3.28 | F(2,29) = 3.96; p = 0.06 |
| Brainstemb | 25.92 ± 5.63 | 21.33 ± 5.42c | F(2,40) = 6.52; p = 0.01 |
Fro, frontal; Par, parietal.
Female FH+: n = 5; 39.04 = 2.99; male FH+: n = 17; 34.32 = 5.19; F(2,19) = 13.65; p = 0.002.
Within LD: FH−: n = 17; 24.45 = 3.83; FH+: n = 19; 21.22 = 4.98; F(2,43) = 6.71; p = 0.01.
Female FH+: n = 7; 17.44 = 4.88; male FH+: n = 18; 22.85 = 4.94; F(2,24) = 8.04; p = 0.009.
Effects of Binge Drinking
To investigate whether drinking pattern was associated with specific metabolite abnormalities, we analyzed the effects of binge drinking on regional brain metabolites (Table 5). Fifteen (33%) of 46 HD individuals were classified as binge drinkers according to our working definition. Binge drinkers drank on 15.7 ± 4.0 days of the month over the 3 years preceding the study, compared with 26.9 ± 4.2 days for continual drinkers. They tended to consume more drinks on a drinking day than continual drinkers (p < 0.16; 10.2 ± 4.7 drinks per day versus 8.4 ± 3.7 drinks per day), but overall, they consumed fewer alcoholic drinks per month over the last year (p < 0.05; 137 ± 44 drinks per month versus 239 ± 188 drinks per month) and 3 years (p < 0.06; 153 ± 62 drinks per month versus 244 ± 178 drinks per month). The higher parietal GM metabolite concentrations in HD relative to LD (listed in Table 2) were mostly due to the 15 binge drinkers, who had very high parietal GM metabolite concentrations (all p < 0.02 versus LD). Within the HD group and after covarying for last-year monthly drinking average, binge drinkers compared with nonbingers also had 8 –10% higher parietal GM metabolites (NAA, p = 0.01; Cr, p = 0.001; Cho, p = 0.04; mI, p = 0.03). Eliminating from statistical analyses five binge-drinking women and two female nonbingers increased all parietal GM metabolite group differences in the male sample to 11–19% and strengthened significances. Frontal lobe metabolites were not significantly affected by drinking pattern in this sample.
Table 5.
Parietal GM Metabolite Concentrations (Arbitrary Units) in All HD as a Function of Drinking Pattern (mean ± SD)
| Parietal GM measure | Binge drinkersa (n = 15) | Non–binge drinkers (n = 31) | F and p values |
|---|---|---|---|
| NAA | 35.46 ± 4.30 | 32.72 ± 3.72 | F(3,41) = 7.23; p = 0.01 |
| Cr | 22.91 ± 3.12 | 20.86 ± 2.56 | F(3,41) = 12.09; p = 0.001 |
| Cho | 5.63 ± 0.94 | 5.18 ± 0.60 | F(3,41) = 4.57; p = 0.04 |
| mI | 19.98 ± 3.78 | 18.50 ± 3.02 | F(3,41) = 5.27; p = 0.03 |
All parietal measures: F(2,62) > 6.16; p < 0.02 versus LD.
Associations of 1H MRSI Measures With Drinking Severity, Cognition, and Electrophysiological Measures
Within the HD group, greater lifetime alcohol consumption correlated with lower brainstem NAA (r = −0.38; p = 0.01) and higher thalamic Cho (r = 0.33; p = 0.02). More average monthly drinks consumed over the lifetime correlated with higher parietal GM mI and Cr, higher thalamic Cho (all r = 0.36; p = 0.02), and higher cerebellar Cr (r = 0.32; p = 0.04). Similarly, all of these measures, except thalamic Cho, also correlated with current drinking severity, expressed as the average monthly drinks during the current drinking phase (all r > 0.34; p < 0.02). Figure 2 shows some of these correlations. In FH− HD, lower frontal WM NAA tended to correlate with greater lifetime alcohol consumption (r = −0.43; p = 0.09), whereas no such correlation was observed in FH+ HD or the entire HD group. Time since last drink was not related to any of the significant metabolite group differences (all r < 0.4; all p > 0.2).
Fig. 2.
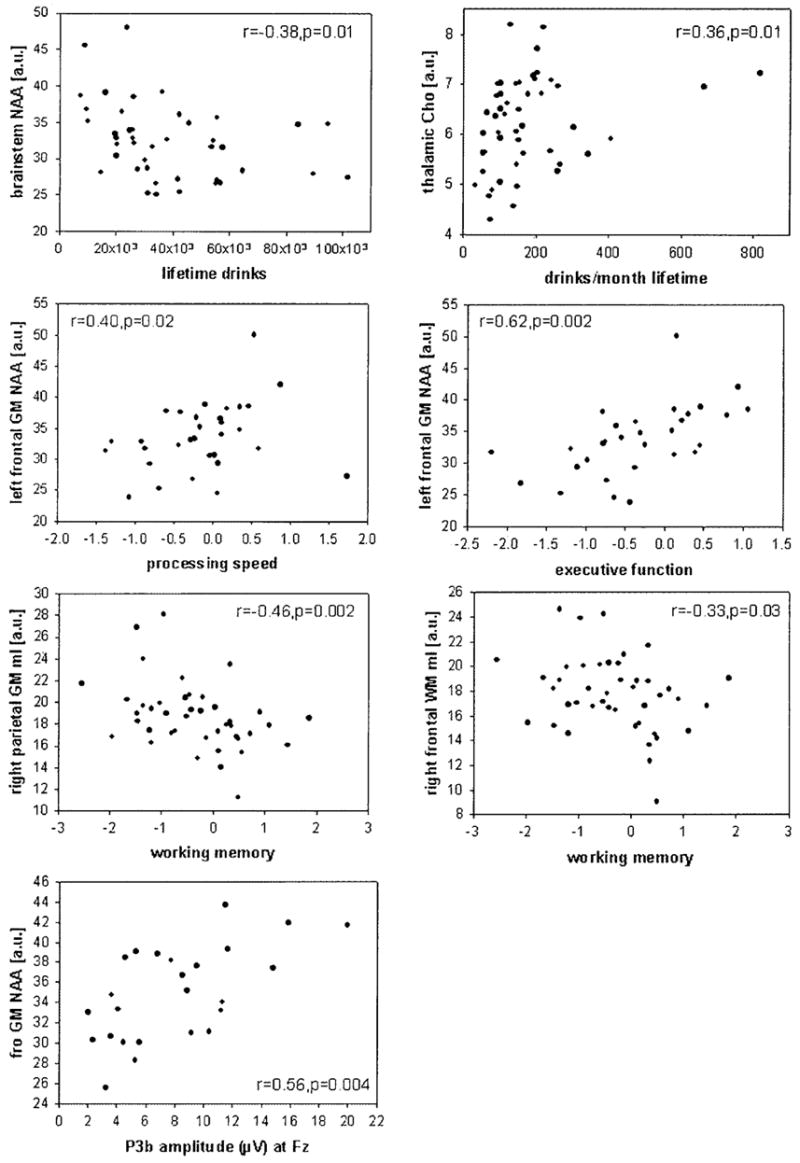
Regional brain metabolite concentrations, expressed in arbitrary units (a.u.), plotted against measures of drinking severity, domain summary scores of neuropsychological functioning, and auditory P3b amplitude (μV). Spearman correlations and significance levels are indicated for each plot.
The presence of cognitive impairment in most alcoholics seems to be well established, and the degree of cognitive functioning in social drinkers seems to depend on drinking severity (Parsons and Nixon, 1998). Our HD sample was significantly impaired on measures of working memory, processing speed, attention, executive function, and balance (Rothlind et al., 2004, unpublished data). We hypothesized that regional metabolite abnormalities in HD are associated with lower cognitive performance—in particular, that lower frontal lobe NAA is associated with lower executive functioning and working memory. Figure 2 contains plots of selected correlations observed in HD. Within the frontal lobe of the HD group, NAA reductions in left GM and in left and right WM were all associated with impaired executive functioning (r = 0.62, p = 0.002; r = 0.34, p = 0.03; and r = 0.32, p = 0.04, respectively). Higher mI in both WM and GM of the right frontal lobe was correlated with lower working memory (both r = −0.33; p = 0.03 and 0.07, respectively). In addition, lower left frontal GM NAA tended to correlate with lower working memory (r = 0.29; p = 0.10) and correlated with slower processing speed (r = 0.4; p = 0.02). In addition, exploratory analyses in HD not based on a priori hypotheses yielded a large number of correlations between metabolite measures and neuropsychological test performance. For example, within the parietal lobe of the HD group, higher mI in both left and right GM correlated with lower working memory (r = −0.44, p = 0.003 and r = −0.46, p = 0.002, respectively), whereas higher left GM mI and left WM mI also correlated with lower executive function (r = −0.32, p = 0.04 and r = −0.43, p = 0.02, respectively). Furthermore, in HD, lower general verbal intellectual ability (AMNART) was associated with lower GM NAA and lower WM Cr in the right frontal lobes (both r > 0.31; p = 0.04). Higher Cho in left parietal GM was also associated with lower working memory (r = −0.31; p = 0.05). The corresponding (or other significant) relationships were not observed in LD, which suggests that heavy drinking disrupts these cognitive processes subserved by both frontal and parietal lobes.
We further hypothesized that in HD, (1) lower frontal lobe NAA is associated with lower P3a amplitude, a measure of an alerting process that originates in the frontal cortex (Courchesne et al., 1975; Knight, 1984); (2) lower NAA in parietal and temporal lobes is associated with lower P3b amplitude (because lesion studies show that temporal/parietal lesions abolish the P3b); and (3) WM NAA throughout the brain is associated with longer P3a and P3b latency, measures of stimulus classification speed (Kutas et al., 1977; Polich, 1986).
Frontal NAA in HD correlated with auditory P3b amplitudes at Fz and Cz (GM: r > 0.56, p < 0.004; WM: r > 0.37, p < 0.03; Fig. 2), but not at Pz (r < 0.32; p < 0.12). Higher Cr, Cho, and mI concentrations in temporal GM were all correlated with longer visual P3a latency, primarily at Cz (r > 0.4; p < 0.01). Auditory P3b latency at Fz correlated with mI in parietal and temporal GM, as well as in temporal WM (r > 0.44; p < 0.009). Most of the correlations that were significant at a single midline electrode were also significant with the corresponding regional averages. Relationships between metabolite measures and P3a amplitudes were not significant. Furthermore, exploratory analyses in LD showed no significant correlations of metabolite levels with electrophysiological characteristics.
Immune Suppression
As part of a larger study of the effects of heavy drinking on human immunodeficiency virus disease progression, all participants’ immune systems were assessed via CD4 measurements. CD4 counts were significantly higher in HD (p = 0.02; 931 ± 304/mm3) compared with LD (800 ± 247/mm3). FH+ HD had significantly higher CD4 counts (p = 0.03; 1016 ± 293 copies per milliliter) than FH− HD (800± 278 copies per milliliter), whereas among LD, FHA did not modulate CD4 counts.
DISCUSSION
The major findings of this study were (1) lower NAA in frontal WM of HD than LD, driven by a large group difference in a small sample of women; (2) higher mI, Cho, and Cr in parietal GM of HD than LD, more pronounced in alcohol-dependent than alcohol-abusing drinkers; (3) lower NAA in the frontal lobe and higher mI in the brainstem of FH− than FH+ HD; (4) higher parietal GM metabolites including NAA in binge drinkers than nonbingers; (5) correlations between drinking severity and metabolite concentrations in HD; (6) correlations of lower executive functioning and working memory with lower frontal NAA in HD; and (7) correlations of P3b latencies and amplitudes with metabolite changes in HD. Lower NAA suggests axonal damage in the frontal WM of women. Higher Cr, Cho, and mI in parietal GM suggest gliosis, because Cr and Cho concentrations are higher in astrocytes and oligodendrocytes than in neurons (Urenjak et al., 1993) and because mI is a putative astrocyte marker (Brand et al., 1993). Alternatively, because Cr and mI are cerebral osmolytes (Ross and Bluml, 2001; Ross and Michaelis, 1994), their higher concentrations in HD may also reflect a chronic osmotic state different from that of LD or an acute osmotic imbalance associated with potential subclinical withdrawal. In response to frequently high blood and brain alcohol levels, the concentration of cerebral osmolytes may adapt regionally, depending on the differential sensitivity of brain regions to osmotic changes. The absence of correlations, however, between time since the last alcoholic drink and those metabolite concentrations that differentiate HD from LD speaks against a withdrawal-associated osmotic imbalance. Therefore, we posit that our results reflect chronic brain damage associated with long-term heavy drinking or factors in the participant’s history that were not assessed but preceded the onset of heavy drinking.
The study shows further that a positive FHA does not predispose to greater NAA loss or glial injury. Rather, NAA and mI measures suggest that a positive FHA seems to protect against alcohol-induced frontal neuronal/axonal damage and brainstem gliosis, respectively. NAA measures suggest that bingeing HD have less parietal neuron damage than continual HD. High Cr and other metabolite measures suggest that binge drinking is associated with gliosis and/or that it reflects parietal GM sequelae of a chronic hyperosmolar state when compared with LD and with a more continual heavy drinking pattern. No significant adverse frontal metabolite effects were associated with binge drinking. Our sample size was too small to assess rigorously how gender modulates the relationships among FHA, drinking pattern, and brain metabolites.
Finally, lower NAA in the frontal WM of active HD, driven by a small number of women and older age, suggests age-related axonal damage, which seems greater in women than men despite similar drinking severity. These results support the notion that WM in the frontal lobe is particularly vulnerable to the long-term effects of heavy drinking (e.g., Sullivan, 2000) and that women may be more vulnerable to chronic alcohol-induced axonal damage than men. Moreover, metabolite abnormalities in frontal and other brain regions correlated with functional deficits reflected in lower cognitive test performance and electrophysiological responses to external stimuli. Compared with alcoholics typically described in the MRI literature, cumulative lifetime alcohol consumption in these non–treatment-seeking individuals was much below that of treated alcoholics, and metabolite group differences were relatively subtle. Nevertheless, this study demonstrates that long-term heavy alcohol consumption in socially functioning individuals has significant detrimental effects on important cognitive domains and information processing.
Family History of Alcoholism
Genetic factors play an important role in the risk for alcoholism. Studies have shown that FH+ individuals are at higher risk for early development of alcoholism than their FH− counterparts (Cloninger, 1987; Schuckit, 1984; Tarter et al., 1985), and reports in children and adolescents suggest that a positive FHA contributes to impaired cognition and lower P3 event-related potential amplitude (Berman et al., 1993; Drejer et al., 1985; Hill and Steinhauer, 1993; Polich et al., 1994). Furthermore, nonalcoholic high-risk individuals also have a different sensitivity to acute alcohol than low-risk individuals (e.g., Newlin and Thomson 1999). Brain neurochemical or metabolic differences may be related to these different vulnerabilities, sensitivities, and the reinforcing and toxic properties of alcohol as a function of FH. Our sample of FH+ HD had higher NAA in the frontal lobe and lower mI in the brainstem than FH− HD, despite similar drinking severities. Thus, lower frontal WM NAA in the entire sample was driven by lower NAA in FH− HD. Together, these results raise the possibility that FH positivity imparts some degree of protection against alcohol-induced frontal neuronal/axonal damage and brainstem gliosis in HD or, conversely, that FH− HD are more vulnerable to brain damage than FH+ HD. Because our analyses showed that NAA and Cr in frontal GM tended to differentiate FH− and FH+ HD and did not differentiate LD from HD, but showed a significant alcohol status × FHA status interaction, we conclude that the major LD/HD group differences observed in this study reflect the long-term effects of heavy drinking per se but not premorbid factors. This interpretation is further supported by the correlations we observed between the amount of alcohol consumed and the degree of metabolite abnormalities in HD (described above).
Drinking Pattern (Binge Drinking)
Animal models of controlled drinking suggest that binge drinking, because of effects of alcohol toxicity or repeated withdrawal episodes, leads to neurodegeneration in the entorhinal cortex, hippocampi, and olfactory bulb (Crews et al., 2000 and references cited therein) (Agartz et al., 1999; Crews, 1999; Fadda and Rossetti, 1998; Hunt, 1993b) that may adversely affect spatial learning (Obernier et al., 2002). In humans, binge drinking may be more damaging to the brain than continual heavy alcohol consumption (Agartz et al., 1999; Crews, 1999; Crews et al., 2000; Fadda and Rossetti, 1998; Hunt, 1993b). Thus, we investigated whether drinking pattern had an effect on the nature and degree of metabolite brain damage in chronic HD. According to our working definition of binge drinking, bingeing was the preferred way of prior-3-year alcohol consumption in 33% of our HD. Significant changes associated with binge drinking were present only in parietal GM. Higher Cho, mI, and Cr in binge drinkers is suggestive of gliosis or regional metabolite changes, possibly secondary to hyperosmolarity. Higher NAA in the binge drinkers is counterintuitive; it does not support the hypothesis of increased neuronal damage in binge drinkers and may reflect our limited knowledge of NAA’s function in the brain.
Functional Relevance of Metabolite Measures
We observed associations of contiguous measures of drinking severity, cognitive abilities (primarily executive function and working memory), and electrophysiological characteristics with frontal, parietal, and temporal metabolite measures that underscore their functional relevance. These correlations further support our hypotheses that chronic heavy drinking decreases frontal NAA levels and increases compounds associated with cell turnover and gliosis throughout the brain. The ensuing brain damage is relevant to cognitive functioning in active HD and may interfere with day-to-day routines or with a HD’s recognition of a potential drinking problem. The most significant correlations pointed to an association of frontal NAA loss with impaired executive functioning and processing speed, whereas parietal GM mI abnormalities were associated with deficits in working memory. Frontal GM NAA loss was also significantly associated with lower P3b amplitudes, which may reflect impaired processing of incoming information (Johnson, 1993). Studies have shown that longer P3 latency is associated with inferior cognitive performance in healthy controls (e.g., Polich et al., 1983, 1990; Polich and Martin, 1992) and in patients with dementing illnesses (e.g., Brown et al., 1982; Homberg et al., 1986; O’Donnell et al., 1987; Polich et al., 1986, 1990; Squires et al., 1979). This relationship seems to be present also in chronic HD in the presence of higher Cr, Cho, and mI in temporal and parietal GM, which are regional measures of gliosis and cell turnover. Most of the predicted associations between metabolite levels and event-related potential measures, however, were not observed, prompting us to report only correlations with p < 0.01. Nevertheless, existing correlations between metabolite levels and function support the hypothesis that in active HD, metabolite abnormalities are associated with changes in cognitive processing.
Comparison With Studies in Abstinent Alcoholics
The magnitude and anatomical distribution of the observed drinking effects seem to differ from those reported in clinical samples of abstinent alcoholics. Those studies, including our own in an elderly sample of recovering alcoholics (Fein et al., 1994), found lower NAA in frontal GM and cerebellar vermis of the order of 10 –20%, suggesting neuron damage (Jagannathan et al., 1996; Seitz et al., 1999). Less frequently was NAA loss in WM reported (Goldmann et al., 2000; Schweinsburg et al., 2001). Increased mI in WM and thalamus in abstinent alcoholics suggests glial changes (Schweinsburg et al., 2000, 2001). The chronic HD in our study had frontal WM NAA loss of the order of 5% (men) and 13% (women), suggesting frontal axonal damage, but no significant NAA loss in frontal GM or cerebellum and no significant subcortical metabolite alterations. Instead, parietal GM showed significantly higher mI, Cho, and Cr, suggesting regionally specific glial and cell membrane alterations or effects of osmotic imbalance in active HD. The different pattern and degree of metabolite abnormalities between active HD and abstinent recovering alcoholics may be due to several factors: (1) lower severity and prevalence of alcoholism in our community sample of HD, (2) less subclinical comorbid neuropsychopathology in our study sample, (3) age, and/or (4) experimental differences.
Eighty-nine percent of our chronic HD met criteria for current alcohol dependence, and 88% were physiologically dependent. By contrast, the typical treatment sample is almost exclusively physiologically dependent on alcohol. That alcohol dependence is associated with greater brain metabolite damage than abuse was confirmed by our findings of greater alcohol effects when abusing HD were eliminated from analyses (Tables 2 and 3). However, even the dependent HD had a smaller magnitude of metabolite damage than the typical short-term abstinent alcoholic described. This may be due to lower cumulative lifetime alcohol consumption (by comparison, alcoholics in treatment studied in this laboratory consumed approximately twice the amount of alcohol as our HD sample over a 50% longer heavy drinking period), younger age (the typical alcoholic in the literature is 47 years old), or fewer episodes of withdrawal and/or detoxification, the number of which contributes to changes in brain function in animals and humans (Duka et al., 2003 and references therein). Furthermore, compared with alcoholics in treatment samples, socially functioning HD are likely to have less obvious comorbid central nervous system psychopathology, which may escape screening in the clinical research setting.
Finally, differences in experimental methods (spectroscopic imaging versus single-volume MRS; short versus long TE) may contribute to the different extent of metabolite damage observed in active HD and abstinent alcoholics. However, our studies in abstinent alcoholics that apply the same short TE MRSI acquisition sequence used here demonstrate metabolite differences of the order of those detected with single-volume methods at short TE (Durazzo et al., 2004). This makes it unlikely that the main metabolite differences between our HD and previously described abstinent alcoholics is primarily due to experimental parameters. Thus, we believe that our community-dwelling active HD have a lower severity of alcoholism than the typical abstinent alcoholic described in the literature and less comorbid neuropsychopathology, both of which are associated with less brain metabolite damage. Prospective studies are necessary that directly contrast active HD with abstinent alcoholics matched on severity and prevalence of alcoholism and comorbid psychopathology.
In conclusion, our results demonstrate that relatively young, non–treatment-seeking active HD have measurable brain metabolite abnormalities, which are modulated in a complex way by FHA, drinking pattern, age, gender, and alcohol use disorder diagnosis. Most importantly, brain metabolite damage in socially functioning active HD is associated with lower cognitive function.
Acknowledgments
This article is dedicated to the memory of Linda Rogers, PhD (1946 –2003). We thank our staff for recruiting, screening, and assessing study participants, who are appreciated for so generously having donated their time and effort.
Funded by an NIAAA program project grant (AA11493), originally awarded to Dr. George Fein.
References
- Agartz I, Momenan R, Rawlings RR, Kerich MJ, Hommer DW. Hippocampal volume in patients with alcohol dependence. Arch Gen Psychiatry. 1999;56:356–363. doi: 10.1001/archpsyc.56.4.356. [DOI] [PubMed] [Google Scholar]
- Ashburner J, Friston KJ. Voxel-based morphometry—the methods. Neuroimage. 2000;11:805–821. doi: 10.1006/nimg.2000.0582. [DOI] [PubMed] [Google Scholar]
- Berman SM, Whipple SC, Fitch RJ, Noble EP. P3 in young boys as a predictor of adolescent substance use. Alcohol. 1993;10:69–76. doi: 10.1016/0741-8329(93)90055-s. [DOI] [PubMed] [Google Scholar]
- Brand A, Richter-Landsberg C, Leibfritz D. Multinuclear NMR studies on the energy metabolism of glial and neuronal cells. Dev Neurosci. 1993;15:289–298. doi: 10.1159/000111347. [DOI] [PubMed] [Google Scholar]
- Brown WS, Marsh JT, LaRue A. Event-related potentials in psychiatry: differentiating depression and dementia in the elderly. Bull Los Angeles Neurol Soc. 1982;47:91–107. [PubMed] [Google Scholar]
- Cloninger CR. Neurogenetic adaptive mechanisms in alcoholism. Science. 1987;236:410–416. doi: 10.1126/science.2882604. [DOI] [PubMed] [Google Scholar]
- Collins DL, Peters TM, Dai W, Evans AC. Model based segmentation of individual brain structures from MRI data. SPIE Visualizat Biomed Comput. 1994;1808:10–23. [Google Scholar]
- Courchesne E, Hillyard SA, Galambos R. Stimulus novelty, task relevance and the visual evoked potential in man. Electroencephalogr Clin Neurophysiol. 1975;39:131–143. doi: 10.1016/0013-4694(75)90003-6. [DOI] [PubMed] [Google Scholar]
- Crews FT. Alcohol and neurodegeneration. CNS Drug Rev. 1999;5:379–394. [Google Scholar]
- Crews FT, Braun CJ, Hoplight B, Switzer RC, III, Knapp DJ. Binge ethanol consumption causes differential brain damage in young adolescent rats compared with adult rats. Alcohol Clin Exp Res. 2000;24:1712–1723. [PubMed] [Google Scholar]
- Dawant BM, Hartmann SL, Thirion JP, Maes F, Vandermeulen D, Demaerel P. Automatic 3-D segmentation of internal structures of the head in MR images using a combination of similarity and free-form transformations: part I, methodology and validation on normal subjects. IEEE Trans Med Imaging. 1999;18:909–916. doi: 10.1109/42.811271. [DOI] [PubMed] [Google Scholar]
- Drejer K, Theilgaard A, Teasdale TW, Schulsinger F, Goodwin DW. A prospective study of young men at high risk for alcoholism: neuropsychological assessment. Alcohol Clin Exp Res. 1985;9:498–502. doi: 10.1111/j.1530-0277.1985.tb05590.x. [DOI] [PubMed] [Google Scholar]
- Duka T, Townshend JM, Collier K, Stephens DN. Impairment in cognitive functions after multiple detoxifications in alcoholic inpatients. Alcohol Clin Exp Res. 2003;27:1563–1572. doi: 10.1097/01.ALC.0000090142.11260.D7. [DOI] [PubMed] [Google Scholar]
- Durazzo TC, Gazdzinski S, Meyerhoff DJ. Brain metabolite concentrations and cognition during short-term abstinence from alcohol. Alcohol Clin Exp Res. 2004 doi: 10.1111/j.1530-0277.2006.00060.x. in press. [DOI] [PubMed] [Google Scholar]
- Fadda F, Rossetti ZL. Chronic ethanol consumption: from neuro-adaptation to neurodegeneration. Prog Neurobiol. 1998;56:385–431. doi: 10.1016/s0301-0082(98)00032-x. [DOI] [PubMed] [Google Scholar]
- Fein G, Bachman L, Fisher S, Davenport L. Cognitive impairments in abstinent alcoholics. West J Med. 1990;152:531–537. [PMC free article] [PubMed] [Google Scholar]
- Fein G, Biggins CA, MacKay S. Delayed latency of the P3A ERP component in HIV disease: progressive effects with increasing cognitive impairment. Arch Neurol. 1995;52:1109–1118. doi: 10.1001/archneur.1995.00540350103022. [DOI] [PubMed] [Google Scholar]
- Fein G, Di Sclafani V, Cardenas VA, Goldmann H, Tolou-Shams M, Meyerhoff DJ. Cortical gray matter loss in treatment-naive alcohol dependent individuals. Alcohol Clin Exp Res. 2002;26:558–564. [PMC free article] [PubMed] [Google Scholar]
- Fein G, Meyerhoff DJ, Di Sclafani V, Ezekiel F, Poole N, MacKay S, Dillon WP, Constans JM, Weiner MW. 1H Magnetic Resonance Spectroscopic Imaging Separates Neuronal From Glial Changes in Alcohol-Related Brain Atrophy (NIAAA Research Monograph No. 27) NIH; Bethesda, MD: 1994. pp. 227–241. [Google Scholar]
- Gee JC, Reivich M, Bajcsy R. Elastically deforming 3D atlas to match anatomical brain images. J Comput Assist Tomogr. 1993;17:225–236. doi: 10.1097/00004728-199303000-00011. [DOI] [PubMed] [Google Scholar]
- Goldmann H, Tolou-Shams M, Salas G, Fein G, Meyerhoff DJ. 1H MRS in the brain of light and heavy drinkers: alcohol and neurons. Seventh Annual Meeting of the International Society of Magnetic Resonance in Medicine, Denver, CO, vol. 2; ISMRM, Berkeley, CA. 2000. p. 1165. [Google Scholar]
- Grant B. The influence of comorbid major depression and substance use disorders on alcohol and drug treatment: results of a national survey. In: Onken LS, Blaine JD, Genser S, Horton AM Jr, editors. National Institute on Drug Abuse Technical Review Meeting: Comorbid Mental Disorders (NIDA Research Monograph No. 172) US Department of Health and Human Services, National Institutes of Health; Rockville, MD: 1994a. pp. 4–15. [PubMed] [Google Scholar]
- Grant BF. Alcohol consumption, alcohol abuse and alcohol dependence. The United States as an example. Addiction. 1994b;89:1357–1365. doi: 10.1111/j.1360-0443.1994.tb03730.x. [DOI] [PubMed] [Google Scholar]
- Harwood H, Thomson M, Nesmith T. Healthcare Reform and Substance Abuse Treatment: The Cost of Financing Under Alternative Approaches. Lewin-VHI; Fairfax, VA: 1994. [Google Scholar]
- Hill SY, Steinhauer SR. Assessment of prepubertal and postpubertal boys and girls at risk for developing alcoholism with P300 from a visual discrimination task. J Stud Alcohol. 1993;54:350–358. doi: 10.15288/jsa.1993.54.350. [DOI] [PubMed] [Google Scholar]
- Homberg V, Hefter H, Granseyer G, Strauss W, Lange H, Hennerici M. Event-related potentials in patients with Huntington’s disease and relatives at risk in relation to detailed psychometry. Electroencephalogr Clin Neurophysiol. 1986;63:552–569. doi: 10.1016/0013-4694(86)90143-4. [DOI] [PubMed] [Google Scholar]
- Hunt WA. Are binge drinkers more at risk of developing brain damage? Alcohol. 1993a;10:559–561. doi: 10.1016/0741-8329(93)90083-z. [DOI] [PubMed] [Google Scholar]
- Hunt WA. Neuroscience research: how has it contributed to our understanding of alcohol abuse and alcoholism? A review. Alcohol Clin Exp Res. 1993b;17:1055–1065. doi: 10.1111/j.1530-0277.1993.tb05664.x. [DOI] [PubMed] [Google Scholar]
- Iosifescu DV, Shenton ME, Warfield SK, Kikinis R, Dengler J, Jolesz FA, McCarley RW. An automated registration algorithm for measuring MRI subcortical brain structures. Neuroimage. 1997;6:13–25. doi: 10.1006/nimg.1997.0274. [DOI] [PubMed] [Google Scholar]
- Jagannathan NR, Desai NG, Raghunathan P. Brain metabolite changes in alcoholism: an in vivo proton magnetic resonance spectroscopy (MRS) study. Magn Reson Imaging. 1996;14:553–557. doi: 10.1016/0730-725x(96)00048-3. [DOI] [PubMed] [Google Scholar]
- Johnson R., Jr On the neural generators of the P300 component of the event-related potential. Psychophysiology. 1993;30:90–97. doi: 10.1111/j.1469-8986.1993.tb03208.x. [DOI] [PubMed] [Google Scholar]
- Knight RT. Decreased response to novel stimuli after prefrontal lesions in man. Electroencephalogr Clin Neurophysiol. 1984;59:9–20. doi: 10.1016/0168-5597(84)90016-9. [DOI] [PubMed] [Google Scholar]
- Kuroda Y, Wada A, Yamazaki T, Nagayama K. Postacquisition data processing method for suppression of the solvent signal. J Magn Reson. 1989;84:604–610. [Google Scholar]
- Kutas M, McCarthy G, Donchin E. Augmenting mental chronometry: the P300 as a measure of stimulus evaluation time. Science. 1977;197:792–795. doi: 10.1126/science.887923. [DOI] [PubMed] [Google Scholar]
- Mann RE, Sobell LC, Sobell MB, Pavan D. Reliability of a family tree questionnaire for assessing family history of alcohol problems. Drug Alcohol Depend. 1985;15:61–67. doi: 10.1016/0376-8716(85)90030-4. [DOI] [PubMed] [Google Scholar]
- McGue M. Genes, environment, and the etiology of alcoholism. In: Zucker R, Boyd G, Howard J, editors. The Development of Alcohol Problems: Exploring the Biopsychosocial Matrix of Risk (NIAAA Research Monograph No. 26) US Government Printing Office; Washington, DC: 1994. pp. 1–40. [Google Scholar]
- Meyerhoff DJ, Bloomer C, Cardenas V, Norman D, Weiner MW, Fein G. Elevated subcortical choline metabolites in cognitively and clinically asymptomatic HIV+ patients. Neurology. 1999;52:995–1003. doi: 10.1212/wnl.52.5.995. [DOI] [PubMed] [Google Scholar]
- Newlin DB, Thomson JB. Chronic tolerance and sensitization to alcohol in sons of alcoholics: II. Replication and reanalysis. Exp Clin Psychopharmacol. 1999;7:234–243. doi: 10.1037//1064-1297.7.3.234. [DOI] [PubMed] [Google Scholar]
- Obernier JA, White AM, Swartzwelder HS, Crews FT. Cognitive deficits and CNS damage after a 4-day binge ethanol exposure in rats. Pharmacol Biochem Behav. 2002;72:521–532. doi: 10.1016/s0091-3057(02)00715-3. [DOI] [PubMed] [Google Scholar]
- O’Donnell BF, Squires NK, Martz MJ, Chen JR, Phay AJ. Evoked potential changes and neuropsychological performance in Parkinson’s disease. Biol Psychol. 1987;24:23–37. doi: 10.1016/0301-0511(87)90097-4. [DOI] [PubMed] [Google Scholar]
- Oscar-Berman M. Neuropsychological Vulnerabilities in Chronic Alcoholism: Review of NIAAA’s Neuroscience and Behavioral Research Portfolio (NIAAA Research Monograph No. 34) National Institute on Alcohol Abuse and Alcoholism; Bethesda, MD: 2000. pp. 437–472. [Google Scholar]
- Parsons OA, Nixon SJ. Neurobehavioral sequelae of alcoholism. Neurol Clin. 1993;11:205–218. [PubMed] [Google Scholar]
- Parsons OA, Nixon SJ. Cognitive functioning in sober social drinkers: a review of the research since 1986. J Stud Alcohol. 1998;59:180–190. doi: 10.15288/jsa.1998.59.180. [DOI] [PubMed] [Google Scholar]
- Polich J. Attention, probability, and task demands as determinants of P300 latency from auditory stimuli. Electroencephalogr Clin Neurophysiol. 1986;63:251–259. doi: 10.1016/0013-4694(86)90093-3. [DOI] [PubMed] [Google Scholar]
- Polich J, Ehlers CL, Otis S, Mandell AJ, Bloom FE. P300 latency reflects the degree of cognitive decline in dementing illness. Electroencephalogr Clin Neurophysiol. 1986;63:138–144. doi: 10.1016/0013-4694(86)90007-6. [DOI] [PubMed] [Google Scholar]
- Polich J, Howard L, Starr A. P300 latency correlates with digit span. Psychophysiology. 1983;20:665–669. doi: 10.1111/j.1469-8986.1983.tb00936.x. [DOI] [PubMed] [Google Scholar]
- Polich J, Ladish C, Bloom FE. P300 assessment of early Alzheimer’s disease. Electroencephalogr Clin Neurophysiol. 1990;77:179–189. doi: 10.1016/0168-5597(90)90036-d. [DOI] [PubMed] [Google Scholar]
- Polich J, Martin S. P300, cognitive capacity, and personality: a correlations study of university undergraduates. Pers Individ Diff. 1992;13:533–543. [Google Scholar]
- Polich J, Pollock V, Bloom F. Meta-analysis of P300 amplitude from males at risk for alcoholism. Psychol Bull. 1994;115:55–73. doi: 10.1037/0033-2909.115.1.55. [DOI] [PubMed] [Google Scholar]
- Ratti MT, Soragna D, Sibilla L, Giardini A, Albergati A, Savoldi F, Bo P. Cognitive impairment and cerebral atrophy in “heavy drinkers. Prog Neuropsychopharmacol Biol Psychiatry. 1999;23:243–258. doi: 10.1016/s0278-5846(98)00103-1. [DOI] [PubMed] [Google Scholar]
- Rosenbloom MJ, Pfefferbaum A, Sullivan EV. Structural brain alterations associated with alcoholism. Alcohol Health Res World. 1995;19:266–272. [PMC free article] [PubMed] [Google Scholar]
- Ross B, Bluml S. Magnetic resonance spectroscopy of the human brain. Anat Rec. 2001;265:54–84. doi: 10.1002/ar.1058. [DOI] [PubMed] [Google Scholar]
- Ross B, Michaelis T. Clinical applications of magnetic resonance spectroscopy. Magn Reson Q. 1994;10:191–247. [PubMed] [Google Scholar]
- Schuckit MA. Subjective responses to alcohol in sons of alcoholics and control subjects. Arch Gen Psychiatry. 1984;41:879–884. doi: 10.1001/archpsyc.1984.01790200061008. [DOI] [PubMed] [Google Scholar]
- Schuff N, Ezekiel F, Gamst A, Amend D, Capizzano A, Maudsley AA, Weiner MW. Region and tissue differences of metabolites in normally aged brain using 1H magnetic resonance spectroscopic imaging. Magn Reson Med. 2001;45:899–907. doi: 10.1002/mrm.1119. [DOI] [PMC free article] [PubMed] [Google Scholar]
- Schweinsburg BC, Taylor MJ, Alhassoon OM, Videen JS, Brown GG, Patterson TL, Berger F, Grant I. Chemical pathology in brain white matter of recently detoxified alcoholics: a 1H magnetic resonance spectroscopy investigation of alcohol-associated frontal lobe injury. Alcohol Clin Exp Res. 2001;25:924–934. [PubMed] [Google Scholar]
- Schweinsburg BC, Taylor MJ, Videen JS, Alhassoon OM, Patterson TL, Grant I. Elevated myoinositol in gray matter of recently detoxified but not long-term alcoholics: a preliminary MR spectroscopy study. Alcohol Clin Exp Res. 2000;24:699–770. [PubMed] [Google Scholar]
- Seitz D, Widmann U, Seeger U, Nagele T, Klose U, Mann K, Grodd W. Localized proton magnetic resonance spectroscopy of the cerebellum in detoxifying alcoholics. Alcohol Clin Exp Res. 1999;23:158–163. [PubMed] [Google Scholar]
- Shattuck DW, Sandor-Leahy SR, Schaper KA, Rottenberg DA, Leahy RM. Magnetic resonance image tissue classification using a partial volume model. Neuroimage. 2001;13:856–876. doi: 10.1006/nimg.2000.0730. [DOI] [PubMed] [Google Scholar]
- Skinner HA, Sheu WJ. Reliability of alcohol use indices. The Lifetime Drinking History and the MAST. J Stud Alcohol. 1982;43:1157–1170. doi: 10.15288/jsa.1982.43.1157. [DOI] [PubMed] [Google Scholar]
- Sobell LC, Sobell MB. Timeline follow-back: a technique for assessing self-reported alcohol consumption. In: Litten R, Allen J, editors. Measuring Alcohol Consumption. Humana Press; Totowa, NJ: 1992. pp. 41–72. [Google Scholar]
- Sobell LC, Sobell MB, Riley DM, Schuller R, Pavan DS, Cancilla A, Klajner F, Leo GI. The reliability of alcohol abusers’ self-reports of drinking and life events that occurred in the distant past (published erratum appears in J Stud Alcohol 1989;50:92) J Stud Alcohol. 1988;49:225–232. doi: 10.15288/jsa.1988.49.225. [DOI] [PubMed] [Google Scholar]
- Soher BJ, Vermathen P, Schuff N, Wiedermann D, Meyerhoff DJ, Weiner MW, Maudsley AA. Short TE in vivo (1)H MR spectroscopic imaging at 1.5 T: acquisition and automated spectral analysis. Magn Reson Imaging. 2000;18:1159–1165. doi: 10.1016/s0730-725x(00)00212-5. [DOI] [PubMed] [Google Scholar]
- Squires NK, Galbraith G, Aine C. Event-related potentials assessment of sensory and cognitive deficits in the mentally retarded. In: Lehmann D, Callaway E, editors. Human Evoked Potentials: Applications and Problems. Plenum Press; New York: 1979. pp. 397–413. [Google Scholar]
- Studholme C, Cardenas V, Weiner M. Multi-scale image and multi-scale deformation of brain anatomy for building average brain atlases. Proceedings SPIE Medical Imaging. 2001a;4322:557–568. [Google Scholar]
- Studholme C, Novotny E, Zubal IG, Duncan JS. Estimating tissue deformation between functional images induced by intracranial electrode implantation using anatomical MRI. Neuroimage. 2001b;13:561–576. doi: 10.1006/nimg.2000.0692. [DOI] [PubMed] [Google Scholar]
- Sullivan EV. Human brain vulnerability to alcoholism: evidence from neuroimaging studies. In: Noronha A, Eckardt M, Warren K, editors. Review of NIAAA’s Neuroscience and Behavioral Research Portfolio (NIAAA Research Monograph No. 34) National Institute on Alcohol Abuse and Alcoholism; Bethesda, MD: 2000. pp. 473–508. [Google Scholar]
- Tarter RE, Alterman AI, Edwards KL. Vulnerability to alcoholism in men: a behavior-genetic perspective. J Stud Alcohol. 1985;46:329–356. doi: 10.15288/jsa.1985.46.329. [DOI] [PubMed] [Google Scholar]
- Urenjak J, Williams SR, Gadian DG, Noble M. Proton nuclear magnetic resonance spectroscopy unambiguously identifies different neural cell types. J Neurosci. 1993;13:981–989. doi: 10.1523/JNEUROSCI.13-03-00981.1993. [DOI] [PMC free article] [PubMed] [Google Scholar]
- Van Leemput K, Maes F, Vandermeulen D, Suetens P. Automated model-based tissue classification of MR images of the brain. IEEE Trans Med Imaging. 1999;18:897–908. doi: 10.1109/42.811270. [DOI] [PubMed] [Google Scholar]
- Wechsler H, Austin SB. Binge drinking: the five/four measure. J Stud Alcohol. 1998;59:122–124. doi: 10.15288/jsa.1998.59.122. [DOI] [PubMed] [Google Scholar]
- Wells WM, Grimson WEL, Kikinis R, Jolesz FA. Adaptive segmentation of MRI data. IEEE Trans Medical Imaging. 1996;15:429–442. doi: 10.1109/42.511747. [DOI] [PubMed] [Google Scholar]
- Wiedermann D, Schuff N, Matson GB, Soher BJ, Du AT, Maudsley AA, Weiner MW. Short echo multislice MR spectroscopic imaging: metabolite distributions and reliability. Magn Reson Imaging. 2001;19:1073–1080. doi: 10.1016/s0730-725x(01)00441-6. [DOI] [PubMed] [Google Scholar]
- Zhu X, Du A, Jahng G, Maudsley A, Weiner M, Schuff N. Improved SNR of proton MRSI using a deformation shape-intensity model ISMRM. Proceedings of the 10th Scientific Meeting of the International Society for Magnetic Resonance in Medicine; Honolulu, HI. ISMRM, Berkeley, CA. 2002. p. 231. [Google Scholar]