

Abstract
Regulation of gene expression is integral to the development and survival of all organisms. Transcription begins with the assembly of a pre-initiation complex at the gene promoter1, followed by initiation of RNA synthesis and the transition to productive elongation2–4. In many cases, recruitment of RNA polymerase II (Pol II) to a promoter is necessary and sufficient for activation of genes. However, there are a few notable exceptions to this paradigm, including heat shock genes and several proto-oncogenes, whose expression is attenuated by regulated stalling of polymerase elongation within the promoter-proximal region5–13. To determine the importance of polymerase stalling for transcription regulation, we carried out a genome-wide search for Drosophila melanogaster genes with Pol II stalled within the promoter-proximal region. Our data show that stalling is widespread, occurring at hundreds of genes that respond to stimuli and developmental signals. This finding indicates a role for regulation of polymerase elongation in the transcriptional responses to dynamic environmental and developmental cues.
Promoter-proximal pausing was first described at the Drosophila heat shock genes (for example, Hsp70), where Pol II is recruited to the promoter and initiates RNA synthesis before gene activation but stalls after elongating 20–50 nucleotides into the gene6,10,11,14–16. Escape of the engaged but stalled polymerase from the Hsp70 promoter region is regulated and is rate-limiting for gene expression10. Subsequently, nearly a dozen Drosophila (for example, Hsp26, Hsp27 and βTub), viral (HIV), and mammalian (including Myc, Junb and Igk) promoters have been shown to possess stalled polymerase5,7–11,15,17–19. However, stalling is currently thought to occur at only a small number of promoters, and the full spectrum of genes affected by Pol II stalling has yet to be investigated using a genome-wide approach in any organism.
Stalled Pol II is observed at the uninduced Hsp70 promoter in Drosophila S2 cells by chromatin immunoprecipitation (ChIP)6,10,20,21. Strong Pol II signal is present near the Hsp70 promoters and decreases precipitously at probes within the genes (Fig. 1a, top). Pol II occupancy at the Hsp70 promoter is greater than that at nearby promoters, including the aurora kinase (aur) gene, whose expression is considerably higher than that of Hsp70 (Fig. 1a). Thus, ChIP analysis of uninduced Hsp70 illustrates two hallmarks of stalled Pol II: much higher Pol II signal near the promoter than within the gene, and absence of correlation between Pol II occupancy and the levels of gene expression10.
Figure 1.

Whole-genome mapping of Pol II binding in Drosophila S2 cells. (a) Top, percentage of input DNA obtained by ChIP (n = 3; error bars, s.d.) versus chromosome position (in kilobase units), which represents the center point between primers used for quantitative PCR. Bottom, fold enrichment over genomic DNA observed by ChIP-chip (n = 2; error shows range, which is too small to be seen at some data points) versus chromosome position of probes. Relative probe intensities from Pol II ChIP-chip are shown in grayscale (black, higher intensity; white, lower intensity); below, arrows within genes denote the direction of transcription. (b) Flowchart describing the strategy used to determine and validate global Pol II promoter occupancy. (c) A histogram showing the position of the maximally bound probe within each bound gene (n = 5,403) with respect to the transcription start site (TSS).
To identify other genes with stalled Pol II, we carried out chromatin immunoprecipitation microarray (ChIP-chip) experiments using tiling oligonucleotide microarrays encompassing the Drosophila genome (Supplementary Methods and Supplementary Fig. 1 online) coupled with microarray expression analysis. We used an antibody against the Pol II Rpb3 subunit20 to detect Pol II regardless of the phosphorylation status of the Pol II Rpb1 C-terminal domain (CTD). We analyzed ChIP-chip data with previously described computational methods to identify annotated promoters occupied by polymerase22,23. Of the unique promoters represented on both the ChIP-chip and RNA expression arrays, 5,403 promoters were bound by Pol II and 7,702 were unbound (Fig. 1b and Supplementary Fig. 1). Several lines of evidence confirmed that our ChIP-chip data was of high quality. First, comparison of the ChIP-chip results with standard ChIP showed a marked concordance (Fig. 1a and Supplementary Fig. 2 online). Second, the maximal Pol II signal found within bound genes was consistently located near the promoter (Fig. 1c), in agreement with previous studies24. Lastly, our biological replicates showed 96% overlap between the promoters that we define as being bound by polymerase (Supplementary Fig. 1).
Among bound genes, many showed significant Pol II signals across the gene (Fig. 2a,b), whereas others had Pol II signal concentrated near the promoter (Fig. 2c–f). To identify genes with polymerase distribution consistent with stalled Pol II, namely those genes with high promoter-proximal polymerase signals accompanied by low Pol II signals within the gene, we calculated the difference between the average polymerase signals in these regions for all 5,403 bound genes (Fig. 3). Many genes had similar average signals within the promoter and downstream regions, indicative of rather uniform Pol II binding across the gene (Fig. 3). Although the calculated values for most genes fit within a normal Gaussian distribution, we found a substantial number of outliers that showed promoter-proximal enrichment of polymerase (PPEP, Fig. 3) and were thus good candidates for polymerase stalling. Notably, Drosophila genes that are known to harbor stalled Pol II show PPEP (for example, Hsp26, Hsp27 and βTub; Supplementary Fig. 3 online)11,15.
Figure 2.
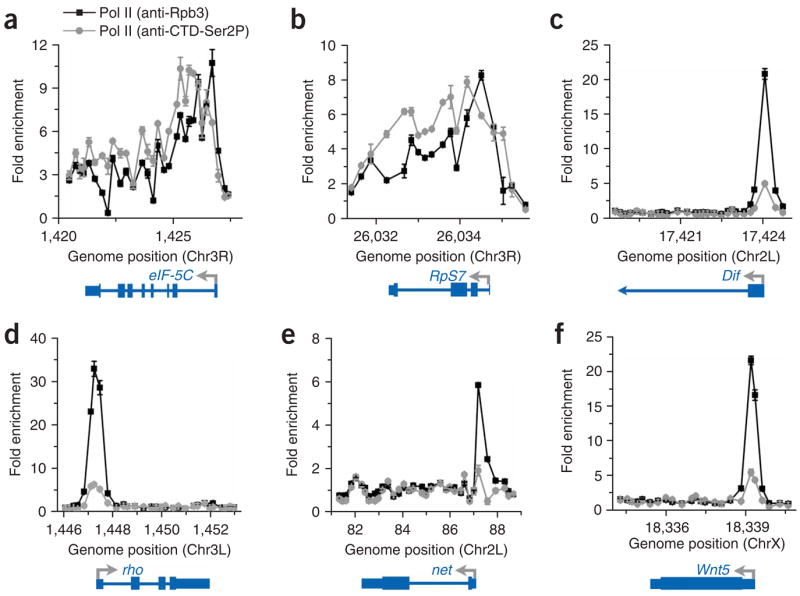
Pol II is enriched near the promoters of a subset of genes. ChIP-chip data for Pol II using antibodies that recognize the Rpb3 subunit (black squares) and the serine-2-phosphorylated CTD of Rpb1 (gray circles) are shown for six bound genes, plotted as fold enrichment over input versus chromosome position in kilobase units. The start site and direction of transcription are shown by arrows, with boxes depicting exons and lines representing introns. (a) eIF-5c (CG2922-RA). (b) RpS7 (CG1883-RA). (c) Dif (CG6794-RA). (d) rho (CG1004-RA). (e) net (CG11450-RA). (f) Wnt5 (CG6407-RA).
Figure 3.
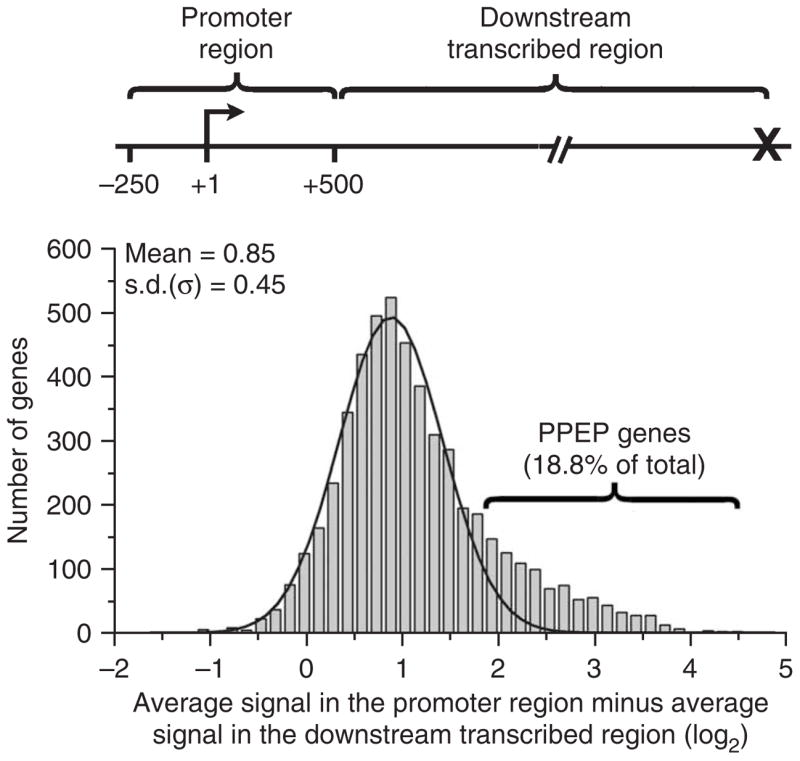
A subset of genes possess much more Pol II near their promoters than in the downstream region. The difference in average signal intensity (log2) in the promoter region (from −250 to +500 bp with respect to the transcription start site) and the downstream transcribed region (from +501 bp to the site of transcription termination) was determined. Shown is a histogram of these values for all bound genes, fit by a single Gaussian distribution. Calculating the difference between the average signals in log base 2 units is the equivalent of determining the ratio of fold enrichment in these regions; thus, a value of 1 on the x axis represents a twofold greater average Pol II signal near the promoter than downstream. A bracket designates the 1,014 genes with values >2 s.d. above the mean. These genes are defined as having promoter-proximal enrichment of polymerase (PPEP).
There was no correlation between the average Pol II signal near the promoter of genes with PPEP and the RNA expression levels observed (Supplementary Fig. 4 online; r2 = 0.03), suggesting that the amount of Pol II recruited to these promoters does not directly dictate levels of gene expression. By comparison, genes with more uniform Pol II binding showed a correlation between Pol II and expression levels (Supplementary Fig. 4 r2 = 0.22). These results are in agreement with recent ChIP-chip data from human cells that identified subsets of genes at which Pol II levels did not correlate with RNA expression24,25. However, Pol II signals in the downstream regions of both groups correlated with RNA expression (uniform Pol II binding, r2 = 0.26; PPEP, r2 = 0.29; data not shown). Transcripts from genes with PPEP were present at levels that ranged from barely detectable to substantially expressed (Supplementary Fig. 4 and Supplementary Table 1 online), consistent with prior reports that promoter-proximal stalling serves not only to fully repress transcription but also to attenuate transcription of active genes5,9,11,15,17.
To ensure that the low signal observed within those genes with PPEP was not due to a bias inherent to our Pol II Rpb3 antibody, we repeated the ChIP-chip experiments using an antibody that recognizes the serine-2-phosphorylated Pol II CTD, which corresponds to the actively elongating form of the polymerase. In agreement with Pol II Rpb3 ChIP results, the Ser2P Pol II CTD signal was evident across genes with uniform Pol II binding (Fig. 2a,b and Supplementary Fig. 5 online). However, analysis of genes with PPEP showed little enrichment of Pol II CTD Ser2P signal either near the promoter or within these genes (Fig. 2c–f and Supplementary Fig. 5), indicative of Pol II stalling.
Permanganate footprinting of a number of genes with PPEP confirmed that Pol II enrichment at these promoters resulted from stalling during early elongation (Fig. 4). Permanganate reacts with single-stranded thymine residues, like those in an open transcription bubble, revealing both the presence and the location of a transcriptionally engaged but stalled polymerase6,26. We observed permanganate hyper-reactivity within the promoter-proximal region of all genes with PPEP analyzed (17 genes total; examples shown in Fig. 4).
Figure 4.
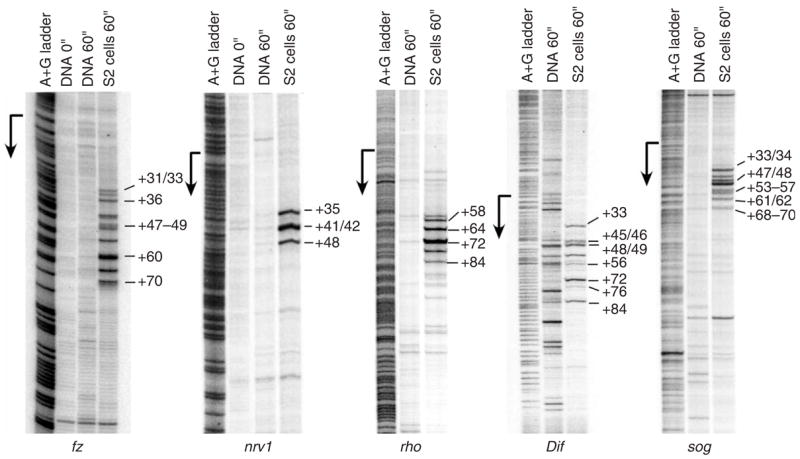
Permanganate mapping of open transcription bubbles reveals engaged Pol II within the promoter-proximal region of genes with PPEP. In vivo permanganate footprinting demonstrates the presence and locations of engaged Pol II in the promoter-proximal region of five genes with PPEP. Each panel shows a adenine-guanine ladder used for position determination, the reactivity pattern of naked DNA as a control and the permanganate reactivity observed in S2 cells (last lane in each panel). The positions of a subset of hyper-reactive thymine residues are identified to the right of each panel.
To probe the mechanisms causing Pol II enrichment at our candidate promoters, we asked whether NELF, a known regulator of polymerase stalling26–28, played a role at genes with PPEP. In support of this idea, ChIP with an antibody to NELF showed pronounced NELF occupancy of promoters with PPEP (Supplementary Fig. 6 online). We then carried out Pol II Rpb3 ChIP-chip on partial genomic arrays (~20% of Drosophila genome) using cells that were mock-treated or depleted of NELF by RNAi. We used a modest duration of NELF-RNAi that markedly decreases NELF protein levels (Supplementary Fig. 7 online) but that does not lead to substantially altered gene expression profiles (Supplementary Tables 2 and 3 online).
NELF depletion had a profound effect on polymerase signals at genes with PPEP (Fig. 5a,b). Moreover, the decrease in Pol II signal observed occurred only in the promoter region and not within the body of the gene (Fig. 5a–c and Supplementary Fig. 7). Analysis of the difference between average Pol II signals within the promoter and downstream regions for the 1,100 bound genes present on these arrays showed 200 genes with PPEP in mock-treated cells (18.2%), but only 85 genes with PPEP in the NELF-depleted samples (8%; Supplementary Fig. 8 online). Thus, NELF-dependent stalling led to promoter-proximal enrichment of polymerase at nearly 60% of our candidate genes (Fig. 5d). Stalling at the remaining 85 genes may be unaffected by NELF depletion because of relatively tighter NELF retention at these genes or, alternatively, it might be NELF independent.
Figure 5.

Depletion of NELF relieves promoter-proximal stalling, globally reducing PPEP. (a–c) Pol II (anti-Rpb3) ChIP-chip data from NELF-depleted (open circles) and mock-treated ChIP samples (blue squares) for genes with PPEP, ltd (CG8024-RC) (a) and wun2 (CG8805-RC) (b) as well as for a gene with more uniform Pol II signal, DNA Pol II-iota (CG7602-RB) (c). (d) Number of genes with PPEP observed on our partial ChIP-chip arrays in mock-treated and NELF-depleted Drosophila S2 cells.
Querying the Gene Ontology database with a list of genes with PPEP, we found a significant overrepresentation of genes that respond to stimuli (Fig. 6a). Notably, nearly a third of our candidate genes are involved in development (P < 10−38). Supporting a role of polymerase stalling in development, recent work has implicated stalling at the Drosophila sloppy paired 1 (slp1) gene in the regulation of cell fate specification29. Furthermore, the genes involved in the processes of cell differentiation and cell communication were significantly enriched in our PPEP gene list, which also included many rapidly induced genes involved in the Toll-signaling, MAP-kinase, defense and immune-responsive pathways (Fig. 6). Gene Ontology queries carried out with randomly selected sets of 1,000 Drosophila genes did not show significant enrichment in specific Gene Ontology categories (P < 10−4).
Figure 6.

Gene ontology analysis shows that genes with PPEP are enriched in genes involved in development, reproduction and the response to stimulus. (a) Query of the Gene Ontology database with a list of 1,014 genes with PPEP reveals major biological processes that were significantly overrepresented on this gene list (at a P value cutoff < 0.001). Shown are the number of genes in each Gene Ontology class, the percentage of total genes within each class that have PPEP and the associated P value. (b) Pol II (anti-Rpb3) ChIP data from three UV-inducible genes with PPEP and eIF-5c as a control, comparing Pol II distribution under uninduced and induced conditions (120 mJ/cm2 UV exposure followed by a 4-h recovery). After UV irradiation, the ratio of Pol II occupancy detected at the promoter versus downstream primer pair decreases substantially (from a ratio of 13.6 to 4.0 for W, from 16.5 to 7.7 for Hsp70 and from 4.9 to 2.1 for CG12171). n = 2 independent ChIP samples; error bars represent the range. (c) In vivo permanganate footprinting of W and CG12171 before and after UV induction, shown as in Figure 4.
To test the idea that Pol II stalled at the newly identified genes with PPEP could be released upon gene induction, we took advantage of the fact that key players in the response to ultraviolet (UV) irradiation have PPEP30. Before UV exposure, the UV-inducible genes W (also known as hid), CG12171 and Hsp70 had substantial enrichment of Pol II at their promoters compared to the downstream regions (Fig. 6b, compare to control eIF-5c) and showed permanganate hyper-reactivity in their promoter-proximal regions (Fig. 6c). Ultraviolet exposure activated transcription of these genes (data not shown) and led to a substantial decrease in stalled Pol II, as observed by permanganate mapping (Fig. 6c), as well as to a shift of Pol II signal downstream into the genes (Fig. 6b). Thus, activation of these UV-inducible genes involves the regulated release of stalled Pol II.
In conclusion, our genome-wide analysis identified hundreds of Drosophila genes that possess stalled Pol II, indicating that this method of transcription regulation is much more widespread than previously appreciated. It has been previously shown that, in addition to heat shock–inducible promoters, a number of constitutively expressed genes have stalled Pol II, and Pol II stalling might thus be a common phenomenon9,11. Our work fully confirms that prediction and shows that NELF plays a key role in maintaining polymerase stalled near a large number of promoters. Notably, Pol II stalls near the promoters of many genes that, like Hsp70, respond to environmental or developmental stimuli, suggesting that the rapid release of stalled Pol II facilitates efficient, integrated responses to the dynamically changing environment. A stalled Pol II in the promoter-proximal region could help to establish an active chromatin structure around these genes and maintain them poised for activation. Moreover, the prevalence of promoter-proximal stalling at developmental-control genes suggests that stalling plays a fundamental role in development.
METHODS
RNAi and ChIP-chip
Drosophila S2 cells were untreated or treated for 96 h with dsRNA targeting two NELF subunits (NELF-B and NELF-E) or dsRNA against β-galactosidase (mock-treated) before harvesting for RNA or ChIP analysis, as described previously20. ChIP samples cross-linked with formaldehyde for 10 min were immunoprecipitated using a polyclonal antibody that recognizes the Rpb3 subunit of Pol II20 or an antibody against the serine-2-phosphorylated Pol II CTD (Abcam, ab5095), using ChIP material from 7.5 × 10⁷ cells per immunoprecipitation. We carried out quantitative PCR to determine percent input for each primer pair for standard ChIP assays. ChIP-chip assays used tiled DNA arrays (Agilent), either the Drosophila Whole Genome two-array set (P/N G4495A, design 014816, 014817) or the Dm3 (design 013839) or Dm7 (013843) arrays from the Whole Drosophila Genome 11 array set (designed by the Whitehead Institute). Two micrograms each of DNA from ChIP and genomic input samples (without PCR amplification) was differentially fluorescently labeled and mixed to probe each array. For the 44,000-probe Dm3 and Dm7 arrays, we obtained data using the Agilent Feature Extraction software (v8.5), using the CGH_44K_1005 protocol settings. The 244K Whole Genome arrays were scanned using an Agilent Scanner at 5-μm resolution, incorporating the eXtending Dynamic Range (XDR) algorithm. We obtained data using the Agilent Feature Extraction software (9.1.3) with the CGH-v4_91 protocol settings.
ChIP-chip data analysis
We identified bound regions as previously described22,23. Briefly, signal for each probe was assigned a P value based on the Rosetta error model, and a combination of P values from neighboring probes qualified for a region to be called bound. The bound regions were then assigned to specific genes if the bound region overlapped with the transcriptional start site. Pol II ChIP signals from independent biological replicates (n = 2) were in good agreement and were thus merged for further analyses. For every annotated promoter in our list, we created a list of ChIP probes that belong to that gene, using chromosomal position information for probes (Agilent). A list of probes for every gene was populated by assigning probes to a gene if the middle nucleotide of a probe was positioned between 250 bp upstream of the transcription start site and the site of transcription termination for each given gene. For all analyses, the region denoted as ‘near the promoter’ includes probes located from 250 bp upstream to 500 bp downstream of the transcription start site, whereas the region defined as the ‘downstream’ extends from 501 bp downstream of the start site to the site of transcription termination.
RNA expression analysis
Total RNA was isolated using the RNeasy kit (Qiagen). We carried out gene expression analysis using Drosophila Genome 2.0 Genechip arrays according to the manufacturer’s recommendations (Affymetrix). Overall RNA expression levels in untreated, mock-treated and NELF-depleted samples (expressed as log2 intensity) were derived from duplicate arrays (see Supplementary Methods). We carried out Gene Ontology analyses by batch query using NetAffx (Affymetrix).
Permanganate footprinting
Drosophila S2 cells (107 cells) were incubated in 1 ml of 10 mM KMnO4 in 1× PBS for 60 s on ice, followed by the addition of 0.5 ml ‘stop’ solution (20 mM Tris-HCl, pH 8.0;40 mM EDTA; 1% SDS; 0.5 M β-mercaptoethanol). Genomic DNA was prepared using treatment with RNase A and proteinase K followed by phenol-chloroform extraction. We carried out footprinting using ligation-mediated PCR essentially as described previously26. Primer sequences are available upon request.
Accession codes
National Center for Biotechnology Gene Expression Omnibus: Microarray and ChIP-chip data have been deposited with GEO accession code GSE6714.
Supplementary Material
Note: Supplementary information is available on the Nature Genetics website.
Acknowledgments
The authors acknowledge T. Kunkel, M. Resnick, G. dos Santos and P. Wade for critical reading of this manuscript. We also thank R. Young for providing support in the microarray analysis of ChIP-chip data and for helpful suggestions on this work. We thank D. Gilmour for the gift of the NELF-E antibody and for advice on permanganate mapping. This research was supported by the Intramural Research Program of the US National Institutes of Health, National Institute of Environmental Health Sciences.
Footnotes
AUTHOR CONTRIBUTIONS
K.A. and G.W.M. designed the experiments and prepared the manuscript. G.W.M., D.A.G. and S.N. carried out the experiments. S.F.G. conducted the hybridization of DNA and expression arrays. J.Z. designed the DNA arrays and analyzed the bound regions in ChIP-chip data. R.S., J.S.P. and K.A. carried out further data analysis.
References
- 1.Roeder RG. Transcriptional regulation and the role of diverse coactivators in animal cells. FEBS Lett. 2005;579:909–915. doi: 10.1016/j.febslet.2004.12.007. [DOI] [PubMed] [Google Scholar]
- 2.Luse DS, Samkurashvili I. The transition from initiation to elongation by RNA polymerase II. Cold Spring Harb Symp Quant Biol. 1998;63:289–300. doi: 10.1101/sqb.1998.63.289. [DOI] [PubMed] [Google Scholar]
- 3.Shilatifard A, Conaway RC, Conaway JW. The RNA polymerase II elongation complex. Annu Rev Biochem. 2003;72:693–715. doi: 10.1146/annurev.biochem.72.121801.161551. [DOI] [PubMed] [Google Scholar]
- 4.Sims RJ, III, Belotserkovskaya R, Reinberg D. Elongation by RNA polymerase II: the short and long of it. Genes Dev. 2004;18:2437–2468. doi: 10.1101/gad.1235904. [DOI] [PubMed] [Google Scholar]
- 5.Aida M, et al. Transcriptional pausing caused by NELF plays a dual role in regulating immediate-early expression of the junB gene. Mol Cell Biol. 2006;26:6094–6104. doi: 10.1128/MCB.02366-05. [DOI] [PMC free article] [PubMed] [Google Scholar]
- 6.Gilmour DS, Lis JT. RNA polymerase II interacts with the promoter region of the noninduced hsp70 gene in Drosophila melanogaster cells. Mol Cell Biol. 1986;6:3984–3989. doi: 10.1128/mcb.6.11.3984. [DOI] [PMC free article] [PubMed] [Google Scholar]
- 7.Krumm A, Hickey LB, Groudine M. Promoter-proximal pausing of RNA polymerase II defines a general rate-limiting step after transcription initiation. Genes Dev. 1995;9:559–572. doi: 10.1101/gad.9.5.559. [DOI] [PubMed] [Google Scholar]
- 8.Krumm A, Meulia T, Brunvand M, Groudine M. The block to transcriptional elongation within the human c-myc gene is determined in the promoter-proximal region. Genes Dev. 1992;6:2201–2213. doi: 10.1101/gad.6.11.2201. [DOI] [PubMed] [Google Scholar]
- 9.Law A, Hirayoshi K, O’Brien T, Lis JT. Direct cloning of DNA that interacts in vivo with a specific protein: application to RNA polymerase II and sites of pausing in Drosophila. Nucleic Acids Res. 1998;26:919–924. doi: 10.1093/nar/26.4.919. [DOI] [PMC free article] [PubMed] [Google Scholar]
- 10.Lis J. Promoter-associated pausing in promoter architecture and postinitiation transcriptional regulation. Cold Spring Harb Symp Quant Biol. 1998;63:347–356. doi: 10.1101/sqb.1998.63.347. [DOI] [PubMed] [Google Scholar]
- 11.Rougvie AE, Lis JT. Postinitiation transcriptional control in Drosophila melanogaster. Mol Cell Biol. 1990;10:6041–6045. doi: 10.1128/mcb.10.11.6041. [DOI] [PMC free article] [PubMed] [Google Scholar]
- 12.Saunders A, Core LJ, Lis JT. Breaking barriers to transcription elongation. Nat Rev Mol Cell Biol. 2006;7:557–567. doi: 10.1038/nrm1981. [DOI] [PubMed] [Google Scholar]
- 13.Strobl LJ, Eick D. Hold back of RNA polymerase II at the transcription start site mediates down-regulation of c-myc in vivo. EMBO J. 1992;11:3307–3314. doi: 10.1002/j.1460-2075.1992.tb05409.x. [DOI] [PMC free article] [PubMed] [Google Scholar]
- 14.Rasmussen EB, Lis JT. In vivo transcriptional pausing and cap formation on three Drosophila heat shock genes. Proc Natl Acad Sci USA. 1993;90:7923–7927. doi: 10.1073/pnas.90.17.7923. [DOI] [PMC free article] [PubMed] [Google Scholar]
- 15.Rasmussen EB, Lis JT. Short transcripts of the ternary complex provide insight into RNA polymerase II elongational pausing. J Mol Biol. 1995;252:522–535. doi: 10.1006/jmbi.1995.0517. [DOI] [PubMed] [Google Scholar]
- 16.Rougvie AE, Lis JT. The RNA polymerase II molecule at the 5′ end of the uninduced hsp70 gene of D. melanogaster is transcriptionally engaged. Cell. 1988;54:795–804. doi: 10.1016/s0092-8674(88)91087-2. [DOI] [PubMed] [Google Scholar]
- 17.Aiyar SE, et al. Attenuation of estrogen receptor alpha-mediated transcription through estrogen-stimulated recruitment of a negative elongation factor. Genes Dev. 2004;18:2134–2146. doi: 10.1101/gad.1214104. [DOI] [PMC free article] [PubMed] [Google Scholar]
- 18.Fujinaga K, et al. The ability of positive transcription elongation factor B to transactivate human immunodeficiency virus transcription depends on a functional kinase domain, cyclin T1, and Tat. J Virol. 1998;72:7154–7159. doi: 10.1128/jvi.72.9.7154-7159.1998. [DOI] [PMC free article] [PubMed] [Google Scholar]
- 19.Raschke EE, Albert T, Eick D. Transcriptional regulation of the Ig kappa gene by promoter-proximal pausing of RNA polymerase II. J Immunol. 1999;163:4375–4382. [PubMed] [Google Scholar]
- 20.Adelman K, et al. Efficient release from promoter-proximal stall sites requires transcript cleavage factor TFIIS. Mol Cell. 2005;17:103–112. doi: 10.1016/j.molcel.2004.11.028. [DOI] [PubMed] [Google Scholar]
- 21.Boehm AK, Saunders A, Werner J, Lis JT. Transcription factor and polymerase recruitment, modification, and movement on dhsp70 in vivo in the minutes following heat shock. Mol Cell Biol. 2003;23:7628–7637. doi: 10.1128/MCB.23.21.7628-7637.2003. [DOI] [PMC free article] [PubMed] [Google Scholar]
- 22.Pokholok DK, et al. Genome-wide map of nucleosome acetylation and methylation in yeast. Cell. 2005;122:517–527. doi: 10.1016/j.cell.2005.06.026. [DOI] [PubMed] [Google Scholar]
- 23.Qi Y, et al. High-resolution computational models of genome binding events. Nat Biotechnol. 2006;24:963–970. doi: 10.1038/nbt1233. [DOI] [PubMed] [Google Scholar]
- 24.Kim TH, et al. A high-resolution map of active promoters in the human genome. Nature. 2005;436:876–880. doi: 10.1038/nature03877. [DOI] [PMC free article] [PubMed] [Google Scholar]
- 25.Lee TI, et al. Control of developmental regulators by Polycomb in human embryonic stem cells. Cell. 2006;125:301–313. doi: 10.1016/j.cell.2006.02.043. [DOI] [PMC free article] [PubMed] [Google Scholar]
- 26.Wu CH, et al. NELF and DSIF cause promoter proximal pausing on the hsp70 promoter in Drosophila. Genes Dev. 2003;17:1402–1414. doi: 10.1101/gad.1091403. [DOI] [PMC free article] [PubMed] [Google Scholar]
- 27.Narita T, et al. Human transcription elongation factor NELF: identification of novel subunits and reconstitution of the functionally active complex. Mol Cell Biol. 2003;23:1863–1873. doi: 10.1128/MCB.23.6.1863-1873.2003. [DOI] [PMC free article] [PubMed] [Google Scholar]
- 28.Yamaguchi Y, Inukai N, Narita T, Wada T, Handa H. Evidence that negative elongation factor represses transcription elongation through binding to a DRB sensitivity-inducing factor/RNA polymerase II complex and RNA. Mol Cell Biol. 2002;22:2918–2927. doi: 10.1128/MCB.22.9.2918-2927.2002. [DOI] [PMC free article] [PubMed] [Google Scholar]
- 29.Wang X, Lee C, Gilmour DS, Gergen JP. Transcription elongation controls cell fate specification in the Drosophila embryo. Genes Dev. 2007;21:1031–1036. doi: 10.1101/gad.1521207. [DOI] [PMC free article] [PubMed] [Google Scholar]
- 30.Lee CY, et al. Genome-wide analyses of steroid- and radiation-triggered programmed cell death in Drosophila. Curr Biol. 2003;13:350–357. doi: 10.1016/s0960-9822(03)00085-x. [DOI] [PubMed] [Google Scholar]
Associated Data
This section collects any data citations, data availability statements, or supplementary materials included in this article.
Supplementary Materials
Note: Supplementary information is available on the Nature Genetics website.