

Abstract
The cerebellum, parietal cortex, and premotor cortex are integral to visuomotor processing. The parameters of visual information that modulate their role in visuomotor control are less clear. From motor psychophysics, the relation between the frequency of visual feedback and force variability has been identified as nonlinear. Thus we hypothesized that visual feedback frequency will differentially modulate the neural activation in the cerebellum, parietal cortex, and premotor cortex related to visuomotor processing. We used functional magnetic resonance imaging at 3 Tesla to examine visually guided grip force control under frequent and infrequent visual feedback conditions. Control conditions with intermittent visual feedback alone and a control force condition without visual feedback were examined. As expected, force variability was reduced in the frequent compared with the infrequent condition. Three novel findings were identified. First, infrequent (0.4 Hz) visual feedback did not result in visuomotor activation in lateral cerebellum (lobule VI/Crus I), whereas frequent (25 Hz) intermittent visual feedback did. This is in contrast to the anterior intermediate cerebellum (lobule V/VI), which was consistently active across all force conditions compared with rest. Second, confirming previous observations, the parietal and premotor cortices were active during grip force with frequent visual feedback. The novel finding was that the parietal and premotor cortex were also active during grip force with infrequent visual feedback. Third, right inferior parietal lobule, dorsal premotor cortex, and ventral premotor cortex had greater activation in the frequent compared with the infrequent grip force condition. These findings demonstrate that the frequency of visual information reduces motor error and differentially modulates the neural activation related to visuomotor processing in the cerebellum, parietal cortex, and premotor cortex.
INTRODUCTION
The cerebellum is crucial in the visual guidance of movement (Ebner and Fu 1997; Stein and Glickstein 1992). This observation can be traced back to the work of Holmes (1939), who identified that cerebellar lesions disrupt visuomotor control. More recently, Miall and colleagues (2001) have provided direct evidence in healthy humans that the cerebellum coordinates eye and hand tracking movements. This supports previous findings from patients with cerebellar lesions (van Donkelaar and Lee 1994). In non-human primates, the cerebellum has been implicated in the visual guidance of movement through studies using lesions (Baizer et al. 1999; Brooks et al. 1973; Miall et al. 1987) and electrophysiology (Liu et al. 2003; Mushiake and Strick 1993; Norris et al. 2004). In addition to its role in visuomotor control, the cerebellum has been suggested to contribute to other aspects of motor control that include nonvisual motor processes (Desmurget et al. 2001), coordination of movement (Ramnani et al. 2001), internal models (Imamizu et al. 2000; Wolpert et al. 1998), and compensating for interaction torques (Bastian et al. 1996).
By the same token, the parietal and premotor cortex are intricately involved in visuomotor control processes (Caminiti et al. 1996; Clower et al. 1996; Jeannerod et al. 1995; Milner and Goodale 1993). The work of Mountcastle and colleagues (1975) showed that neurons in area 7 of the monkey respond during reaching movements to visual stimuli. In humans, transcranial magnetic stimulation of the posterior parietal cortex has been used to disrupt visually guided reaching movements (Della-Maggiore et al. 2004; Desmurget et al. 1999), and neuroimaging in humans confirmed the role of the parietal-premotor system in visuomotor control (Ellermann et al. 1998; Hamzei et al. 2002; Vaillancourt et al. 2003). Although it is well established that the cerebellum, parietal cortex, and pre-motor cortex are associated with visuomotor processes, very little is known about how the parameters of visual feedback modulate the role of these brain regions in visuomotor control.
In motor psychophysics experiments, increasing the presentation frequency of visual feedback induces a systematic reduction in the variability of finger force output (Slifkin et al. 2000; Vaillancourt et al. 2001). Because the variability of finger force at a low visual feedback frequency (0.4 Hz) still remains lower than in the absence of visual feedback, this implies that visuomotor corrections occur when visual feedback is presented at both high and low frequencies. In addition, the reduction in force variability with increased feedback frequency is a nonlinear hyperbolic function rather than a linear function (Slifkin et al. 2000). This suggests that visually guided corrections are processed differently depending on whether visual feedback is presented frequently or infrequently. One reason why visually guided corrections would be processed differently is related to the time it takes visual information to reach different parts of the brain. For instance, the parietal cortex receives input from the visual cortex at short temporal latencies (Bisley et al. 2004). In contrast, the cerebellum gains access to visual information via indirect projections from pontine nuclei and inferior olive after longer temporal intervals, and complex Purkinje cells discharge at slow rates (Glickstein 2000; Norris et al. 2004; Stein and Glickstein 1992). Also, the parietal cortex and cerebellum transmit signals to the premotor cortex via different pathways (Caminiti et al. 1996; Stein and Glickstein 1992). Taken together these findings suggest that the visuomotor neuronal response to visual input at different frequencies would not be uniform across the cerebellum, parietal cortex, and premotor cortex.
This study was designed to examine blood-oxygenation-level-dependent (BOLD) activation in the cerebellum, parietal cortex, and premotor cortex in humans using functional magnetic resonance imaging. We used a precision grip force task because the task has been well studied in motor neuroscience (Ehrsson et al. 2000; Kilner et al. 2002, 2003; Vaillancourt et al. 2003. 2004; Witney et al. 2004) and because we could carefully control the amount of force generated (Dai et al. 2001). In the infrequent visuomotor condition, the visual stimulus was presented at 0.4 Hz and at 25 Hz during the frequent condition. Visual control conditions at 0.4 and 25 Hz were included along with a force condition in the absence of visual feedback. The findings provide the first evidence for how visual feedback frequency modulates the role of the cerebellum, parietal cortex, and premotor cortex in visuomotor processing.
METHODS
Subjects
Ten right handed subjects (range: 21–35 yr) with corrected or normal vision took part in the experiment. There were five males and five females. The subjects were naive to the purpose of the experiment, and none of the subjects had any history of a neurological disorder. All subjects gave written informed consent to all experimental procedures, which were approved by the local Institutional Review Board and were in compliance with the Declaration of Helsinki.
Experimental design
During the force conditions, subjects produced force with their right hand against a rigid precision grip device. Consistent with previous work (Vaillancourt et al. 2003, 2004), subjects pinched the grip apparatus with their middle finger and thumb to produce force output. The middle finger was used instead of the index finger because we have found that subjects tend to overlay the middle finger on top of the index finger during precision grip. When using the middle finger, this problem is not encountered, and this is important due to the difficulty in continuously monitoring hand configuration in the magnet.
The custom pinch-grip apparatus is made of nonmetallic material (polycarbonate) allowing its use inside the fMRI environment (Liu et al. 2000). The grasping apparatus is connected to a long plastic tube (35 ft), which leads into an Entran (EPX-N13-250P) pressure transducer (located outside the fMRI environment). When the pinch grip is performed, this increases hydraulic pressure, which is sensed by the pressure transducer. The pressure transducer output was amplified through a pressure gauge amplifier. A PCMCI National Instruments A/D converter sampled the pressure at 100 Hz. At each sampling interval the pressure from the transducer was displayed to the subject through the video projector and mirror setup.
The fMRI experiment used a blocked design because we were interested in continuous feedback-based force control and this requires a long force production trial. The experiment included one fMRI scan that lasted 9 min and 10 s. Anatomical scans were taken following the functional scan. The maximal voluntary contraction (MVC) was calculated similarly to previous work (Vaillancourt et al. 2001). During the fMRI scan, subjects produced force at 25% of their MVC in three of the six conditions (described in the following text) during the scan. During the force with visual feedback conditions, subjects were required to match their force output to the target force.
Figure 1A shows the six task conditions. The six conditions, lasting 22 s each, were repeated four times with an additional rest of 22 s at the end of the functional scan. The first 2 s of each condition was a transition cue to the subject to inform them of a change in the experimental condition. We analyzed our data by treating the 2-s transition as a separate event. The transition cue showed the same display as the rest condition (Fig. 1A). In addition to the rest condition (R), there was a vision force condition at low frequency (VFL), a vision condition at low frequency (VL), a vision force condition at high frequency (VFH), a vision condition at high frequency (VH), and a force-only condition (F). The 0.4 Hz (VFL, VL) and 25 Hz (VFH, VH) intermittent conditions were selected based on previous work (Slifkin et al. 2000; Vaillancourt et al. 2001) showing the 25 Hz intermittent visual feedback reduced force variability compared with 0.4 Hz visual feedback. The six conditions were as follows.
FIG. 1.

Experimental paradigm and force output characteristics. A: the block-design functional magnetic resonance imaging (fMRI) paradigm is depicted. The black image with the target and cursor are consistent with what the subject viewed in the scanner. The arrow indicates that the cursor moved vertically in vision force condition at low frequency (VFL), vision condition at low frequency (VL), vision force condition at high frequency (VFH), and vision condition at high-frequency (VH) conditions, and the instructions to the subject are presented above each image (force or fixate). The arrow and the words were not viewed during the paradigm. Each condition lasted 20 s, with a 2-s transition period between each condition. B: the SD of force averaged across subjects (+1 SD). The 3 force conditions are depicted: F, VFL, VFH. C: a visuomotor correction from the force trace is shown. The time scale shows a 1.4 s portion from one of the VFL blocks. The thick vertical black line represents when the visual stimulus was presented for a short interval of 20 ms. The dotted line indicates when the visuomotor correction occurred (260 ms). The thick black horizontal line is the target represented as the green line in Fig. 1A.
First, the R condition required the subject to fixate their eyes on the red line (Fig. 1A), which along with the white line remained in the same position during the block.
Second, the VFL required the subject to continuously produce precise force to a continuously visible target force while receiving low-frequency visual feedback about the position of the force cursor (white cursor in Fig. 1A). The white force cursor was displayed intermittently on the screen to the subject every 2.5 s (0.4 Hz) for 20 ms at each sample. After 20 ms, the white force cursor disappeared and then reappeared after 2.5 s. The real-time position of the white force cursor represented the force sampled by the A/D board during the 20-ms period and its new position was updated from the A/D board each time it reappeared.
Third, the VL condition was a control condition for VFL. We displayed similar visual feedback as the VFL condition, but the subject did not produce force. Based on previous work on the dynamic profile of force output (Slifkin et al. 2000), we modeled the dynamics of the visual cursor for the VL condition as a 1-Hz sinewave with a small amount of white noise added at each time point (Vaillancourt et al. 2003). The amplitude of the sinewave was set consistent with the force variability measured during the practice session of each subject. The timing of when the white cursor appeared on the screen was similar to condition 2 above, in that every 2.5 s the subject viewed the new position of the white cursor for 20 ms. After 20 ms the white cursor disappeared again, and reappeared in its new position after 2.5 s.
Fourth, the VFH required the subject to produce precise force while receiving a visual feedback sample every 40 ms (25 Hz). Each visual feedback sample stayed on the screen for 20 ms. Similar to the VFL condition, the position of the white force was dynamically updated from the A/D board.
Fifth, the VH condition displayed visual feedback to the subject every 40 ms similar to the VFH condition, but the subject did not produce force. The modeling of the white force cursor was similar to the VL condition described in the preceding text.
And last, the F condition required subjects to produce precise force output at 25% of their MVC from memory while viewing the same two lines (Fig. 1A, right; the cursor did not move in this condition). During every block of all three force conditions, subjects received continuous visual feedback for the first second so they could determine the appropriate level of force. Finally, prior to entering the magnet the subjects participated in a 45-min training session to minimize the transitory portion of the motor learning process.
Functional magnetic resonance imaging data acquisition
Magnetic resonance imaging (MRI) was performed with a volume head coil using a 3T scanner (General Electric Medical Systems, Milwaukee, WI). The head was stabilized using comfortable adjustable padding and the visor system as described in previous work (Thulborn 1999). Functional images were obtained with a T2*-sensitive, single-shot, gradient-echo echo-planar pulse sequence (echo time: 25 ms; repeat time: 2,000 ms; flip angle: 90°; field of view: 200 mm2; imaging matrix: 64 × 64; 28 slices at 3-mm thickness with a 1-mm gap between each 3-mm slice). Slices were acquired axially. The MR scanning session ended by acquiring an anatomical image using a T1-weighted fSPGR pulse sequence (echo time: 1.98 ms; repeat time: 9 ms; flip angle: 25°; field of view: 220 mm2; imaging matrix: 256 × 256; 120 contiguous slices with 1.5-mm slice thickness).
fMRI data analysis
fMRI data processing was performed using the public domain software FIASCO (Eddy et al. 1996) and AFNI (Cox 1996). The fMRI data were first processed in FIASCO by performing a baseline correction, mean correction, correcting for motion based on three-dimensional motion-estimation parameters, correction for outliers, and detrending. The average displacement of head movement averaged across volumes and subjects was 0.27 ± 0.11 (SD) mm. The head movement was less than our cutoff criteria of 1/3 a voxel (voxel size = 3.125 × 3.125 × 3 mm).
The data analyses were designed to examine visuomotor activation of the cerebellum, parietal, and premotor cortex. First, we used the group map analysis to determine where the visuomotor activation occurred and therefore to refine our region of interest (ROI) drawings. Second, we performed ROI analyses on the isolated parts of the cerebellum, parietal lobules, and premotor cortex to determine if there were differences in activation between the task conditions directly related to visuomotor processing. For the cerebellum, we used the nomenclature from the atlas by Schmahmann and colleagues (2000) after data were transferred into Montreal Neurological Institute (MNI) space. All coordinates are reported in MNI space. In the motor cortex and premotor cortex, labeling for the areas of activation was determined using the Human Motor Area Template (HMAT) (Mayka et al. 2004).
First, the group map analysis was calculated for specific comparisons of interest to determine the location of visuomotor activations—using the VFH-F and VFH-VH comparisons (Fig. 2, B and C). This same approach to identifying visuomotor activation has been used in previous work (Vaillancourt et al. 2003). We used the VFH condition instead of the VFL condition for identifying visuomotor activation because we have a greater chance of identifying a visuomotor region during the frequent feedback condition, and the VFL condition may have additional processes involved such as memory encoding and error monitoring not related to visuomotor processes. Additionally, for visual comparison with the visuomotor activation in VFH-F and VFH-VH in our figures, we calculated group maps for the F-R, VFL-F, VFL-VL, and VFH-VFL conditions. In generating each group map, the comparisons were first generated in FIASCO as t-maps for each individual subject. We then thresholded each of these t-maps using the false discovery rate at a q of 0.05 (Genovese et al. 2002). Next a group analysis of the active regions that were consistent across subjects was performed using the Fisher test statistic (Fisher 1950). This group test statistic provides a robust assessment of the activation consistent across the subjects (Lazar et al. 2002; Simo et al. 2005). The group maps were thresholded at a χ2 value of 56, which approximates a t-value equal to 4.
FIG. 2.

Activation from the cerebellum during F-R (A), VFH-F (B), VFH-VH (C), VFH-VFL (D), and VFL-F (E). Each image represents the group map data overlaid onto a single subject anatomical image. Slices shown are at Z = −34 mm in radiological space. We have shown this slice because visuomotor activation was strongest for this slice. Visuomotor activation can be observed in C and D. The cerebellum regions of interest (ROIs) can be seen for the anterior intermediate cerebellum (red, A) and the lateral cerebellum (blue, B and C). Coordinates are reported in MNI space.
The ROI drawings were based on the outcome from the group maps and chosen to target the cerebellum [lateral cerebellum (lobule VI/Crus I) and anterior intermediate cerebellum (lobule V/VI)], parietal cortex [inferior parietal lobule (IPL) and superior parietal lobule (SPL)], and the premotor cortex [dorsal premotor cortex (PMd), ventral premotor cortex (PMv), and supplementary motor area (SMA)]. As shown in Fig. 2, B and C, if a volume of activation was significantly active during both the VFH-F and VFH-VH comparisons, then this volume was deemed a visuomotor region. Figure 2C (blue) shows the visuomotor ROI for the lateral cerebellum, which spanned from Z = −32 to Z = −37. Figure 4A shows the visuomotor ROIs in the right hemisphere for PMd (green, Z = 57 to Z = 62), PMv (black, Z = 27 to Z = 40), SMA (blue, Z = 52 to Z = 62), IPL (white, Z = 42 to Z = 60), and SPL (red, Z = 52 to Z = 61). In addition, in the cerebellum, we drew an additional region of interest (ROI) that was based on the F-R condition (Fig. 2A, red ellipse). This motor ROI in the anterior intermediate cerebellum is shown in red (Fig. 2A), and spanned from Z = −30 to Z = −36. Each ROI was examined on the right and left hemisphere using similar coordinates.
FIG. 4.

Group map activation in the parietal cortex and premotor cortex. A: VFH-F and VFH-VH comparisons; B: VFL-F and VFL-VL comparisons. The VFH-F and VFH-VH comparisons were used to identify visuomotor ROIs. The VFL-F and VFL-VL comparisons are depicted for visual comparisons with the VFH condition. For each image, the group map activation from the Fisher test was overlaid onto a single subject anatomical image. Z slices are shown at 57, 46, and 36 mm (MNI space). The ROIs included SMA (blue), PMd (green), PMv (black), IPL (white), and SPL (red).
Second, we conducted ROI analyses between each stimulus condition compared with rest to determine if there were differences in activation between the force conditions directly related to visuomotor processing. Because each stimulus condition was compared with the same baseline condition, then any differences found could be attributed to the difference between the stimulus conditions. The average percentage signal change and activation volume was determined in each ROI for each individual subject. One template ROI was used to evaluate each subject’s data following transformation into standardized coordinate space. The average percent signal change was calculated on all of the voxels in each ROI that had a t-value that exceeded the t-value determined using the false discovery rate threshold. The activation volume in each ROI was equal to the number of activated voxels that passed the false discovery rate threshold.
Statistical analysis
Statistical analysis of the mean ± SD of force was conducted using separate repeated-measures ANOVA for each dependent measure. Post hoc t-test were performed to investigate the locus of the significant findings from the ANOVA. In the fMRI data, we investigated the percent signal change and activation volume in ROIs using separate repeated-measures ANOVAs. Post hoc t-test were performed between the force conditions for the ANOVAs that resulted in a significant main effect. We interpreted each statistical test as significant when there was less than a 5% chance of making a type I error (P < 0.05).
RESULTS
Force output performance
Force output performance was examined by calculating the mean ± SD of force output during each of the three force conditions (F, VFL, VFH) at each of the four force blocks. This resulted in 12 values per subject. The means ± SD of force were then averaged across the four force blocks for each force condition per subject. Two separate repeated-measures ANOVAs were used to determine significant differences in the mean and SD of force across force conditions (F, VFL, VFH). The mean force was not significantly different across the three force conditions (P = 0.33). In contrast, Fig. 1B shows that the SD of force was reduced with more frequent visual feedback. The data in Fig. 1B resulted in a significant main effect across the three force conditions (P < 0.01). Post hoc t-test revealed that the VFH condition was lower in variability compared with the F and VFL condition (P < 0.01), and that the VFL condition had reduced variability compared with the F condition (P < 0.05). Thus these findings demonstrate that mean force did not change with the intermittent visual feedback frequency but that force variability decreased as the frequency of visual feedback increased.
Figure 1C depicts a force time series from a single subject producing force in the 0.4-Hz intermittent feedback condition. For the 0.4-Hz intermittent force condition, we estimated the time between the presentation of the visual feedback stimulus and the first force time point where a force correction could be detected. This was accomplished through visual inspection of each trial. As demonstrated by the data presented in Fig. 1C, the visuomotor correction occurred 260 ms after the presentation of the visual feedback in this subject. The average visuomotor correction time across all corrections during the 0.4-Hz force condition for all 10 subjects was 290 ± 33 (SD) ms. This visuomotor correction time is longer than some estimates of the minimal correction time in humans (Carlton 1992; Keele and Posner 1968). However, Miall (1996) has shown that the visuomotor feedback loop time is long (341 ms) for a slow tracking task and shorter (264 ms) for a faster tracking track, suggesting that the visuomotor feedback loop depends on the nature of the task examined.
Finding 1: effects of intermittent visual feedback on cerebellar activation during force production
The first important finding pertains to the differential effect that intermittent visual feedback had on different anatomical regions of the cerebellum. Figure 2 depicts the group map data after the Fisher group test during the t-test comparisons for F-R (A), VFH-F (B), VFH-VH (C), VFH-VFL (D), and VFL-F (E). Our findings at the group level were also found in all 10 individuals in the study. Figure 2A (F-R) shows that lobule V/VI of the right cerebellar hemisphere was active. This activation in lobule V/VI was more anterior and medial to the activation in the right and left lateral cerebellum from the VFH-F comparison (Fig. 2B). The VFH-F comparison was active bilaterally in lobule VI/Crus I of the lateral cerebellar hemisphere, and this activation did not occur in the control condition of visual feedback at high frequency compared with the rest condition (VH-R, not shown). This point is further strengthened by the data in Fig. 2C where the VFH-VH comparison is depicted, and the visuomotor activation in the right and left cerebellum remain. In addition, Fig. 2D confirms the observations in B and C that the VFH condition had visuomotor activation greater than the VFL condition. The combined result from the VFH-F and VFH-VH comparisons demonstrate the visuomotor activation was not due to visual or motor processes. The VFL-F (Fig. 2E) comparison did not result in significant activation in the lateral cerebellum (lobule VI/Crus I) related to visuomotor signals. There was activation in the cerebellum more inferiorly (Z = −38), but this same region of activation also occurred in the VL-R condition indicating that it was not visuomotor but related to visual target detection.
The activation in the cerebellum was then examined using ROIs analyses. We drew two ROIs in the cerebellum in the anterior intermediate zone (Fig. 2A, primarily lobule V/VI) and in the lateral cerebellum (Fig. 2, B and C, primarily lobule VI/Crus I) on the right and left hemispheres. The activation volume and percent signal change during the F-R, VFL-R, and VFH-R comparisons were calculated in each ROI.
Figure 3 depicts the percent signal change and activation volume in the three comparisons for the right lateral cerebellum and right anterior intermediate cerebellum. We used separate repeated-measures ANOVAs to compare the percent signal change and activation volume in the lateral cerebellum and anterior intermediate cerebellum for the right and left hemispheres. Thus there were eight separate ANOVAs conducted for the cerebellum. The two ANOVAs examining percent signal change and activation volume for the right lateral cerebellum were both significant (all P’s < 0.05) (Fig. 3, A and B). For the left lateral cerebellum, only the activation volume resulted in a significant main effect (P < 0.05), whereas the percent signal change was nonsignificant (P > 0.2). In contrast, the four ANOVAs for the anterior intermediate cerebellum were all non significant (all P’s > 0.2; Fig. 3, C and D). This finding indicates that the left and right anterior intermediate cerebellar lobes had similar levels of activation independent of the visual feedback frequency. Next, we conducted post hoc comparisons using t-test between the force conditions where we found a significant main effect on the lateral cerebellum.
FIG. 3.
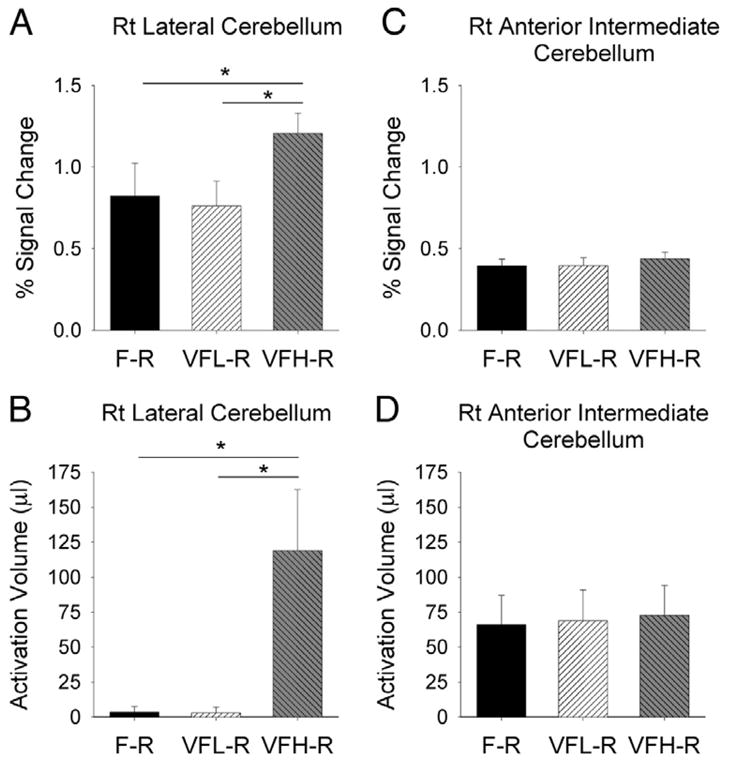
ROI analysis from percent signal change and activation volume in the cerebellum. A: percent signal change averaged across subjects in each of the 3 force conditions compared with rest in the right lateral cerebellum. B: activation volume in right lateral cerebellum. C: percent signal change in the right anterior intermediate cerebellum. D: activation volume in the right anterior intermediate cerebellum. Significance is indicated at P < 0.05. Only significant comparisons are indicated. Error bars represent +1 SD.
The main finding from Fig. 3A is that in the right lateral cerebellum the VFH-R condition had a significantly greater percent signal change compared with the F-R (P < 0.05) and the VFL-R conditions (P < 0.05). As shown in Fig. 3B, a similar pattern of findings was observed for the activation volume in the right lateral cerebellum (VFH-R to F-R: P < 0.05; VFH-R to VFL-R: P < 0.05). The volume was signifi-cantly different in the left lateral cerebellum: VFH-R greater than F-R (P < 0.01), VFH-R greater than VFL-R (P < 0.05), but no difference between VFL-R compared with F-R (P = 0.88). These findings demonstrate that the activation volume and percent signal change in lateral cerebellum did not increase during the grip force condition with low-frequency visual feedback (0.4 Hz). We did find increased activation volume bilaterally in the lateral cerebellum and increased percent signal change in the right lateral cerebellum during the grip force condition with high-frequency visual feedback (25 Hz).
Findings 2 and 3: effects of intermittent visual feedback on activation in the parietal and premotor cortex during force production
The second important finding is that the parietal cortex and premotor cortex were active during infrequent visual feedback, as well as during frequent visual feedback. Figure 4 depicts group map activation from four different statistical comparisons: VFH-F, VFH-VH, VFL-F, and VFL-VL. Each of these comparisons is shown at Z slice 57, 46, and 36 mm. For the VFH-F comparison, Fig. 4A shows that the SMA, bilateral PMd, bilateral PMv, bilateral IPL, and SPL were all active. The activation was interpreted as visuomotor activation because we found that the activation also occurred in the VFH-VH comparison. Figure 4B shows the VFL-F condition where we found increased activation in the SMA, bilateral PMd, bilateral PMv, and right IPL. We found analogous activation in the VFL-VL comparison.
Next, we conducted ROI analyses to quantify the extent of the differences in volume and percent signal change in both parietal and premotor cortices across the F-R, VFL-R, and VFH-R conditions. From this analysis, the third important finding is that specific visuomotor regions of the right hemisphere of the parietal and premotor cortex increased in activation with the frequency of visual information. Figure 5 shows the percent signal change in the ROIs from PMd, PMv, IPL, and SPL from the right and left hemisphere. We used separate repeated-measures ANOVAs to compare the percent signal change and activation volume in PMd, PMv, SMA, IPL, and SPL for the right and left hemispheres. This resulted in 18 separate ANOVAs instead of 20 because the SMA was examined in the right and left hemispheres combined (see ROI in Fig. 4A). The ANOVAs for the right and left PMd, right and left PMv, right IPL, and SMA were significant for both percent signal change and activation volume (all P’s < 0.05). For right SPL, only the activation volume resulted in a significant main effect in the ANOVA (P < 0.05), but percent signal change failed to reach significance (P > 0.2). The ANOVAs for the left IPL and left SPL were nonsignificant for both percent signal change and activation volume (all P’s > 0.2). Next, we conducted post hoc comparisons using t-test between the force conditions where we found a significant main effect in the ANOVA.
FIG. 5.
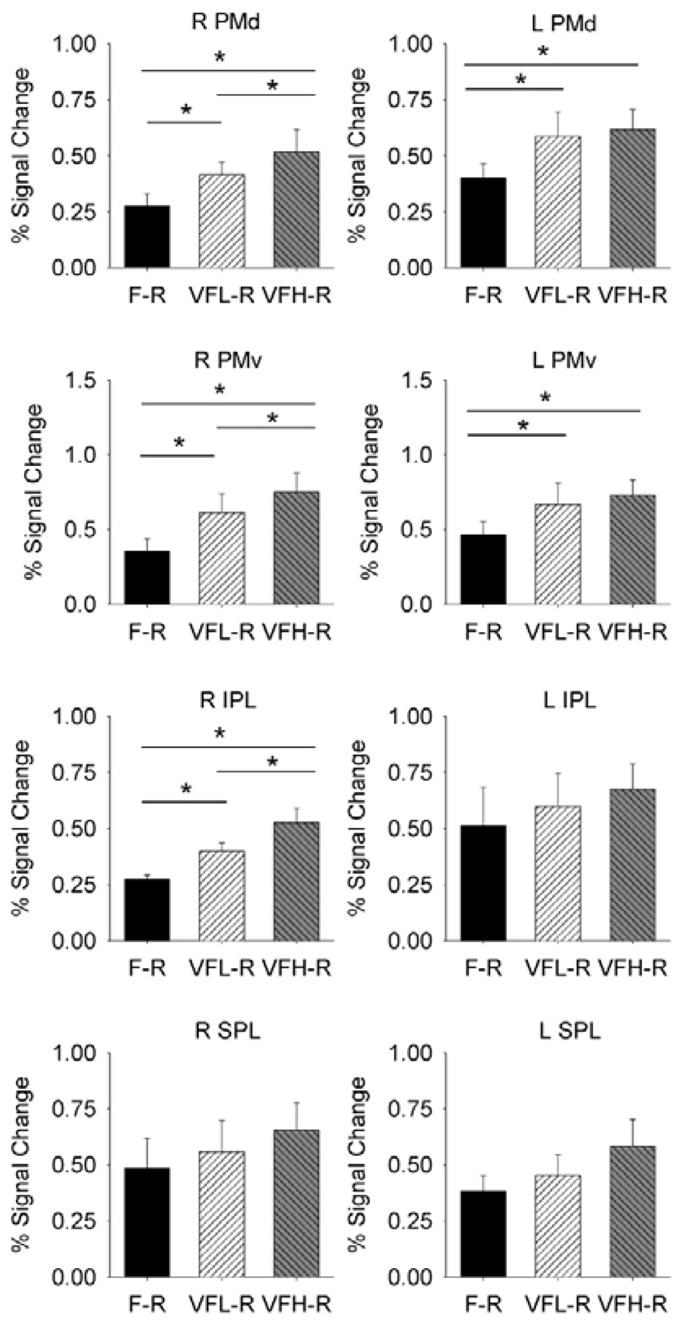
ROI analysis from percent signal change in parietal cortex and premotor cortex. Right and left PMd, right and left PMv, right and left IPL, and right and left SPL are depicted. Significance is indicated at P < 0.05. Only significant comparisons are indicated. Error bars represent +1 SD.
Using post hoc comparison t-test, the right and left PMd, right and left PMv, and right IPL had increased percent signal change for VFL-R and VFH-R compared with the F-R condition (all Ps < 0.05). Although not depicted, the activation volume was also consistent with the percent signal change in showing that VFH-R and VFL-R had greater activation volume compared with the F-R condition in the right and left PMd, right and left PMv, and right IPL (all P’s < 0.05). For right SPL, the main effect for the activation volume was due to an increase for VFH-R compared with F-R (P < 0.05), whereas VFL-R compared with F-R was nonsignificant (P > 0.2). Finally, SMA had an increased percent signal change and activation volume during the VFH-R compared with each of the VFL-R and F-R conditions (P’s < 0.01), but there was no difference between VFL-R and F-R in the SMA (P’s > 0.2).
Finally, Fig. 5 shows that the main differences between the high (VFH-R) and low (VFL-R) force control conditions occurred in the right hemisphere and not in the left hemisphere. This is evident in Fig. 5 where the right PMd, right PMv, and right IPL were significantly greater for the VFH-R compared with VFL-R (all Ps < 0.05). In the following section, we have conducted control analyses to directly compare VH-R and VL-R, and the findings indicate that visual feedback frequency alone cannot explain these findings.
Effects of intermittent visual feedback without force production
We conducted a control analysis to determine if the frequency of visual feedback during the VH and VL conditions could have caused the differences observed in Figs. 3 and 5 for the parietal cortex, premotor cortex, and cerebellum. Paired t-tests were used to compare the VH-R and VL-R percent signal change and activation volume for visuomotor ROIs in the right and left PMd, PMv, IPL, SPL, lateral cerebellum, and SMA. The P value from each t-test comparison did not approach significance (all Ps > 0.2). These additional control analyses demonstrate that the differences observed between the VFH and VFL conditions in Figs. 3 and 5 were not due to the feedback frequency alone but due to visuomotor processing at different feedback frequencies.
DISCUSSION
This study examined the effects of frequent and infrequent intermittent visual feedback on the functional activation of the cerebellum, parietal cortex, and premotor cortex during precision grip force production in humans. The study yielded three important findings. First, infrequent (0.4 Hz) visual feedback did not result in visuomotor activation in lobule VI/Crus I of the lateral cerebellum, whereas frequent (25 Hz) intermittent visual feedback did. Second, the parietal cortex and premotor cortex were active during both infrequent and frequent visuomotor processing. Third, the level of visuomotor activation was greater during frequent compared with infrequent visual feedback in the right hemisphere for IPL, PMv, and PMd. In the following sections, we first discuss the role of the cerebellum in processing visual information during force control and then discuss the role of the parietal and premotor cortex. The final section synthesizes the new findings that extend previous work on visuomotor processing.
Cerebellum and intermittent visual feedback
A contemporary hypothesis of one function of the cerebellum in visually guided control is that the cerebellum processes the delayed visual reafference signal from the ongoing movement (Liu et al. 2003). The visual reafference signal represents the visual outcome of motor output. Liu and colleagues (2003) examined simple spike neuronal activity in monkeys performing visually guided step-tracking movements while viewing a video display with visual feedback delays ≤200 ms. They found that although cursor-related cells in the lateral cerebellum had an onset time-locked with the arm movement, their duration of activation was extended by a similar amount as the experimenter imposed feedback delay. These findings were interpreted in support of the visual reafference hypothesis. Kitazawa and colleagues (1998) used a different paradigm to examine complex spikes from Purkinje cells in lobules IV–VI during reaching movements in monkeys. When the monkeys began the reach, liquid-crystal shutters excluded the hand and the target position until the monkey’s hand reached the target. The monkeys then viewed their hand position in relation to the target for 300 ms. The authors found that the complex spikes occurring at the beginning of the reach movement encoded the absolute destination of the reach, whereas complex spikes occurring 150–300 ms after the end of the movement encoded relative error based on visual information (see Fig. 4A, Kitazawa et al. 1998). The concept of visual reafference is further supported by the correlation between the simple spike discharge of Purkinje cells with hand and cursor movements. Ebner and Fu (1997) showed that in non-human primates, the simple spike discharges that correlated with movement kinematics led the arm movement, whereas simple spike discharge correlation with the visual cursor lagged behind the cursor. Thus it appears that after a visually guided correction is implemented, the lateral cerebellum receives a delayed signal related to the visual reafference of the motor correction.
The current finding from the cerebellum provides the first support for the visual reafference hypothesis in humans. During our infrequent intermittent force condition, subjects viewed the visual feedback signal for only 20 ms every 2.5 s (0.4-Hz condition). We found reliable and regular visually-guided corrections in the force trace during the infrequent intermittent feedback condition (Fig. 1C). In addition, force variability was reduced in the infrequent intermittent condition compared with the no visual feedback force condition (Fig. 1B), further demonstrating that error correction processes occurred with low-frequency visual feedback. However, the infrequent visual feedback stimulus did not elicit neuronal activity in the lateral cerebellum; this may indicate the visual reafference signal was not triggered (Figs. 2E and 3). During the infrequent visual feedback alone condition, the visual cortex, parietal cortex and the cerebellum were all active compared with rest, indicating that this was a sufficient visual stimulus to elicit neuronal activity. Because the visual reafference signal has been shown to reach the lateral cerebellum after ~150–300 ms after the ongoing motor correction (Kitazawa et al. 1998), we suggest that the absence of the visual feedback signal during this time period for the infrequent visuomotor condition may have prevented the visual reafference signal from being engaged in the cerebellum. We further suggest that the absence of the visual reafference signal in the lateral cerebellum is consistent with the interpretation that it is one component of the visuomotor processing system that limited the ability of our subjects to reduce variability during the infrequent condition (Fig. 1).
When visual feedback was presented frequently during force production the lateral cerebellum (lobule VI/Crus I) was involved in visuomotor processing (Figs. 2. B–D, and Fig. 3) (Vaillancourt et al. 2003). In addition, force variability was reduced in the frequent visuomotor condition compared with the infrequent and no visual feedback conditions. Because the visual stimulus appeared on the display after motor corrections, we suggest that the visual reafference signal was most likely engaged in the lateral cerebellum allowing further reduction in the variability of grip force. It follows that during adaptation and learning the visual reafference signal could provide a tuning mechanism that enhances performance during manual tasks (Debaere et al. 2004; Krakauer et al. 2004; Seidler et al. 2002).
Nonvisual motor processes occurred in the anterior cerebellum independently from visual feedback (lobule V/VI). Our current data in the anterior intermediate cerebellum are consistent with previous data from a force control task in showing sensory-motor activation independent from visual feedback (Vaillancourt et al. 2003). Our data are also consistent with a study investigating reaching movements without vision where activation was found in the left posterior parietal cortex, left primary motor cortex, and the anterior intermediate cerebellum (Desmurget et al. 2001).
Intermittent visual feedback and the parietal and premotor cortex
Our finding that the parietal cortex and premotor cortex are involved in visuomotor processing during frequent visual feedback is in agreement with previous reports (Caminiti et al. 1996; Culham et al. 2003; Desmurget et al. 1999; Johnson et al. 1996; Krakauer et al. 2004; Milner and Goodale 1993). Our second new finding was that bilateral PMd, bilateral PMv, and right IPL (Figs. 4 and 5) had increased signal intensity during infrequent intermittent force control compared with force control without visual feedback. This finding extends previous work because virtually all studies of the visuomotor system have previously investigated continuous rather than intermittent visual feedback. In addition, although the percent signal change and activation for SMA were increased in the grip force condition with frequent visual feedback, we did not find increased percent signal change and activation volume with infrequent visual feedback. Thus, although the SMA has been classically associated primarily with internally generated tasks (Jahanshahi et al. 1995; Mushiake et al. 1991), our current data and recent evidence from studies of electrophysiology in animals (Picard and Strick 2003) and human neuroimaging (Vaillancourt et al. 2003) demonstrate that the SMA is also important in the control of visually guided movement. The current findings indicate that the SMA is mainly involved during visually guided motor control with high-frequency visual feedback.
Visuomotor activation and visual feedback frequency
The third new finding was that we did not find a one-to-one mapping between increases in visual information and processing of the visuomotor system. For example, one might have anticipated that the same regions active during the infrequent condition would have had an incremental increase in activation during the frequent condition. Had this been true, bilateral PMd, bilateral PMv, SMA, and right IPL would have had the greatest level of activation during the frequent visually guided force condition. This was not the case. We found that only the right PMd, right PMv, and right IPL had increased signal change during the frequent compared with the infrequent visually guided force condition. The increase in signal intensity could have potentially been due to additional error correction processes occurring in these regions. Because force variability was reduced during the frequent condition compared with the infrequent condition, this lends support to the hypothesis that additional error correction processes may have occurred in PMd, PMv, and IPL during the frequent condition. Another intriguing possibility is that during the frequent condition, attentional mechanisms may have been engaged to a greater extent than during the infrequent condition, therefore increasing activation in the right parietal and premotor cortices. Previous studies have identified a ventral frontoparietal network, also localized in the right hemisphere, that is involved in attention to visual stimuli (Arrington et al. 2000; Corbetta and Shulman 2002; Corbetta et al. 2000).
In summary, for several decades the examination of visuomotor processing has primarily focused on three brain regions: the cerebellum, parietal cortex, and premotor cortex. A major reason for this is because the parietal cortex receives visual input from visual cortex, and visual information projects from the dorsal parietal cortex to the cerebellum (Glickstein 2000; Middleton and Strick 1998; Suzuki et al. 1990) and premotor cortex (Caminiti et al. 1996). We have shown that the lateral cerebellum (lobule VI/Crus I) is involved in visuomotor processing only during frequent visual feedback. In addition, IPL, PMd, and PMv are involved in visuomotor processing when visual feedback is presented both frequently and infrequently. Finally, we found that the right IPL, right PMv, and right PMd increased in neural activity across each feedback frequency level with the greatest activation occurring during the frequent visual feedback condition. These findings lead to the general conclusion that frequent visual feedback causes greater neural activity in a subnetwork of the visuomotor system that has the behavioral consequences of reducing motor error. The findings further suggest that the visual reafference signal in the lateral cerebellum may become engaged once a threshold frequency is reached. Further studies are needed to identify the change in visuomotor neuronal activation across multiple levels of visual feedback frequency.
Acknowledgments
We thank Dr. Keith Thulborn for commenting on a previous version of this manuscript. We also thank D. Lee for writing the LabView data collection software. Finally, we appreciate the comments of Dr. Digby Elliott.
GRANTS
This research was supported in part by National Institute of Neurological Disorders and Stroke Grants R01-NS-52318, R01-NS-28127, and R01-NS-40902.
References
- Arrington CM, Carr TH, Mayer AR, Rao SM. Neural mechanisms of visual attention: object-based selection of a region in space. J Cogn Neurosci. 2000;12(Supp l2):106–117. doi: 10.1162/089892900563975. [DOI] [PubMed] [Google Scholar]
- Baizer JS, Kralj-Hans I, Glickstein M. Cerebellar lesions and prism adaptation in macaque monkeys. J Neurophysiol. 1999;81:1960–1965. doi: 10.1152/jn.1999.81.4.1960. [DOI] [PubMed] [Google Scholar]
- Bastian AJ, Martin TA, Keating JG, Thach WT. Cerebellar ataxia: abnormal control of interaction torques across multiple joints. J Neurophysiol. 1996;76:492–509. doi: 10.1152/jn.1996.76.1.492. [DOI] [PubMed] [Google Scholar]
- Bisley JW, Krishna BS, Goldberg ME. A rapid and precise on-response in posterior parietal cortex. J Neurosci. 2004;24:1833–1838. doi: 10.1523/JNEUROSCI.5007-03.2004. [DOI] [PMC free article] [PubMed] [Google Scholar]
- Brooks VB, Kozlovskaya IB, Atkin A, Horvath FE, Uno M. Effects of cooling dentate nucleus on tracking-task performance in monkeys. J Neurophysiol. 1973;36:974–995. doi: 10.1152/jn.1973.36.6.974. [DOI] [PubMed] [Google Scholar]
- Caminiti R, Ferraina S, Johnson PB. The sources of visual information to the primate frontal lobe: a novel role for the superior parietal lobule. Cereb Cortex. 1996;6:319–328. doi: 10.1093/cercor/6.3.319. [DOI] [PubMed] [Google Scholar]
- Carlton LG. Visual processing time and the control of movement. In: Proteau L, Elliott D, editors. Vision and Motor Control. Amsterdam: Elsevier Science Publishers; 1992. pp. 3–31. [Google Scholar]
- Clower DM, Hoffman JM, Votaw JR, Faber TL, Woods RP, Alexander GE. Role of posterior parietal cortex in the recalibration of visually guided reaching. Nature. 1996;383:618–621. doi: 10.1038/383618a0. [DOI] [PubMed] [Google Scholar]
- Corbetta M, Kincade JM, Ollinger JM, McAvoy MP, Shulman GL. Voluntary orienting is dissociated from target detection in human posterior parietal cortex. Nat Neurosci. 2000;3:292–297. doi: 10.1038/73009. [DOI] [PubMed] [Google Scholar]
- Corbetta M, Shulman GL. Control of goal-directed and stimulus-driven attention in the brain. Nat Rev Neurosci. 2002;3:201–215. doi: 10.1038/nrn755. [DOI] [PubMed] [Google Scholar]
- Cox RW. AFNI software for analysis and visualization of functional magnetic resonance neuroimages. Comput Biomed Res. 1996;29:162–173. doi: 10.1006/cbmr.1996.0014. [DOI] [PubMed] [Google Scholar]
- Culham JC, Danckert SL, DeSouza JF, Gati JS, Menon RS, Goodale MA. Visually guided grasping produces fMRI activation in dorsal but not ventral stream brain areas. Exp Brain Res. 2003;153:180–189. doi: 10.1007/s00221-003-1591-5. [DOI] [PubMed] [Google Scholar]
- Dai TH, Liu JZ, Sahgal V, Brown RW, Yue GH. Relationship between muscle output and functional MRI-measured brain activation. Exp Brain Res. 2001;140:290–300. doi: 10.1007/s002210100815. [DOI] [PubMed] [Google Scholar]
- Debaere F, Wenderoth N, Sunaert S, Van Hecke P, Swinnen SP. Changes in brain activation during the acquisition of a new bimanual coodination task. Neuropsychologia. 2004;42:855–867. doi: 10.1016/j.neuropsychologia.2003.12.010. [DOI] [PubMed] [Google Scholar]
- Della-Maggiore V, Malfait N, Ostry DJ, Paus T. Stimulation of the posterior parietal cortex interferes with arm trajectory adjustments during the learning of new dynamics. J Neurosci. 2004;24:9971–9976. doi: 10.1523/JNEUROSCI.2833-04.2004. [DOI] [PMC free article] [PubMed] [Google Scholar]
- Desmurget M, Epstein CM, Turner RS, Prablanc C, Alexander GE, Grafton ST. Role of the posterior parietal cortex in updating reaching movements to a visual target. Nat Neurosci. 1999;2:563–567. doi: 10.1038/9219. [DOI] [PubMed] [Google Scholar]
- Desmurget M, Grea H, Grethe JS, Prablanc C, Alexander GE, Grafton ST. Functional anatomy of nonvisual feedback loops during reaching: a positron emission tomography study. J Neurosci. 2001;21:2919–2928. doi: 10.1523/JNEUROSCI.21-08-02919.2001. [DOI] [PMC free article] [PubMed] [Google Scholar]
- Ebner TJ, Fu Q. What features of visually guided arm movements are encoded in the simple spike discharge of cerebellar Purkinje cells? Prog Brain Res. 1997;114:431–447. doi: 10.1016/s0079-6123(08)63379-8. [DOI] [PubMed] [Google Scholar]
- Eddy WF, Fitzgerald M, Genoves CR, Mockus A. Functional Image Analysis Software-Computational Olio. Heidelberg, Germany: Physica-Verlag; 1996. [Google Scholar]
- Ehrsson HH, Fagergren A, Jonsson T, Westling G, Johansson RS, Forssberg H. Cortical activity in precision- versus power-grip tasks: an fMRI study. J Neurophysiol. 2000;83:528–536. doi: 10.1152/jn.2000.83.1.528. [DOI] [PubMed] [Google Scholar]
- Ellermann JM, Siegal JD, Strupp JP, Ebner TJ, Ugurbil K. Activation of visuomotor systems during visually guided movements: a functional MRI study. J Magn Reson. 1998;131:272–285. doi: 10.1006/jmre.1998.1379. [DOI] [PubMed] [Google Scholar]
- Fisher R. Statistical Methods for Research Workers. London: Oliver and Boyd; 1950. [Google Scholar]
- Genovese CR, Lazar NA, Nichols T. Thresholding of statistical maps in functional neuroimaging using the false discovery rate. Neuroimage. 2002;15:870–878. doi: 10.1006/nimg.2001.1037. [DOI] [PubMed] [Google Scholar]
- Glickstein M. How are visual areas of the brain connected to motor areas for the sensory guidance of movement? Trends Neurosci. 2000;23:613–617. doi: 10.1016/s0166-2236(00)01681-7. [DOI] [PubMed] [Google Scholar]
- Hamzei F, Dettmers C, Rijntjes M, Glauche V, Kiebel S, Weber B, Weiller C. Visuomotor control within a distributed parieto-frontal network. Exp Brain Res. 2002;146:273–281. doi: 10.1007/s00221-002-1139-0. [DOI] [PubMed] [Google Scholar]
- Holmes G. The cerebellum of man. Brain. 1939;62:1–30. [Google Scholar]
- Imamizu H, Miyauchi S, Tamada T, Sasaki Y, Takino R, Putz B, Yoshioka T, Kawato M. Human cerebellar activity reflecting an acquired internal model of a new tool. Nature. 2000;403:192–195. doi: 10.1038/35003194. [DOI] [PubMed] [Google Scholar]
- Jahanshahi M, Jenkins IH, Brown RG, Marsden CD, Passingham RE, Brooks DJ. Self-initiated versus externally triggered movements. I. An investigation using measurement of regional cerebral blood flow with PET and movement-related potentials in normal and Parkinson’s disease subjects. Brain. 1995;118:913–933. doi: 10.1093/brain/118.4.913. [DOI] [PubMed] [Google Scholar]
- Jeannerod M, Arbib MA, Rizzolatti G, Sakata H. Grasping objects: the cortical mechanisms of visuomotor transformation. Trends Neurosci. 1995;18:314–320. [PubMed] [Google Scholar]
- Johnson PB, Ferraina S, Bianchi L, Caminiti R. Cortical networks for visual reaching: physiological and anatomical organization of frontal and parietal lobe arm regions. Cereb Cortex. 1996;6:102–119. doi: 10.1093/cercor/6.2.102. [DOI] [PubMed] [Google Scholar]
- Keele SW, Posner MI. Processing of visual feedback in rapid movements. J Exp Psychol. 1968;77:155–158. doi: 10.1037/h0025754. [DOI] [PubMed] [Google Scholar]
- Kilner JM, Alonso-Alonso M, Fisher R, Lemon RN. Modulation of synchrony between single motor units during precision grip tasks in humans. J Physiol. 2002;541:937–948. doi: 10.1113/jphysiol.2001.013305. [DOI] [PMC free article] [PubMed] [Google Scholar]
- Kilner JM, Salenius S, Baker SN, Jackson A, Hari R, Lemon RN. Task-dependent modulations of cortical oscillatory activity in human subjects during a bimanual precision grip task. Neuroimage. 2003;18:67–73. doi: 10.1006/nimg.2002.1322. [DOI] [PubMed] [Google Scholar]
- Kitazawa S, Kimura T, Yin PB. Cerebellar complex spikes encode both destinations and errors. Nature. 1998;392:494–497. doi: 10.1038/33141. [DOI] [PubMed] [Google Scholar]
- Krakauer JW, Ghilardi MF, Mentis M, Barnes A, Veytsman M, Eidelberg D, Ghez C. Differential cortical and subcortical activations in learning rotations and gains for reaching: a PET study. J Neurophysiol. 2004;91:924–933. doi: 10.1152/jn.00675.2003. [DOI] [PubMed] [Google Scholar]
- Lazar NA, Luna B, Sweeney JA, Eddy WF. Combining brains: a survey of methods for statistical pooling of information. Neuroimage. 2002;16:538–550. doi: 10.1006/nimg.2002.1107. [DOI] [PubMed] [Google Scholar]
- Liu JZ, Dai TH, Elster TH, Sahgal V, Brown RW, Yue GH. Simultaneous measurement of human joint forces, surface electromyograms, and functional MRI-measured brain acitvation. J Neurosci Methods. 2000;101:49–57. doi: 10.1016/s0165-0270(00)00252-1. [DOI] [PubMed] [Google Scholar]
- Liu X, Robertson E, Miall RC. Neuronal activity related to the visual representation of arm movements in the lateral cerebellum. J Neurophysiol. 2003;89:1223–1237. doi: 10.1152/jn.00817.2002. [DOI] [PubMed] [Google Scholar]
- Mayka MA, Corcos DM, Vaillancourt DE. Locations and boundaries of the motor and premotor regions in functional brain imaging: a meta-analysis Washington, DC. Soc Neurosci. :653.14, 2004. doi: 10.1016/j.neuroimage.2006.02.004. [DOI] [PMC free article] [PubMed] [Google Scholar]
- Miall RC. Task-dependent changes in visual feedback control: a frequency analysis of human manual tracking. J Mot Behav. 1996;28:125–135. doi: 10.1080/00222895.1996.9941739. [DOI] [PubMed] [Google Scholar]
- Miall RC, Reckess GZ, Imamizu H. The cerebellum coordinates eye and hand tracking movements. Nat Neurosci. 2001;4:638–644. doi: 10.1038/88465. [DOI] [PubMed] [Google Scholar]
- Miall RC, Weir DJ, Stein JF. Visuomotor tracking during reversible inactivation of the cerebellum. Exp Brain Res. 1987;65:455–464. doi: 10.1007/BF00236319. [DOI] [PubMed] [Google Scholar]
- Middleton FA, Strick PL. The cerebellum: an overview. Trends Neurosci. 1998;21:367–369. doi: 10.1016/s0166-2236(98)01330-7. [DOI] [PubMed] [Google Scholar]
- Milner AD, Goodale MA. Visual pathways to perception and action. Prog Brain Res. 1993;95:317–337. doi: 10.1016/s0079-6123(08)60379-9. [DOI] [PubMed] [Google Scholar]
- Mountcastle VB, Lynch JC, Georgopoulos A, Sakata H, Acuna C. Posterior parietal association cortex of the monkey: command functions for operations within extrapersonal space. J Neurophysiol. 1975;38:871–908. doi: 10.1152/jn.1975.38.4.871. [DOI] [PubMed] [Google Scholar]
- Mushiake H, Ianse M, Tanji J. Neuronal activity in the primate premotor, supplementary, and precentral motor cortex during visually guided and internally determined sequential movements. J Neurophysiol. 1991;66:705–717. doi: 10.1152/jn.1991.66.3.705. [DOI] [PubMed] [Google Scholar]
- Mushiake H, Strick PL. Preferential activity of dentate neurons during limb movements guided by vision. J Neurophysiol. 1993;70:2660–2664. doi: 10.1152/jn.1993.70.6.2660. [DOI] [PubMed] [Google Scholar]
- Norris SA, Greger B, Hathaway EN, Thach WT. Purkinje cell spike firing in the posterolateral cerebellum: correlation with visual stimulus, oculomotor response, and error feedback. J Neurophysiol. 2004;92:1867–1879. doi: 10.1152/jn.01251.2003. [DOI] [PubMed] [Google Scholar]
- Picard N, Strick PL. Activation of the supplementary motor area (SMA) during performance of visually guided movements. Cereb Cortex. 2003;13:977–986. doi: 10.1093/cercor/13.9.977. [DOI] [PubMed] [Google Scholar]
- Ramnani N, Toni I, Passingham RE, Haggard P. The cerebellum and parietal cortex play a specific role in coordination: a PET study. Neuroimage. 2001;14:899–911. doi: 10.1006/nimg.2001.0885. [DOI] [PubMed] [Google Scholar]
- Schmahmann JD, Doyon J, Toga AW, Petrides M, Evans AC. MRI Atlas of the Human Cerebellum. San Diego, CA: Academic; 2000. [DOI] [PubMed] [Google Scholar]
- Seidler RD, Purushotham A, Kim SG, Ugurbil K, Willingham D, Ashe J. Cerebellum activation associated with performance change but not motor learning. Science. 2002;296:2043–2046. doi: 10.1126/science.1068524. [DOI] [PubMed] [Google Scholar]
- Simo LS, Krisky CM, Sweeney JA. Functional neuroanatomy of anticipatory behavior: dissociation between sensory-driven and memory-driven systems. Cereb Cortex. 2005;15:1982–1991. doi: 10.1093/cercor/bhi073. [DOI] [PubMed] [Google Scholar]
- Slifkin AB, Vaillancourt DE, Newell KM. Intermittency in the control of continuous force production. J Neurophysiol. 2000;84:1708–1718. doi: 10.1152/jn.2000.84.4.1708. [DOI] [PubMed] [Google Scholar]
- Stein JF, Glickstein M. Role of the cerebellum in visual guidance of movement. Physiol Rev. 1992;72:967–1017. doi: 10.1152/physrev.1992.72.4.967. [DOI] [PubMed] [Google Scholar]
- Suzuki DA, May JG, Keller EL, Yee RD. Visual motion response properties of neurons in dorsolateral pontine nucleus of alert monkey. J Neurophysiol. 1990;63:37–59. doi: 10.1152/jn.1990.63.1.37. [DOI] [PubMed] [Google Scholar]
- Thulborn KR. Visual feedback to stabilize head position for fMRI. Magnetic Resonance in Medicine. 1999;41:1039–1043. doi: 10.1002/(sici)1522-2594(199905)41:5<1039::aid-mrm24>3.0.co;2-n. [DOI] [PubMed] [Google Scholar]
- Vaillancourt DE, Mayka MA, Thulborn KR, Corcos DM. Subthalamic nucleus and internal globus pallidus scale with the rate of change of force production in humans. Neuroimage. 2004;23:175–186. doi: 10.1016/j.neuroimage.2004.04.040. [DOI] [PubMed] [Google Scholar]
- Vaillancourt DE, Slifkin AB, Newell KM. Intermittency in the visual control of force in Parkinson’s disease. Exp Brain Res. 2001;138:118–127. doi: 10.1007/s002210100699. [DOI] [PubMed] [Google Scholar]
- Vaillancourt DE, Thulborn KR, Corcos DM. Neural basis for the processes that underlie visually guided and internally guided force control in humans. J Neurophysiol. 2003;90:3330–3340. doi: 10.1152/jn.00394.2003. [DOI] [PubMed] [Google Scholar]
- van Donkelaar P, Lee RG. Interactions between the eye and hand motor systems: disruptions due to cerebellar dysfunction. J Neurophysiol. 1994;72:1674–1685. doi: 10.1152/jn.1994.72.4.1674. [DOI] [PubMed] [Google Scholar]
- Witney AG, Wing A, Thonnard JL, Smith AM. The cutaneous contribution to adaptive precision grip. Trends Neurosci. 2004;27:637–643. doi: 10.1016/j.tins.2004.08.006. [DOI] [PubMed] [Google Scholar]
- Wolpert DM, Miall RC, Kawato M. Internal models in the cerebellum. Trends Cognit Sci. 1998;2:338–347. doi: 10.1016/s1364-6613(98)01221-2. [DOI] [PubMed] [Google Scholar]