

Abstract
The majority of maturing T lymphocytes that recognize self-antigens is eliminated in the thymus upon exposure to their target antigens. This physiological process of negative selection requires that tissue-specific antigens be expressed by thymic cells, a phenomenon that has been well studied in experimental animals. Here, we have examined the expression in human thymi of four retinal antigens, that are capable of inducing autoimmune ocular disease retinal S-antigen (S-Ag), recoverin, RPE65 and inter-photoreceptor retinoid-binding protein (IRBP)], as well as four melanocyte-specific antigens, two of which are used as targets for melanoma immunotherapy [gp100, melanoma antigen recognized by T cells 1, tyrosinase-related protein (TRP)-1 and TRP-2]. Using reverse transcription (RT)–PCR, we found that all thymic samples from the 18 donors expressed mRNA transcripts of most or all the eight tested tissue antigens. Yet, the expression of the transcripts varied remarkably among the individual thymic samples. In addition, S-Ag, RPE65 and IRBP were detected by immunostaining in rare cells in sections of human thymi by antibodies against these proteins. Quantitative real-time RT–PCR analysis revealed that the retinal antigen transcripts in the human thymus are present at trace levels, that are lower by approximately five orders of magnitude than those in the retina. Our observations thus support the notions that thymic expression is a common feature for all tissue-specific antigens and that the levels of expression play a role in determining the susceptibility to autoimmunity against these molecules.
Keywords: autoimmunity, retinal antigen, susceptibility to disease, tolerance, tumor immunity
Introduction
Studies of recent years have shown that many tissue-specific antigens are expressed in the thymus, thus allowing the deletion of T cells specific to these molecules by negative selection. This process is crucial for all mammals by being the main mechanism for elimination of the great majority of T cells specific for self-antigens, cells that carry the potential of initiating pathogenic autoimmunity (1–3). This notion has received supporting evidence from studies with both experimental animals and humans. Strains of animals that express detectable levels of immunopathogenic antigens in their thymi were found to be resistant to experimental autoimmune diseases that are induced by immunization with these antigens. These antigens include retinal molecules, such as retinal S-antigen (S-Ag) (also designated ‘arrestin’) or inter-photoreceptor retinoid-binding protein (IRBP) (4), and the splice variant ‘DM20’ of proteolipid protein (PLP), that contains the immunopathogenic epitope for the resistant strain C57Bl/6, but not the epitope that is encephalogenic for the susceptible strain SJL/J (5, 6). Notably, two of the early reports to indicate the relationship between thymic expression of tissue antigens and autoimmune disease were carried out in humans, showing a correlation between the thymic expression of particular allelic variants of the insulin gene and susceptibility to insulin-dependent diabetes mellitus (7, 8). The critical role of thymic expression of insulin for the development of tolerance to this self-antigen has been further established in other studies (9, 10).
On the other hand, thymic expression of self-antigens that are also expressed by cancer cells may impair the ability of the immune system to react against the tumor, by eliminating the T cells that are specific against these self-antigens. Such T cells are currently being used in immunotherapeutic studies in human (11, 12). The tumor-associated target antigens in many of these studies include melanocyte-specific molecules such as melanoma antigens recognized by Tcells (MART)-1 or gp100 (11, 12).
The present study was aimed at studying the expression in human thymi of two groups of antigens, i.e. uveitogenic retinal antigens and melanocyte-specific antigens. Samples of the 18 human thymi were analyzed by reverse transcription (RT)–PCR for the presence of mRNA transcripts of four retinal antigens (S-Ag, IRBP, recoverin and RPE65) (13, 14) and four melanocyte antigens [MART-1, gp100, tyrosinase-related protein (TRP)-1 and TRP-2] (11, 12, 15). Transcripts of all the eight antigens were detected in most thymic samples, in line with the notion that thymic expression is a common feature to all peripheral tissue antigens. On the other hand, a remarkable level of variability was observed among the individual thymi in their expression of the different transcripts, suggesting different levels of thymic deletion that could affect these individuals’ susceptibility to autoimmunity toward these antigens. The actual expression of retinal antigens was also demonstrated by immunostaining of thymic sections with specific antibodies.
Methods
Thymic samples
Human thymus samples were collected from patients during surgery for congenital heart diseases after informed consent was obtained from each patient's parents. This study was approved by Institutional Review Boards of all three institutions, the Children's National Medical Center, University of Miami and the National Institutes of Health (NIH).
The demographic details of the donors included in the RT–PCR study are recorded in Table 1. The age of most donors ranged between 1 month and 3 years. Ten donors were female and seven were male. No information was available on one donor. Donors of tissues used for the immunostaining studies included eight subjects, ranging in age between 2 months and 14 years. Three of these were male, four were female and gender was unknown for one donor.
Table 1.
Demographic profiles of thymic donors
| Donor no. | Age | Gender |
|---|---|---|
| 1 | 6 months | M |
| 2 | 3 years 8 months | F |
| 3 | 2 months | F |
| 4 | 1 years 2 months | F |
| 5 | 8 months | F |
| 6 | NA | NA |
| 7 | 4 months | F |
| 8 | 6 months | F |
| 9 | 3 years 10 months | F |
| 10 | 1 years 11 months | M |
| 11 | 8 months | M |
| 12 | 7 months | M |
| 13 | 16 years 4 months | F |
| 14 | 11 months | F |
| 15 | 4 months | F |
| 16 | 5 months | M |
| 17 | 1 months | M |
| 18 | 1 years | M |
Abbreviations: M, male; F, female, and NA, not available.
Preparation of cDNA from human thymi
Each thymus sample was cut into small pieces and samples from various regions of the tissue were pooled for RNA extraction. Total RNA was extracted from these samples using TRIZol reagent according to the procedures recommended by the manufacturer (GIBCO-BRL, Gaithersburg, MD, USA). A total of 10 lg of RNA was annealed to oligo(dT)12–16 coupled to magnetic beads (Dynal Corporation, Lake Success, NY, USA) for 15 min. The immobilized mRNA was washed and suspended in reaction mix containing 2 U Retrotherm reverse transcriptase (Epicentre Technologies, Madison, WI, USA) and 100 U Super Script II Reverse Transcriptase (GIBCO-BRL). cDNA synthesis was performed by incubation at 40°C for 10 min, followed by a gradual increase in temperature to 65°C over a 10-min period and continued incubation at 65°C for an additional 50 min. Residual RNA was removed by hydrolysis with 2 M NaOH for 30 s and samples were washed three times with TE (10 mM Tris pH 7.5, 0.1 mM EDTA) and suspended in 50 μl TE/glycerol solution (1 : 1). A negative control reaction without reverse transcriptase was performed for each RNA sample.
RT–PCR for retinal and melanocyte antigens
A total of 1 μl of cDNA, 0.4 μM of both forward and reverse primers and 0.2 mM of deoxynucleoside triphosphate were subjected to hot-start PCR with 1.5 U AmpliTaq Gold DNA polymerase (ABI, Foster City, CA, USA) in a total volume of 25 μl. Samples were incubated at 95°C for 10 min to activate the AmpliTaq Gold and amplification was carried out for 30, 33, 37 or 40 cycles of 30 s each at 95, 60 and 72°C. This was followed by a final 7-min extension at 72°C. The primers used are shown in Table 2. Each primer pair was designed to span at least one intron to distinguish RT–PCR products derived from polyA RNA from any contaminating DNA. cDNA samples from human retina and melanoma cell line ‘1088 mel’ (a generous gift from Paul Robbins, NCI), prepared in our laboratory, were used as positive controls in this study, whereas commercial samples of human kidney and heart RNA (BD Biosciences, Palo Alto, CA, USA) were used as negative controls. Intensity of PCR bands of the thymic samples at 37 cycles for the four retinal antigens, or at 40 cycles for the melanocyte antigens, was normalized to β-actin bands, using NIH Image, followed by compensating the relative intensity with both β-actin and positive control bands.
Table 2.
Primers and probes used in the study
| cDNA | Primers/probes | Product size | Reference |
|---|---|---|---|
| RT—PCR primers for retinal antigens | |||
| S-Ag | 5′-ACACAAACCTTGCCTCCAGCA-3′, 5′-CGACATCTTCACTCATCAGCGT-3′ | 307 bp | (16) |
| IRBP | 5′-CCTCCATTCCCATCTTGTGCTCCTA-3′, 5′-GTGAGGTAGAGGTTGGTGTCATCCA-3′ | 304 bp | (17) |
| RPE65 | 5′-GCAATTCTGTGCAGTGACGAGA-3′, 5′-GTCCATGAAAGGTGACAGGGAT-3′ | 409 bp | (18) |
| Recoverin | 5′-ACGGTAACGGGACCATCAGCAA-3′, 5′-TCATGTGAGTGGTAGGTGGAGGGA-3′ | 313 bp | (19) |
| RT—PCR primers for melanocyte antigens | |||
| MART-1 | 5′-TTAAGGAAGGTGTCCTGTGCCCT-3′, 5′-AAGCAGGTGGAGCATTGGGAA-3′ | 344 bp | (20) |
| gp100 | 5′-TGGGCAGGTTATCTGGGTCAA-3′, 5′-GCTGGAATGAGCAAGAGGCACAT-3′ | 316 bp | (21) |
| TRP-1 | 5′-TGTCCTCCTGCACACCTTCACA-3′, 5′-ATCCATACTGCGTCTGGCACGA-3′ | 325 bp | (22) |
| TRP-2 | 5′-GAAACCACCAGTGATTCGGCA-3′, 5′-TGGCAAAGTTCCAGTAGGGCA-3′ | 383 bp | (22) |
| β-actin | 5′-TACCACTGGCATCGTGATGGACTCCGGTGACG-3′, 5′-CGTCATACTCCTGCTTGCTGATCCACATCTGC-3′ | 653 bp | |
| Real-time PCR primer/probes | |||
| S-Ag | 5′-CAGTGAAGTCGCCACTGAGGT-3′, 5′-CCTTAGCTGGGTCCTCAGGC-3′, FAM-5′-CCATTCCGCCTCATGCACCCTC-3′-BHQ-1 | (16) |
Quantitative PCR
Quantitative PCR was performed on cDNA samples derived from human thymus and retina, using iCycler iQ Real-Time PCR Detection System (Bio-Rad, Hercules, CA, USA) with primers and probes specific for S-Ag, shown in Table 2. PCR parameters are as recommended for the TaqMan Universal PCR master mix kit (ABI). Triplicate samples of 5-fold serial dilutions of cesium chloride-banded plasmid cDNA were assayed and used to construct the standard curves.
Sequencing
Nested RT–PCR was performed on thymic samples using two pairs of primers that amplify full lengths of S-Ag, RPE65 and the fourth repeat of IRBP (24). PCR products were fractionated on a 1.5% low-melting agarose gel and the DNA fragments were eluted from the gel on PCR Wizard mini-columns (Promega, Madison, WI, USA). Purified fragments were sequenced on both strands by the dideoxy chain termination method on an ABI 310 DNA Sequencer as recommended by the manufacturer (ABI).
Immunostaining
Frozen sections of human thymi were prepared and used for immunohistochemical and double immunofluorescence staining as previously reported (25). Mouse eye sections were used as positive controls. In brief, frozen sections (5 lm) were thawed and fixed in 10% buffered formalin. For immunohistochemistry, sections were stained using the streptavidin–biotin–peroxidase method and aminoethyl carbazole (red) as substrate for the HRP enzyme (Zymed, South San Francisco, CA, USA). Primary antibodies included rabbit polyclonals against bovine S-Ag, RPE65 [a gift from T. Michael Redmond, National Eye Institute (NEI), NIH] and IRBP (a gift from Barbara Wiggert, NEI, NIH). We also used an mAb against residues 300−320 of human S-Ag (‘SCT-128’, a generous gift from Clay Smith, University of Florida). All antibodies were diluted in 10% non-immune goat serum to minimize background staining. Sections were counterstained with hematoxylin. Negative control sections were stained with secondary antibody only or with rabbit or mouse normal control sera as primary antibody.
To block immunostaining of cells expressing S-Ag, the mAb against this antigen was incubated with bovine S-Ag (a gift from Hugh McDowell, University of Florida) at 0.8 mg ml−1, for 60 min, at 4°C before being applied to the tissue for staining as described above. Serial, consecutive thymic sections were then stained with the primary antibody or the antibody–antigen mixture, respectively. Two subsequent sections were used as negative controls (omission of primary antibody and isotype control).
Double Immunofluorescence
For double immunofluorescence, incubation with the primary antibody was followed by incubation with a secondary antibody appropriate for the species and immunoglobulin class of the primary antibody, conjugated with Alexa-568 (Molecular Probes). We used a mAb to cytokeratin AE3 (Zymed) to stain for thymic epithelial cells, followed by an anti-FITC Alexa-488 conjugate, to better preserve the FITC signal. Negative controls included slides stained with secondary antibody only or rabbit and mouse isotype control sera. Slides were then treated with anti-fade reagents (Molecular Probes), mounted with a cover slip and examined with an inverted fluorescence microscope (Leica DMIRB). The microscope was equipped with two highly selective band-pass filters specific for tetramethylrhodamine isothiocyanate (TRITC) and Alexa-568 (N3, excitation 546 ± 12 nm, emission 600 ± 40 nm) or FITC and Alexa-488 (L5, excitation 480 ± 40 nm, emission 527 ± 30 nm), plus a triple band-pass filter that allows both TRITC/Alexa-568 and FITC/Alexa-488 fluorescence to become visible (61000V2, Chroma Technologies, Brattleboro, VT, USA; FITC excitation 484.5 ± 1.5 nm, FITC emission 518.5 ± 1.5 nm, TRITC excitation 555.1 ± 1.5 nm, TRITC emission 602 ± 1.5 nm). Double-stained cells show both orange and green fluorescence and variable gradations of yellow fluorescence resulting from the combination of the orange and green fluorescence when using the triple band-pass filter.
Results
RT–PCR analysis of thymic samples
To determine the relative levels of mRNA transcripts of the four retinal-specific proteins, S-Ag, IRBP, RPE65 and recoverin, and four melanocyte antigens, MART-1, gp100, TRP-1 and TRP-2, cDNA samples of the tested human thymi were subjected to 30, 33, 37 or 40 amplification cycles for the retinal antigens, or 35 and 40 cycles for the melanocyte antigens. The data are shown in Figs 1 and 2. Human retinal RNA served as a positive control for the thymic samples in Fig. 1, whereas RNA from the melanoma cell line was used as the control for the samples in Fig. 2. The data showing the calculated intensity of the PCR bands of individual thymic samples are summarized diagrammatically in Figs 1(B) and 2(B) (see Methods for details). The RT–PCR responses used for the calculated values shown in Fig. 1(B) were those obtained after 37 PCR cycles, while the ones shown in Fig. 2(B) were obtained after 40 cycles.
Fig. 1.
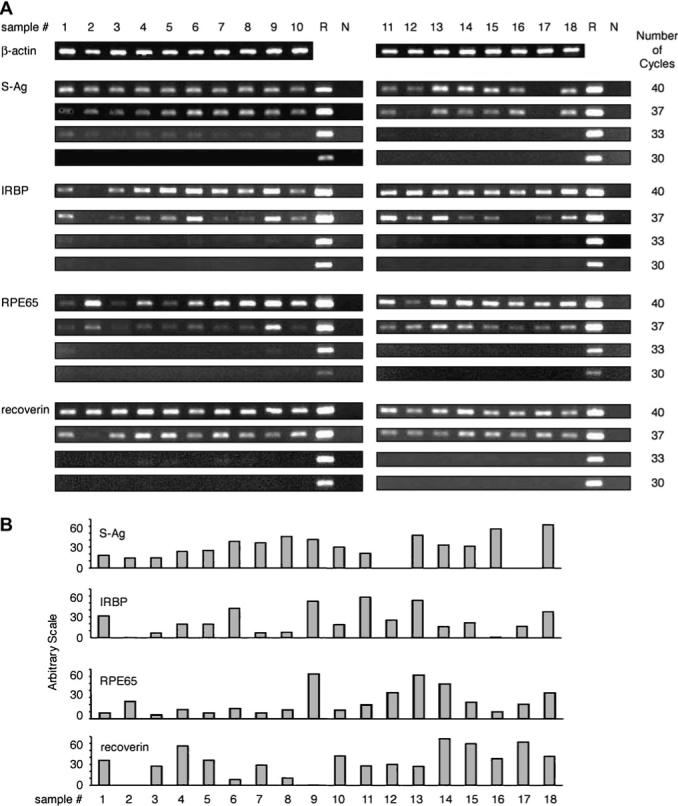
Detection of mRNA transcripts of the four retinal antigens in human thymi. (A) RT–PCR reactions were performed as detailed in Methods, using total RNA from the 18 human thymus samples. The thymic samples were tested for the β-actin transcript by 30 cycles of PCR or by 30, 33, 37 and 40 cycles for the four retinal antigens and the controls. The controls included ‘R’, an RNA preparation of normal human retina, and ‘N’, negative control with no cDNA. (B) The calculated intensity levels of the RT–PCR bands of individual thymic samples when tested for transcripts of the four retinal antigens by 37 cycles of PCR. The intensity levels were measured using NIH Image, followed by compensating the relative intensity with both β-actin and positive control (‘R’) bands.
Fig. 2.
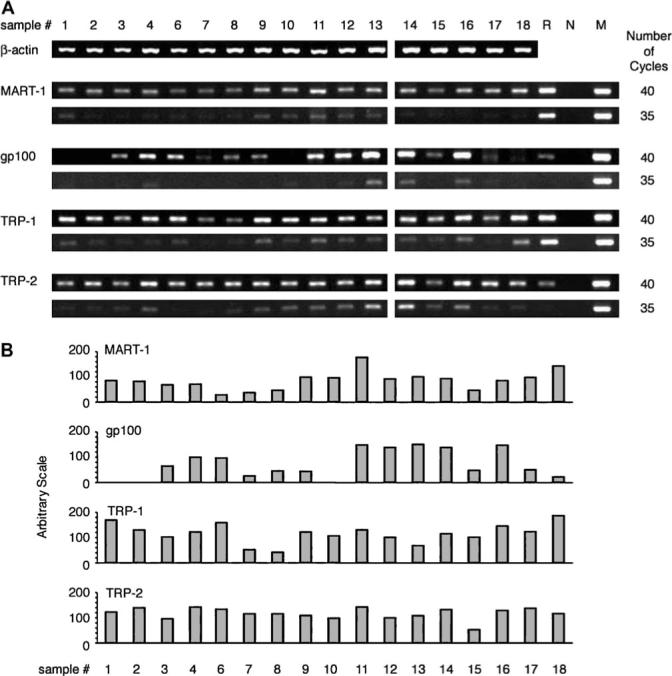
Detection of mRNA transcripts of the four melanocyte antigens in human thymi. (A) RT–PCR reactions were performed as detailed in Methods, using total RNA from 17 human thymus samples (thymic sample no. 5 was not tested for these transcripts). The samples were tested for the β-actin transcript by 30 cycles and for the melanocyte transcripts and controls by 35 or 40 cycles of PCR. The controls included ‘R’, an RNA preparation of normal human retina, ‘N’, negative control without cDNA, and ‘M’, RNA preparation from the melanoma cell line ‘1088 mel’. Each antigen was tested on a double comb gel. (B) The calculated intensity levels of the RT–PCR bands of the thymic samples when tested by 40 PCR cycles. The intensity levels were measured using NIH Image, followed by compensating the relative intensity with both β-actin and the positive melanocyte line control.
Notably, transcripts for all four retinal antigens and four melanocyte antigens were found in most or all the tested thymic samples after 40 PCR cycles. Substantial variations were observed, however, among both the thymic samples and the eight tested molecules. The great majority of thymic samples was positive for the four retinal transcripts after 37 cycles of amplification, whereas we could detect these transcripts in only a few samples following 33 PCR cycles (Fig. 1). Likewise, only a portion of the thymic samples responded to the melanocyte mRNAs by 35 PCR cycles (Fig. 2). Of particular interest is the finding that several thymi were negative for certain mRNAs, even at 40 cycles, but were positive for the other transcripts. Thus, no response for IRBP or gp100 was found with thymic sample no. 2, whereas this sample was strongly positive for the other six transcripts. Similarly, sample no. 17 showed no response for S-Ag mRNA, but was positive for the other molecules.
None of the tested transcripts was detected in pooled human kidney or heart RNA preparations, even after 40 cycles of amplification (data not shown).
Reproducibility of the RT–PCR data
To verify the reproducibility of the RT–PCR assays, we re-tested selected thymic samples, in particular those that were negative or low for certain transcripts. These repeated assays proved the high reproducibility of our data. The results of one such experiment are shown in Fig. 3. The thymic samples re-tested here included nos 1, 2 and 3, in which the expression of IRBP and RPE65 transcripts was remarkably different. As seen in Fig 1(A), the PCR products in sample nos 1 and 3 are high for IRBP, but low for RPE65, whereas sample no. 2 is negative for IRBP but strongly positive for RPE65. The results of this experiment demonstrate a remarkable level of reproducibility in showing the same pattern of differences in expression of the two transcripts among the three thymic samples in Figs 1(A) and 3. Moreover, in order to also test the distribution homogeneity of the gene transcripts in the thymus, we isolated RNA in this experiment from three separate tissue pieces of the three thymic samples. As shown in Fig. 3, RNA extracts collected from different locations of each of the three tested thymic samples yielded essentially identical PCR reactions for IRBP or RPE65. This observation thus indicates that transcripts of these genes are distributed homogeneously among different parts of the thymus.
Fig. 3.
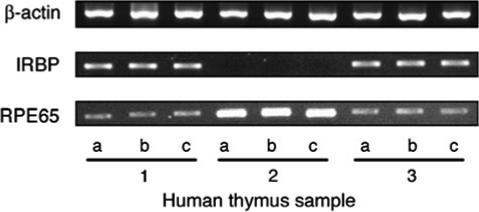
Reproducibility of the RT–PCR assay is confirmed. Three tissue pieces (‘a’, ‘b’ and ‘c’) were collected from different areas of each of thymic samples ’1’, ‘2’ and ‘3’ and total RNA extracted from each of these pieces was tested by RT–PCR for transcripts of β-actin, IRBP and RPE65, using 30 PCR cycles for the β-actin and 40 PCR cycles for the antigens, as detailed in Methods. Please note the close similarity between the pattern of response among the tissue pieces of the three thymic samples, as well as between these responses and the corresponding responses shown in Fig. 1(A).
Quantitative PCR analysis of thymic expression of retinal antigens
In order to compare the expression levels of the tested transcripts in the retina and thymus, we employed the quantitative real-time PCR technique. The data of a representative experiment, with thymic sample no. 18, are shown in Fig. 4. This thymic sample had the highest level of S-Ag transcript among the tested samples; yet, its relative gene expression level was calculated to be ∼1.4 × 10⁵-fold lower than that of the human retina.
Fig. 4.
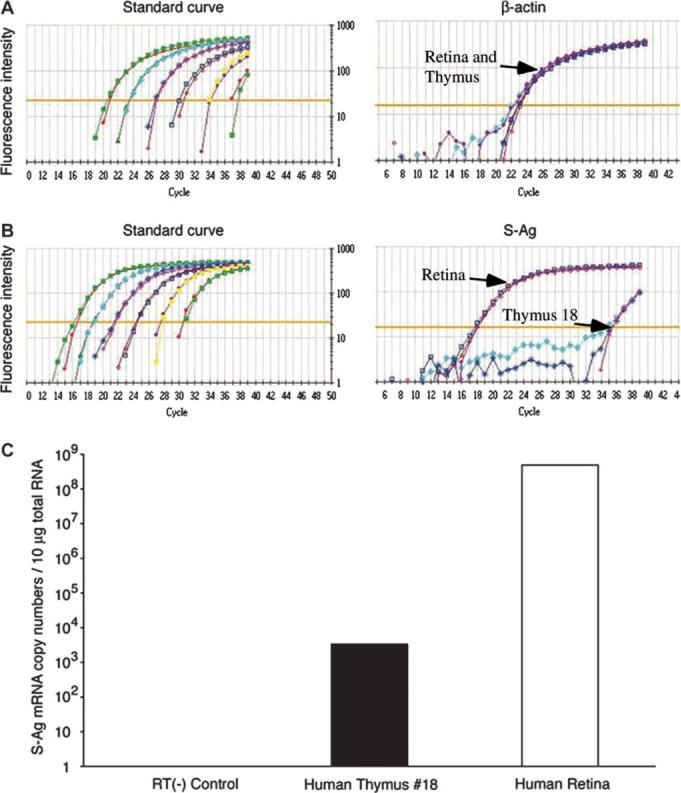
A comparison by quantitative PCR between the levels of S-Ag transcript in human retina and thymus. RNA preparations of human thymus sample no. 18 and a normal human retina were tested by real-time PCR assay, as described in Methods. Relative gene expression levels of S-Ag in the thymus was calculated to be 1.4 × 10⁵-fold lower than that of the human retina.
Sequence of thymically expressed retinal molecules
In order to confirm that the sequences detected by the RT–PCR in thymic preparations are authentic, we sequenced the PCR fragments corresponding to the full-length S-Ag, RPE65 or the fourth repeat of IRBP. A complete identity was found between the thymic sequence and the published sequence of IRBP (17, 24) and RPE65 molecules (18), while the sequence of S-Ag from four different samples of thymi differed from the published sequence (16) by two nucleotides, at location 1410 (G for A) and 1411 (C for T). The thymic sequence of S-Ag was identical, however, to that of human retina sample prepared in our laboratory.
Detection by immunostaining of retinal proteins expressed in human thymi
In order to verify that mRNAs of the peripheral tissue proteins are actually translated in the human thymus, we analyzed thymic sections for the presence of cells expressing these antigens. Representative sections, stained with antibodies against S-Ag, IRBP or RPE65 by immunohistochemistry, are shown in Fig. 5(A). Sparse cells, localized exclusively within the thymic medulla or the corticomedullary junction, were stained with these three antibodies. Staining was not observed, however, on negative control slides, stained with secondary antibody only or with rabbit or mouse isotype control sera as primary antibody (Fig. 5A).
Fig. 5.
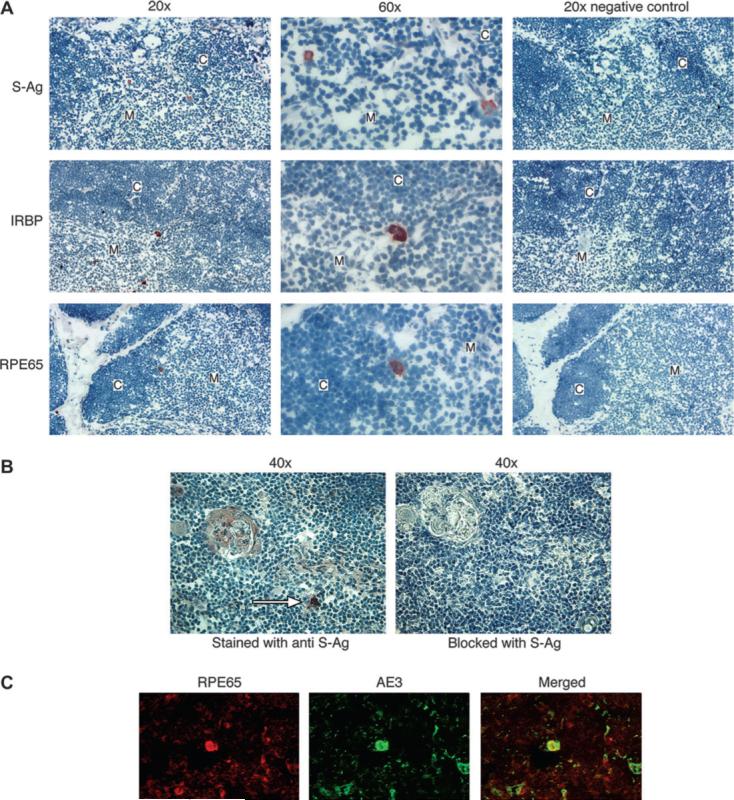
Thymic expression of retinal antigens shown by immunostaining. (A) Frozen thymus sections were stained with rabbit antibodies against S-Ag, IRBP or RPE65, as described in the Methods. The original magnification values, ×20 or ×60, are indicated. The predominant location of stained cells is in the medulla (‘M’) or corticomedullary junction, but not in the cortex (‘C’). No staining was detected in the negative controls, sections stained with no primary antibody. (B) Immunostaining of positive cells is blocked by the specific antigen. Serial sections of thymic tissue were stained with mAb against S-Ag (left panel) or with the antibody following its incubation for 1 h with S-Ag (right panel). A positive staining of a cell in the medulla (white arrow) is eliminated by blocking with the antigen. (C) Identification of positively stained cells to be thymic epithelial cells. A thymic section was double stained with antibodies against RPE65 and against cytokeratin (‘AE3’), as detailed in the Methods. A cell positive for RPE65 (orange) also stained for cytokeratin (green) and produced the yellow color when the two colors were merged.
To further verify the staining specificity, we blocked the staining of thymic cells with the antibody against S-Ag by mixing the antibody with the specific antigen prior to their being applied to the tissue section. Figure 5(B) shows an example of these experiments, which resulted in prevention of staining in the sections incubated with the S-Ag and antibody mixture. Similar results were obtained in mouse eye sections (data not shown).
In addition, we identified the thymic cells positive for retinal antigens to be epithelial cells by their being double stained, for both cytokeratin and the retinal antigen RPE65 (Fig. 5C).
Discussion
Data collected in this study show that transcripts of all the eight tested tissue antigens are expressed in detectable levels in the thymus of most individuals. This observation is in line, therefore, with the notion that essentially all peripheral tissue-specific antigens of the mammalian body are normally expressed in the thymus, thus initiating the mechanism of central tolerance whereby T lymphocytes with high affinity toward these self-antigens are eliminated (2, 26, 27). Our data are also in accord with the recent finding by Gotter et al. (28), that human medullary thymic cells over-express >400 genes, including many genes of tissue-specific antigens.
Remarkable variations were noted, however, in the present study among the tested thymic samples in their level of expression of the different transcripts (Figs 1 and 2). This variability resembles the one observed among different inbred strains of mice and rats, when tested for thymic expression of immunopathogenic antigens of the retina (4). As reported in these animal studies, an inverse correlation was found between thymic expression of immunopathogenic antigens and the susceptibility of the rodent strain to experimental autoimmune diseases induced by the tested antigen (4). It is conceivable, therefore, that similar to the rodent system, the level of thymic expression of potentially immunopathogenic antigens plays a role in determining the susceptibility of humans to the development of autoimmunity against the antigens.
The variability in thymic expression of the retinal genes among different donors, as detected by the RT–PCR method, was confirmed by repeated experiments, as depicted in Fig. 3. It is noteworthy that the gene expression profile of individual donors was homogeneously distributed throughout the different areas of the thymus, as shown in Fig. 3.
Our results with the quantitative real-time PCR analysis underscored how minuscule is the amount of S-Ag in the human thymus, as compared with the level of this molecule in the retina (Fig. 4). This observation with human tissues is in line with data collected with experimental animals, with both native and neo-self ocular antigens (29, 30). It is notable, therefore, that trace amounts of ocular-specific antigens expressed in the animal thymi were found to efficiently eliminate large populations of thymocytes with high avidity to these ocular antigens (1, 3, 26, 27, 29, 30). It is assumed that similar processes of specific lymphocyte elimination take place in the human thymus.
The expression of a wide range of tissue-specific antigens in human thymi was investigated by Sospedra et al. (31). One of the molecules included in that study was retinal S-Ag. Strong RT–PCR responses for the S-Ag transcript were found in only three of the 12 tested thymic samples, from donors of 2, 5 or 13 months of age, but no activity was detected in thymi from nine other donors, aged from 8 days to 13 years. This ‘clustering’ of responders at a specific age range is contradicted by our data, showing that transcripts of S-Ag and other retinal antigens were found in thymi collected at all tested ages. It is possible that factors related to the RT–PCR technique are responsible, at least in part, for this observation by Sospedra et al. (31). In a more recent paper, Gotter et al. (28) detected transcripts of S-Ag and IRBP in thymic medullary cells of all five tested donors. In addition, these authors detected in the medullary cells transcripts of several tumor-associated antigens (28). It is of note that our observation with melanocyte transcripts (Fig. 2) supports the conclusion of Gotter et al. (28) concerning the controversial issue of thymic expression of tumor antigens.
The thymic selection process is incomplete and T cells with low avidity toward the self-antigen do escape elimination (26, 27). Consequently, lymphocytes that recognize various tissue antigens, including retinal proteins, are found in healthy individuals (32, 33). It is conceivable that the avidity of these T-cell escapees is determined by the level of the corresponding tissue antigen in the thymus. This issue is of particular interest in view of the finding that the avidity toward myelin antigens of T cells from patients with multiple sclerosis is significantly higher than that of cells from healthy controls (34). Likewise, the avidity toward the target melanocyte antigens determines the therapeutic capacity of T cells used in immunotherapy of melanoma activity and, therefore, the level of thymic expression of these antigens is likely to have a pivotal effect on the success of cell-mediated immunotherapy of melanoma (11, 12, 15).
The RT–PCR data collected in this study are also of interest with regard to cellular immune responses of humans toward retinal antigens. Lymphocyte responses have been tested against three of the four retinal antigens used here, i.e. S-Ag, recoverin and IRBP. A majority of the tested human subjects was found to respond to S-Ag (32, 33, 35), whereas most subjects were found to show no response to recoverin (35) and very low or no response to IRBP (33, 35, 36). The prevalence of the response to S-Ag in healthy donors resembles that to MBP (34, 37) or PLP (38) and it is assumed that cells that respond to these tissue-specific antigens are T lymphocytes that escaped negative selection. In view of the general similarity between thymic expression of S-Ag transcript and of IRBP or recoverin transcripts (Fig. 1), the difference between the responses to these antigens suggests that factors other than thymic expression of the retinal antigen are also involved in determining the responsiveness of human lymphocytes to tissue-specific antigens.
All three tested retinal antigens, S-Ag, IRBP and RPE65, were detected in human thymic sections by immunostaining, using specific antibodies against these proteins. The antigens were detected in rare cells located mostly in the thymic medulla, thought to be the site where self-antigens are expressed and the negative selection occurs (26, 29). These observations resemble closely those made with other tissue antigens, such as those of the pancreatic islets (25).
In summary, our data show that thymic expression is a common feature of uveitogenic retinal and melanocyte antigens in humans and further suggest that thymic expression is common to all human tissue-specific antigens. Remarkable variations were noted, however, among individual thymi, suggesting that the level of thymic expression of any tissue antigen could affect the presence and avidity of T lymphocytes specific to these antigens. Consequently, the thymic expression of uveitogenic antigens could affect the susceptibility of the individual to pathogenic autoimmunity against the tissue molecule.
Acknowledgements
We thank Nicholas Restifo and Paul Robbins for very useful advice, Yukari Okamoto for assistance with handling the thymic samples and the Analytical Imaging Core at the University of Miami for providing access to microscopy services. This study was supported in part by the Diabetes Research Institute Foundation.
Glossary
Abbreviations
- IRBP
inter-photoreceptor retinoid-binding protein
- MART
melanoma antigen recognized by T cells
- NEI
National Eye Institute
- NIH
National Institutes of Health
- PLP
proteolipid protein
- RT
reverse transcription
- S-Ag
retinal S-antigen
- TRITC
tetramethylrhodamine isothiocyanate
- TRP
tyrosinase-related protein
References
- 1.Anderson AC, Kuchroo VK. Expression of self-antigen in the thymus: a little goes a long way. J. Exp. Med. 2003;198:1627. doi: 10.1084/jem.20031803. [DOI] [PMC free article] [PubMed] [Google Scholar]
- 2.Kyewski B, Derbinski J. Self-representation in the thymus: an extended view. Nat. Rev. Immunol. 2004;4:688. doi: 10.1038/nri1436. [DOI] [PubMed] [Google Scholar]
- 3.Avichezer D, Grajewski RS, Chan CC, et al. An immunologically privileged retinal antigen elicits tolerance: major role for central selection mechanisms. J. Exp. Med. 2003;198:1665. doi: 10.1084/jem.20030413. [DOI] [PMC free article] [PubMed] [Google Scholar]
- 4.Egwuagu CE, Charukamnoetkanok P, Gery I. Thymic expression of autoantigens correlates with resistance to autoimmune disease. J. Immunol. 1997;159:3109. [PubMed] [Google Scholar]
- 5.Klein L, Klugmann M, Nave KA, Tuohy VK, Kyewski B. Shaping of the autoreactive T-cell repertoire by a splice variant of self protein expressed in thymic epithelial cells. Nat. Med. 2000;6:56. doi: 10.1038/71540. [DOI] [PubMed] [Google Scholar]
- 6.Anderson AC, Nicholson LB, Legge KL, Turchin V, Zaghouani H, Kuchroo VK. High frequency of autoreactive myelin proteolipid protein-specific T cells in the periphery of naive mice: mechanisms of selection of the self-reactive repertoire. J. Exp. Med. 2000;191:761. doi: 10.1084/jem.191.5.761. [DOI] [PMC free article] [PubMed] [Google Scholar]
- 7.Pugliese A, Zeller M, Fernandez A, Jr, et al. The insulin gene is transcribed in the human thymus and transcription levels correlated with allelic variation at the INS VNTR-IDDM2 susceptibility locus for type 1 diabetes. Nat. Genet. 1997;15:293. doi: 10.1038/ng0397-293. [DOI] [PubMed] [Google Scholar]
- 8.Vafiadis P, Bennett ST, Todd JA, et al. Insulin expression in human thymus is modulated by INS VNTR alleles at the IDDM2 locus. Nat. Genet. 1997;15:289. doi: 10.1038/ng0397-289. [DOI] [PubMed] [Google Scholar]
- 9.Chentoufi AA, Polychronakos C. Insulin expression levels in the thymus modulate insulin-specific autoreactive T-cell tolerance: the mechanism by which the IDDM2 locus may predispose to diabetes. Diabetes. 2002;51:1383. doi: 10.2337/diabetes.51.5.1383. [DOI] [PubMed] [Google Scholar]
- 10.Thebault-Baumont K, Dubois-Laforgue D, Krief P, et al. Acceleration of type 1 diabetes mellitus in proinsulin 2-deficient NOD mice. J. Clin. Invest. 2003;111:851. doi: 10.1172/JCI16584. [DOI] [PMC free article] [PubMed] [Google Scholar]
- 11.Engelhard VH, Bullock TN, Colella TA, Sheasley SL, Mullins DW. Antigens derived from melanocyte differentiation proteins: self-tolerance, autoimmunity, and use for cancer immunotherapy. Immunol. Rev. 2002;188:136. doi: 10.1034/j.1600-065x.2002.18812.x. [DOI] [PubMed] [Google Scholar]
- 12.Dudley ME, Rosenberg SA. Adoptive-cell-transfer therapy for the treatment of patients with cancer. Nat. Rev. Cancer. 2003;3:666. doi: 10.1038/nrc1167. [DOI] [PMC free article] [PubMed] [Google Scholar]
- 13.Gery I, Nussenblatt RB, Chan CC, Caspi RR. Autoimmune diseases of the eye. In: Theofilopoulos AN, Bona CA, editors. The Molecular Pathology of Autoimmune Diseases, 2nd edn Taylor & Francis; New York: 2002. p. 978. [Google Scholar]
- 14.Ham DI, Gentleman S, Chan CC, McDowell JH, Redmond TM, Gery I. RPE65 is highly uveitogenic in rats. Invest. Ophthalmol. Vis. Sci. 2002;43:2258. [PubMed] [Google Scholar]
- 15.Parkhurst MR, DePan C, Riley JP, Rosenberg SA, Shu S. Hybrids of dendritic cells and tumor cells generated by electrofusion simultaneously present immunodominant epitopes from multiple human tumor-associated antigens in the context of MHC class I and class II molecules. J. Immunol. 2003;170:5317. doi: 10.4049/jimmunol.170.10.5317. [DOI] [PMC free article] [PubMed] [Google Scholar]
- 16.Yamamoto S, Sippel KC, Berson EL, Dryja TP. Defects in the rhodopsin kinase gene in the Oguchi form of stationary night blindness. Nat. Genet. 1997;15:175. doi: 10.1038/ng0297-175. [DOI] [PubMed] [Google Scholar]
- 17.Fong SL, Fong WB, Morris TA, Kedzie KM, Bridges CD. Characterization and comparative structural features of the gene for human interstitial retinol-binding protein. J. Biol. Chem. 1990;265:3648. [PubMed] [Google Scholar]
- 18.Nicoletti A, Wong DJ, Kawase K, Gibson LH, Yang-Feng TL, Richards JE, Thompson DA. Molecular characterization of the human gene encoding an abundant 61 kDa protein specific to the retinal pigment epithelium. Hum. Mol. Genet. 1995;4:641. doi: 10.1093/hmg/4.4.641. [DOI] [PubMed] [Google Scholar]
- 19.Murakami A, Yajima T, Inana G. Isolation of human retinal genes: recoverin cDNA and gene. Biochem. Biophys. Res. Commun. 1992;187:234. doi: 10.1016/s0006-291x(05)81483-4. [DOI] [PubMed] [Google Scholar]
- 20.Kawakami Y, Eliyahu S, Delgado CH, et al. Cloning of the gene coding for a shared human melanoma antigen recognized by autologous T cells infiltrating into tumor. Proc. Natl Acad. Sci. USA. 1994;91:3515. doi: 10.1073/pnas.91.9.3515. [DOI] [PMC free article] [PubMed] [Google Scholar]
- 21.Adema GJ, de Boer AJ, Vogel AM, Loenen WA, Figdor CG. Molecular characterization of the melanocyte lineage-specific antigen gp100. J. Biol. Chem. 1994;269:20126. [PubMed] [Google Scholar]
- 22.Box NF, Wyeth JR, Mayne CJ, O`Gorman LE, Martin NG, Sturm RA. Complete sequence and polymorphism study of the human TYRP1 gene encoding tyrosinase-related protein 1. Mamm. Genome. 1998;9:50. doi: 10.1007/s003359900678. [DOI] [PubMed] [Google Scholar]
- 23.Yokoyama K, Suzuki H, Yasumoto K, Tomita Y, Shibahara S. Molecular cloning and functional analysis of a cDNA coding for human DOPAchrome tautomerase/tyrosinase-related protein-2. Biochim. Biophys. Acta. 1994;1217:317. doi: 10.1016/0167-4781(94)90292-5. [DOI] [PubMed] [Google Scholar]
- 24.Si JS, Borst DE, Redmond TM, Nickerson JM. Cloning of cDNAs encoding human interphotoreceptor retinoid-binding protein (IRBP) and comparison with bovine IRBP sequences. Gene. 1989;80:99. doi: 10.1016/0378-1119(89)90254-0. [DOI] [PubMed] [Google Scholar]
- 25.Pugliese A, Brown D, Garza D, et al. Self-antigen-presenting cells expressing diabetes-associated autoantigens exist in both thymus and peripheral lymphoid organs. J. Clin. Invest. 2001;107:555. doi: 10.1172/JCI10860. [DOI] [PMC free article] [PubMed] [Google Scholar]
- 26.Kisielow P, von Boehmer H. Development and selection of T cells: facts and puzzles. Adv. Immunol. 1995;58:87. doi: 10.1016/s0065-2776(08)60620-3. [DOI] [PubMed] [Google Scholar]
- 27.Stockinger B. T lymphocyte tolerance: from thymic deletion to peripheral control mechanisms. Adv. Immunol. 1999;71:229. doi: 10.1016/s0065-2776(08)60404-6. [DOI] [PubMed] [Google Scholar]
- 28.Gotter J, Brors B, Hergenhahn M, Kyewski B. Medullary epithelial cells of the human thymus express a highly diverse selection of tissue-specific genes colocalized in chromosomal clusters. J. Exp. Med. 2004;199:155. doi: 10.1084/jem.20031677. [DOI] [PMC free article] [PubMed] [Google Scholar]
- 29.Zhang M, Vacchio MS, Vistica BP, et al. T cell tolerance to a neo-self antigen expressed by thymic epithelial cells: the soluble form is more effective than the membrane-bound form. J. Immunol. 2003;170:3954. doi: 10.4049/jimmunol.170.8.3954. [DOI] [PubMed] [Google Scholar]
- 30.Ham DI, Kim SJ, Chen J, et al. Central immunotolerance in transgenic mice expressing a foreign antigen under control of the rhodopsin promoter. Invest. Ophthalmol. Vis. Sci. 2004;45:857. doi: 10.1167/iovs.03-1028. [DOI] [PubMed] [Google Scholar]
- 31.Sospedra M, Ferrer-Francesch X, Dominguez O, Juan M, Foz-Sala M, Pujol-Borrell R. Transcription of a broad range of self-antigens in human thymus suggests a role for central mechanisms in tolerance toward peripheral antigens. J. Immunol. 1998;161:5918. [PubMed] [Google Scholar]
- 32.Hirose S, Tanaka T, Nussenblatt RB, et al. Lymphocyte responses to retinal-specific antigens in uveitis patients and healthy subjects. Curr. Eye Res. 1988;7:393. doi: 10.3109/02713688809031789. [DOI] [PubMed] [Google Scholar]
- 33.Yamamoto JH, Okajima O, Mochizuki M, et al. Cellular immune responses to retinal antigens in retinitis pigmentosa. Graefes Arch. Clin. Exp. Ophthalmol. 1992;230:119. doi: 10.1007/BF00164648. [DOI] [PubMed] [Google Scholar]
- 34.Bielekova B, Sung MH, Kadom N, Simon R, McFarland H, Martin R. Expansion and functional relevance of high-avidity myelin-specific CD4+ T cells in multiple sclerosis. J. Immunol. 2004;172:3893. doi: 10.4049/jimmunol.172.6.3893. [DOI] [PubMed] [Google Scholar]
- 35.Whitcup SM, Vistica BP, Milam AH, Nussenblatt RB, Gery I. Recoverin-associated retinopathy: a clinically and immunologically distinctive disease. Am. J. Ophthalmol. 1998;126:230. doi: 10.1016/s0002-9394(98)00149-4. [DOI] [PubMed] [Google Scholar]
- 36.Tamm SA, Whitcup SM, Gery I, Wiggert B, Nussenblatt RB, Kaiser-Kupfer MI. Immune response to retinal antigens in patients with gyrate atrophy and other hereditary retinal dystrophies. Ocul. Immunol. Inflamm. 2001;9:75. doi: 10.1076/ocii.9.2.75.3972. [DOI] [PubMed] [Google Scholar]
- 37.Martin R, Jaraquemada D, Flerlage M, et al. Fine specificity and HLA restriction of myelin basic protein-specific cytotoxic T cell lines from multiple sclerosis patients and healthy individuals. J. Immunol. 1990;145:540. [PubMed] [Google Scholar]
- 38.Markovic-Plese S, Fukaura H, Zhang J, et al. T cell recognition of immunodominant and cryptic proteolipid protein epitopes in humans. J. Immunol. 1995;155:982. [PubMed] [Google Scholar]