

Article-at-a-Glance
Background
Despite significant interest in the business case for quality improvement (QI), there are few evaluations of the impact of QI programs on outpatient organizations. The financial impact of the Health Disparities Collaboratives (HDC), a national QI program conducted in community health centers (HCs), was examined.
Methods
Chief executive officers (CEOs) from health centers in two U.S. regions that participated in the Diabetes HDC (N = 74) were surveyed. In case studies of five selected centers, program costs/revenues, clinical costs/revenues, overall center financial health, and indirect costs/benefits were assessed.
Results
CEOs were divided on the HDC’s overall effect on finances (38%, worsened; 48%, no change; 14%, improved). Case studies showed that the HDC represented a new administrative cost ($6-$22/patient, year 1) without a regular revenue source. In centers with billing data, the balance of diabetes-related clinical costs/revenues and payor mix did not clearly worsen or improve with the program’s start. The most commonly mentioned indirect benefits were improved chronic illness care and enhanced staff morale.
Discussion
CEO perceptions of the overall financial impact of the HDC vary widely; the case studies illustrate the numerous factors that may influence these perceptions. Whether the identified balance of costs and benefits is generalizable or sustainable will have to be addressed to optimally design financial reimbursement and incentives.
Many leaders of health care organizations are concerned that participation in quality improvement (QI) efforts might negatively affect their organizations’ short-term financial status.1 In particular, outpatient medical organizations may expend significant financial resources to implement QI efforts but never experience the long-term financial benefits of reduced complication rates and inpatient utilization that accrue to health plans, employers, or government agencies that pay for care.2 Recognition of these barriers has led to an ongoing discussion regarding the “business case” for QI3 as well as the introduction of incentives such as pay-for-performance.4 Despite the policy relevance of the business case, the majority of economic evaluations of health care programs are conducted from the societal,5 payor,6 or managed care system perspectives.1 To date, there have been few attempts to assess the short-term financial impact of QI programs7,8 and even fewer attempts to assess this impact from the perspective of outpatient organizations.
One important example of an ongoing, national QI program in the United States that is specifically intended for outpatient organizations is the Health Disparities Collaboratives (HDC), which is being conducted in federally qualified community health centers. Health centers are distinct from other outpatient organizations in that they are specifically charged with caring for underinsured and uninsured patients, who bring many social and health challenges to the clinical encounter.9 In recognition of the need to improve chronic care for such vulnerable patients, the HDC was initiated by the Health Resources and Services Administration’s Bureau of Primary Health Care (HRSA’s BPHC) in 1998. The program combines the tools of rapid QI10 and the latest approaches to chronic disease management.11-13 All centers use software for patient population management and report outcomes to regional cluster coordinators. QI team members acquire skills and share best practices at learning sessions and develop QI programs tailored to their centers. Since its initial program in diabetes,14 the HDC has developed programs to improve the care of other conditions. For the Midwest region, the HDC program has been found to improve processes of diabetes care after one year of operation.14 More recently, improvements in diabetes care have been sustained after four years of operation (1998-2002) for multiple processes of care (for example, glycosylated hemoglobin testing [A1C; 71% to 92%] and angiotensinconverting enzyme [ACE] inhibitor prescribing [33% to 5%]) and risk factor levels (for example, mean A1C 8.53%; mean difference, 0.45% [95% confidence intervals, 0.72-0.17]).15
In this article, we present a conceptual model for considering the short-term financial impact of QI programs on outpatient organizations, building on previous conceptual work,8,16 and use this model to frame our analysis of data obtained from multiple HC sources. To gain insight into HCs’ experiences, we conducted a regional survey of chief executive officers (CEOs) to explore their perceptions of the cost consequences of the HDC QI program. We separately conducted case studies of five selected centers using surveys and billing records to determine the feasibility of measuring and estimating the various categories of costs and revenues necessary to determine cost consequences of the HDC QI program. This work provides an initial description of the financial experiences of health centers as well as an approach to examining the financial impact of QI programs that may be applied to other outpatient settings.
Methods
Conceptual Model of the Financial Impact of QI for Outpatient Facilities
There are a few proposed mechanisms by which efforts to improve chronic disease management may generate financial benefits that meet or exceed the costs of the efforts. First, organizations may apply for grants based on their QI efforts. Second, QI efforts may enhance clinical revenues by generating visits and or services that are reimbursed at a higher rate than their cost to the organization. For example, QI efforts may attract new patients with better-paying insurance. Third, if the health care organization is capitated for some of the costs of caring for patients, the balance of costs and revenues may improve if costs are lowered by QI efforts. Fourth, an organization may increase clinical revenues if payment is under a pay-for-performance incentive and the QI efforts enhance quality of care.
These underlying mechanisms serve as the basis of our conceptual model of the impact of a diabetes QI program on the financial health of an outpatient organization (Figure 1, page 140). The model first describes the factors in the external environment of a health care organization that shape the financial impact of QI, including the local economy, accreditation bodies, and financial incentives. Within the internal environment of an organization, there are specific cost and benefit categories, which, in aggregate, make up the overall costs and revenues of a center. The financial impact of a QI program is most closely linked to its administrative costs and revenues. These administrative costs include the start-up costs of organizing the QI team and initiating interventions, as well as the ongoing costs of data collection and reporting. The relative size of a QI program will partially determine how significant its financial impact is to a health center.
Figure 1.
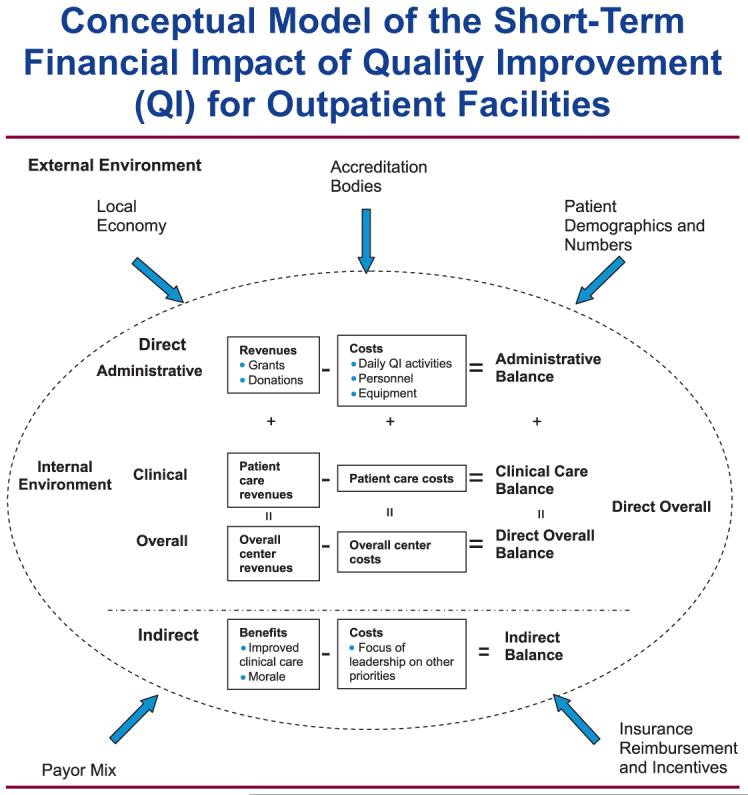
This figure illustrates the conceptual model that guides the determination of the impact of a diabetes QI program on the financial health of an outpatient organization.
The major administrative revenues that support the QI program are likely to come from grants and donations, which correspond to the first mechanism by which centers may enhance financial benefits via QI programs. One step removed from these administrative items are the costs and revenues related to caring for patients with chronic diseases such as diabetes. A QI program may influence the costs and revenues of caring for patients via changes in test ordering, visit frequency, and payor mix. These changes correspond to the second and third mechanisms for enhanced center revenues mentioned earlier.
Pay-for-performance incentive payments would represent a new clinical revenue stream that could be used to support administrative expenses. Further removed from the direct impact of the QI program would be the overall costs and revenues of a health center, which are largely influenced by the number of patients in a region who seek care at the center and the specific insurance payor mix of those patients.
Beyond these inputs, there are indirect costs and benefits of QI that may not be present in financial ledgers, but are important to consider. Some examples of indirect costs would include the focus of center leadership on a new QI program that shifts attention from other priority areas for a center. Examples of indirect benefits would include improvements in staff morale and employee retention.8
CEO Survey
In 2004, we invited all health centers in the Midwest and West Central regions (20 states) that had been in the HDC at least one year to participate in the survey. Of these 173 centers, 165 (94%) health centers agreed to participate. Of these centers, 115 centers had enrolled in the Diabetes HDC by July 2003, and the CEOs from these centers are the denominator for this analysis. The mailed self-administered survey was sent in two waves (April 2004, June/July 2004) to CEOs and other HDC team members. The response rate of Diabetes HDC CEOs was 64% (N = 74). Centers with recent turnover in their HDC leadership or interrupted participation in the HDC did not respond to the survey. CEOs were asked to assess the degree to which the HDC had specifically affected clinical care costs per patient, health center costs, patient care reimbursement, and grant funding during calendar year 2003. In a separate question, CEOs were asked to assess the overall impact of the HDC on center finances.
Case Studies of Community Health Centers
Data Collection
For our case studies,17-19 we selected Midwestern HCs for participation on the basis of the CEO’s interest, the presence of stable electronic financial records, and involvement in the diabetes HDC for at least three years. We approached 12 centers on the basis of recommendations from regional leaders who felt that these centers had successfully participated in the HDC and might be able to meet the technological requirements of participation. Of these centers, 7 were not able to participate because of inconsistent electronic billing records, inability to extract data from billing records, or lack of interest by center leadership, leaving us with 5 participating centers.
We used data from multiple sources, including the following:
-
■
A self-administered HDC history survey to estimate program costs and revenues (separate from CEO survey)
-
■
Billing data associated with patients with diabetes to evaluate trends in clinical costs and revenues
-
■
Uniform Data System (UDS) reports to assess overall financial performance of centers; these are annual reports of center activities that are required by HRSA’s BPHC.
-
■
Qualitative interviews with center leaders (CEO, chief financial officer [CFO], and HDC team leader) regarding the history of the health center, local economic trends, and hidden costs and benefits of the HDC
Case Study Outcomes of Interest
Outcome 1: HDC Administrative Costs and Revenues
We used a self-administered survey to estimate annual HDC administrative costs. Staff assessed the number of hours spent on learning sessions, regular HDC activities (for example, population management, data entry, and team meetings), and dollars spent on HDC-related purchases. All costs are estimates of the opportunity costs of individual items.20 To calculate the costs of nonprovider staff time, we determined an hourly wage on the basis of annual salaries and a 40-hour workweek. To calculate the costs of provider time devoted to administering the HDC, we used a missed-revenue approach. We first estimated the average revenue for a patient visit by year from UDS reports. We then calculated the total potential visits missed by multiplying the yearly hours clinicians spent on HDC administration by an estimated rate of four visits per hour and an eight-hour workday. Annual HDC administrative revenues were made up of grants or donated supplies attributable to HDC participation.
Outcome 2: Diabetes Clinical Costs and Revenues
We used billing data for patients with diabetes to describe trends in average costs of care per patient (on the basis of state-specific Medicare fee schedule rates), average revenue per patient, and payor mix, starting with the year before the HDC program. Health centers first identified all patients with an International Classification of Diseases, Ninth Revision, Clinical Modification (ICD-9-CM) code for diabetes (250.xx) either as a primary or secondary diagnosis from billing data. All financial transactions attributable to these patients were then extracted. Centers 3, 4, and 5 were able to provide these data.
Outcome 3: Overall Costs and Revenues
We also examined the overall financial status of health centers by assessing trends in total costs, total reimbursement, and payor mix. To appreciate the scale of the HDC program, we describe the HDC administrative costs as a percentage of overall center costs. All costs and revenues are adjusted for inflation and expressed in 2004 dollars.
Outcome 4: Indirect Costs and Benefits
In addition to the direct costs described above, we specifically sought out reports of indirect costs and benefits from qualitative interviews with the CEO or CFO in addition to the team leader of HDC efforts at the center. In open-ended questions, we specifically asked center leadership to identify costs and benefits related to the HDC that might not be present in financial ledgers. Other questions focused on trends in the economic environment of the community surrounding the HC and major changes in the organization of the center, such as expansion. Interviews were taped, transcribed, and reviewed for content by three researchers [E.S.H., S.E.S.B., A.C.K].
Results
Ceo Survey Results
The majority of CEOs reported that participation in the HDC increased costs per patient (72%) and overall health center costs (73%). In addition, the majority of CEOs described no change in reimbursement for patient care (75%), funding from government agencies (73%), and funding from private foundations (75%) related to the HDC. CEOs were divided on the effect of the HDC on overall finances, with 38% reporting worsened finances, 48% reporting no change, and 14% reporting improved finances.
Case Studies
The five case study centers represented a significant range of locations and patient populations within the Midwest (Table 1, page 142). Of the two Ohio centers, Center 1 is a rural center, while Center 2 is a center located in the heart of a small former industrial center. Center 3 is an urban HC based in a medium-sized city in Indiana. Of the two centers based in Missouri, Center 4 is a large community health center based in a major city, while Center 5 is another large center based in a more rural region of the state.
Table 1.
Description of the Five Community Health Centers and Patients, 2002
| Center 1 | Center 2 | Center 3 | Center 4 | Center 5 | |
|---|---|---|---|---|---|
| Location | Rural | Urban | Urban | Urban | Rural |
| State | Ohio | Ohio | Indiana | Missouri | Missouri |
| Number of medical care providers | 14.9 | 8.4 | 22.6 | 51.6 | 51.2 |
| Number of patients | 9,167 | 7,261 | 5,669 | 30,867 | 23,041 |
| Number of medical encounters | 28,254 | 18,833 | 21,761 | 60,430 | 79,107 |
| Race/ethnicity of patients, % | |||||
| Black | 4.6 | 48.0 | 23.0 | 84.0 | 1.4 |
| White | 60.0 | 48.0 | 35.0 | 11.0 | 97.0 |
| Latino | 29.0 | <1 | 25.0 | <1 | 1.2 |
| Insurance payor, % | |||||
| No insurance | 42.0 | 35.8 | 59.3 | 43.1 | 14.0 |
| Medicaid | 26.0 | 48.8 | 21.6 | 35.3 | 20.0 |
| Medicare | 9.7 | 4.0 | 1.3 | 5.0 | 17.0 |
| Private | 22.3 | 11.5 | 4.3 | 7.6 | 49.0 |
The centers ranged in size from 8 to 52 medical care providers. With the exception of Center 5, which had the largest representation of private insurance (49%), the majority of patients at the remaining centers had no insurance or had coverage by Medicaid.
Implementing the Diabetes HDC
The Diabetes HDC programs shared some common programmatic features, but many of the sites developed distinct interventions (Table 2, page 142). All five centers used diabetes flow sheets in medical charts to remind physicians of processes of care to be completed, and all used patient management software provided by HRSA’s BPHC to track patients and processes of care over time. Beyond these basic interventions, centers implemented distinct programs, such as the following:
-
■
Cluster group visits (Center 1)
-
■
Population management (Centers 2, 5)
-
■
Outreach programs to community groups (Centers 2, 3, 4)
-
■
Standing laboratory orders (Center 4)
Table 2.
Comparison of Diabetes Health Disparities Collaboratives (HDC) Programs in Year 1
| Center 1 | Center 2 | Center 3 | Center 4 | Center 5 | |
|---|---|---|---|---|---|
| Examples of interventions | Cluster group visits | Quality improvement nurse, close relations with local nursing school | Outreach to civic organizations, physician champion | Standing lab orders, church outreach | Nurse for chronic care management |
| No. of personnel involved in administering HDC program | 8 | 9 | 8 | 6 | 6 |
| No. of care providers involved in administering HDC program | 3 | 3 | 2 | 2 | 2 |
| Learning session workdays missed per year | 14 | 16 | 27 | 9 | 30 |
| Regular HDC activity* hours per week | 20.0 | 58.5 | 53.4 | 20.0 | 38.0 |
Regular HDC activity consisted of data entry, team meetings, and community outreach.
The total number of personnel on the HDC teams ranged from six to nine individuals, and between two and three care providers were directly involved in administering the program. Ancillary clinical staff (that is, dietician, health educator, or staff nurse) led the HDC teams, except for Center 4, whose team was led by a physician assistant. Center 2 made the largest personnel investment in regular HDC activities (58.5 hours/week), in part because it hired a full-time diabetes educator to run the program at its health center.
Case Study Outcomes of Interest
Outcome 1: HDC Administrative Costs and Revenues
In year one, total HDC administration costs varied widely from $6.41 per patient at Center 1 to $21.93 per patient at Center 2 (Figure 2, above). Excluding learning session costs, regular HDC activities cost from $2.75 per patient at Center 1 to $18.06 per patient at Center 2. Administrative costs related to the clinicians’ time represented 35% of total HDC administrative costs at Center 2 to 97% of HDC administrative costs at Center 4.
Figure 2.

In year one, total Health Disparities Collaboratives administration costs varied widely, from $6.41 per patient at Center 1 to $21.93 per patient at Center 2. Blue bars represent costs. Hatched bars indicate revenues from grants, and yellow bars indicate revenues from other sources (revenues are stacked).
In terms of revenues, Centers 2 through 5 obtained specific grants, including HRSA’s BPHC QI grants, to cover expenses.
Despite these grants, centers were generally not able to routinely obtain enough funding to fully support these activities, with one exception. Center 2 was able to obtain a grant related to improving diabetes care in year 1 that exceeded HDC costs, but this funding did not continue in subsequent years.
Outcome 2: Diabetes Clinical Costs and Revenues
All three centers with diabetes-specific data reported spreading the HDC to all patients with diabetes by year 2 of the collaborative. The balance of costs and revenues related to diabetes care and the payor mix of patients with diabetes did not clearly improve at any of the centers (Figure 3, page 144). For Center 3, mean diabetes care costs routinely exceeded clinical revenues, which was attributable to the center’s having a large and increasing proportion of uninsured patients with diabetes during the year before the HDC and afterwards (61% → 80%). For Center 4, mean diabetes care revenues regularly exceeded costs, and the payor mix of patients with diabetes remained stable, with approximately half of patients having no insurance (58% → 50%) and one-quarter enrolled in Medicare (22% → 25%). For Center 5, the balance of costs and revenues worsened slightly over time, with a negative balance beginning three years after the start of the HDC. Trends in payor mix were mixed with a decline in the privately insured (54% → 49%) coinciding with increases in Medicaid (15% → 30%) and Medicare coverage (39% → 44%). In general, the payor mix of patients with diabetes had a larger representation of uninsured and Medicare patients than for the health center populations as a whole. None of the centers has substantial managed care penetration and none benefited from pay-for-performance incentives.
Figure 3.

The balance of costs and revenues related to diabetes care and the payor mix of diabetes patients did not clearly improve at any of the centers. Blue bars represent costs and yellow bars indicate revenues. HDC, Health Disparities Collaboratives.
Outcome 3: Overall Center Costs and Revenues
The adoption of the HDC program occurred during a time of general HC growth. All case study centers saw growth in their overall budgets, the number of patients served, and the number of encounters seen per year during the period that the HDC program was instituted, as was the case for the average Midwestern center (Figure 4, page 145). The relative size of the HDC program as a proportion of the overall HC budget varied from 1.9% for Center 1 to 8.2% for Center 2 in year 1 of operations. Four out of five centers saw this proportion decline over time.
Figure 4.

The balance of costs and revenues related to diabetes care and the payor mix of diabetes patients did not clearly improve at any of the centers. Blue bars represent costs and yellow bars indicate revenues. “Year 1” for each health center ranged from 1999 to 2001. HDC, Health Disparities Collaboratives.
Outcome 4: Indirect Costs and Benefits
In qualitative interviews, most center leadership mentioned unanticipated costs such as the personnel time needed for data collection, but none of these costs were indirect or unmeasurable. The most frequently mentioned indirect benefit was a general improvement in chronic disease management. Center leadership specifically mentioned improvements in chronic diseases outside of diabetes that resulted from lessons learned from the Diabetes HDC (for example, use of patient registries for asthma). A less frequently mentioned indirect benefit was enhanced staff morale from observing improvements in diabetes care.
Discussion
The overall picture from our survey of CEOs and case study results is that QI programs do lead to new administrative costs and, very likely, new clinical costs, but that there is variation in how centers expend resources to develop QI programs and in how centers absorb, manage, and perceive these costs. Data from the case study centers indicate that the administration of the diabetes HDC program costs between $6 and $22 per patient in year 1, and, with one exception, centers generally did not obtain enough grant funding to cover costs. The program costs varied widely across the case study centers because of differences in HDC team size, clinician involvement, and differences in hiring of QI personnel.
Our analysis of diabetes clinical costs and revenues from three centers indicates that none of these centers experienced significant changes in clinical reimbursement or payor mix for patients with diabetes above and beyond general financial trends. Although these individual indicators suggest that costs rose relative to revenues, only three centers participated in that particular analysis. Overall, the five case study centers varied widely in the number of patients served, budgetary size, payor mix, and the overall balance of costs and revenues. This financial diversity among the five case study centers may reflect the variation in concluding remarks from the 74 health center CEOs in the wider survey regarding the HDC’s overall financial impact.
Our study also helps to illustrate that the financial impact of QI programs may be difficult to quantify precisely because health center leaders must weigh multiple, diverse financial and nonfinancial outcomes. CEO perceptions of the financial effect of the program may reflect a number of factors, including their perceptions of the size and benefit of their QI programs relative to the amount of time and money spent on them or the health center’s overall financial health. Some CEOs may have minimized the financial burdens of the HDC in the belief that QI is now a regular cost of business for health care organizations. CEOs reporting a positive financial impact may also have observed benefits of the HDC that were not directly measurable (for example, enhanced staff morale). Our case study findings provide some additional insight into these complex “business case” calculations. The HDC program undoubtedly represented a new cost to health centers; however, the program never exceeded 10% of any center’s budget, and, generally, these costs were fixed in relation to other center activities. The overall financial health of the HCs may have more to do with the local economy, patient demographics, and state/federal policies than with the HDC’s financial effects. Apart from these considerations, all case study CEOs reported in qualitative interviews a strong belief in the positive clinical effects of the HDC, a view supported by previous analyses of the Diabetes HDC.14 As a result, it is conceivable that the HDC’s financial burden was considered small by some CEOs in relation to the program’s clinical benefits.
These results should be considered in light of several limitations. First, the results of our CEO survey and our case studies may not be representative of the average HC’s experience with the HDC. For the CEO survey, we suspect that CEOs who responded had more sustainable QI programs than did nonresponders. Therefore, our survey results will be biased toward portraying a more positive picture of the financial impact of the HDC. For our case studies, centers were specifically selected because of their enthusiasm for this project and because of their potential ability to provide the necessary data. Again, this selection of centers would introduce a bias toward showing a favorable financial impact of the HDC. A second limitation of our study is that it is unclear to what extent CEO perceptions from the regional survey reflect the actual cost consequences of the HDC. On the basis of our own challenges with data collecting, we suspect that the perceptions of regional CEOs are probably not based on formal cost evaluations. Despite this limitation, we believe that these perceptions, inaccurate or not, may be crucial in determining how centers proceed with the HDC. Third, our analysis focused specifically on the cost consequences of the Diabetes HDC program, and we did not link these costs with the improvements in diabetes care achieved at these centers. It is very likely that the case study centers differed in their effectiveness in implementing the Diabetes HDC, and identifying low-cost, highly-effective approaches to improvement should be an important topic for future research. Fourth, although we focused on the HDC program for diabetes care, it is possible that improving care for other conditions might lead to different effects on costs and revenues. Finally, the costs and especially the revenues associated with QI programs may be different for private medical groups than for community HCs. Because private medical groups are more likely to care for well-insured patients, QI programs can increase revenue for these groups to the extent that they increase patients’ use of their services. HCs are likely to lose money when QI programs lead to increased outpatient utilization by their uninsured and underinsured patients, but they receive federal subsidies to care for these patients and may receive support for the QI program.9
Despite these limitations, we believe that our study of the financial impact of the HDC on health centers provides an important direction for future policy research related to efforts intended to improve chronic care in outpatient organizations. The perspective of outpatient organizations has been rarely adopted in health economic evaluations, in part because of the methodologic challenges of studying smaller health care organizations.7 Our study helps to bridge this gap by providing a practical taxonomy of the possible costs and revenues associated with implementing a QI program in an outpatient medical group. The study also illustrates how diverse data, from self-administered surveys to billing data, can be used to study the financial impact of QI programs. Our case studies demonstrate wide variability in the size, payor mix, and the overall financial health of HCs, and we suspect that this variation may be even greater across the full spectrum of outpatient organizations. In the future, it will be particularly important to determine whether or not outpatient organizations, like HCs, that provide care to patients with no insurance or Medicaid bear a greater financial burden of QI program costs and clinical cost consequences when compared with other facilities. In addition to potential differences across types of outpatient facilities, it is also important to note that the results of these financial analyses may vary for different periods of follow-up as programs and centers mature with time. Larger-scale observational studies with multiple outpatient clinical settings, possibly employing methods such as case-control design, would be the next step in the evaluation of the financial impact of QI. In the end, if it appears that program costs will routinely exceed revenues, it is unlikely that many outpatient groups serving the nation’s most vulnerable patients will implement and sustain QI programs, even those that are of great value to society, unless policymakers can redesign payment structures and/or create new incentives.
Acknowledgments
The work reported in this article was supported by an Agency for Healthcare Research and Quality U01 (Dr. Chin: Principal Investigator, U01 HS13635); a Robert Wood Johnson Generalist Physician Faculty Scholar Award (Dr. Chin); a National Institute of Aging (NIA) Career Development Award (Dr. Huang, K23 AG021963); a National Institute of Diabetes and Digestive and Kidney Diseases (NIDDK) Midcareer Investigator Award in Patient-Oriented Research (Dr. Chin, K24 DK071933); and an NIDDK Diabetes Research and Training Center (P60 DK20595).
References
- 1.Wagner EH, et al. Effect of improved glycemic control on health care costs and utilization. JAMA. 2001 Jan. 10285:182–189. doi: 10.1001/jama.285.2.182. [DOI] [PubMed] [Google Scholar]
- 2.Coye MJ. No Toyotas in health care: Why medical care has not evolved to meet patients’ needs. Health Aff (Millwood) 2001 Nov.-Dec.20:44–56. doi: 10.1377/hlthaff.20.6.44. [DOI] [PubMed] [Google Scholar]
- 3.Leatherman S, et al. The business case for quality: Case studies and an analysis. Health Aff (Millwood) 2003 Mar.-Apr.22:17–30. doi: 10.1377/hlthaff.22.2.17. [DOI] [PubMed] [Google Scholar]
- 4.Casalino LP. Markets and medicine: Barriers to creating a “business case for quality.”. Perspect Biol Med. 2003 Winter;46:38–51. doi: 10.1353/pbm.2003.0001. discussion 52-34. [DOI] [PubMed] [Google Scholar]
- 5.CDC Diabetes Cost-Effectiveness Group Cost-effectiveness of intensive glycemic control, intensified hypertension control, and serum cholesterol level reduction, for type 2 diabetes. JAMA. 2002 May 15;287:2542–2551. doi: 10.1001/jama.287.19.2542. [DOI] [PubMed] [Google Scholar]
- 6.Rosen AB, et al. Cost-effectiveness of full Medicare coverage of angiotensin-converting enzyme inhibitors for beneficiaries with diabetes. Ann Intern Med. 2005 Jul 19;143:89–99. doi: 10.7326/0003-4819-143-2-200507190-00007. [DOI] [PubMed] [Google Scholar]
- 7.Kilpatrick KE, et al. The insufficiency of evidence to establish the business case for quality. Int J Qual Health Care. 2005 Aug.17:347–355. doi: 10.1093/intqhc/mzi034. [DOI] [PubMed] [Google Scholar]
- 8.Schmidek JM, Weeks WB. What do we know about financial returns on investments in patient safety? A literature review. Jt Comm J Qual Patient Saf. 2005 Dec.31:690–699. doi: 10.1016/s1553-7250(05)31090-7. [DOI] [PubMed] [Google Scholar]
- 9.McAlearney JS. The financial performance of community health centers, 1996-1999. Health Aff (Millwood) 2002 Mar.-Apr.21:219–225. doi: 10.1377/hlthaff.21.2.219. [DOI] [PubMed] [Google Scholar]
- 10.Wagner EH, et al. Quality improvement in chronic illness care: A collaborative approach. Jt Comm J Qual Improv. 2001 Feb.27:63–80. doi: 10.1016/s1070-3241(01)27007-2. [DOI] [PubMed] [Google Scholar]
- 11.Von Korff M, et al. Collaborative management of chronic illness. Ann Intern Med. 1997 Dec. 15127:1097–1102. doi: 10.7326/0003-4819-127-12-199712150-00008. [DOI] [PubMed] [Google Scholar]
- 12.Bodenheimer T, et al. Improving primary care for patients with chronic illness: The chronic care model, Part 2. JAMA. 2002 Oct. 16288:1909–1914. doi: 10.1001/jama.288.15.1909. [DOI] [PubMed] [Google Scholar]
- 13.Bodenheimer T, et al. Improving primary care for patients with chronic illness. JAMA. 2002 Oct. 9288:1775–1779. doi: 10.1001/jama.288.14.1775. [DOI] [PubMed] [Google Scholar]
- 14.Chin MH, et al. Improving diabetes care in Midwest community health centers with the Health Disparities Collaborative. Diabetes Care. 2004 Jan.27:2–8. doi: 10.2337/diacare.27.1.2. Erratum in: Diabetes Care 27:2099, Aug. 2004. [DOI] [PubMed] [Google Scholar]
- 15.Chin MH, et al. Improving and sustaining diabetes care in community health centers with the Health Disparities Collaborative. Med Care. 2007 Dec.45:1135–1143. doi: 10.1097/MLR.0b013e31812da80e. [DOI] [PubMed] [Google Scholar]
- 16.Weeks WB, Bagian JP. Making the business case for patient safety. Jt Comm J Qual Saf. 2003 Jan.29:51–54. doi: 10.1016/s1549-3741(03)29007-9. [DOI] [PubMed] [Google Scholar]
- 17.Yin RK. Enhancing the quality of case studies in health services research. Health Serv Res. 1999 Dec.34:1209–1224. [PMC free article] [PubMed] [Google Scholar]
- 18.Ragin CC. Using qualitative comparative analysis to study causal complexity. Health Serv Res. 1999 Dec.34:1225–1239. [PMC free article] [PubMed] [Google Scholar]
- 19.Ragin CC. The distinctiveness of case-oriented research. Health Serv Res. 1999 Dec.34:1137–1151. [PMC free article] [PubMed] [Google Scholar]
- 20.Perloff JM. Microeconomics. 3rd ed. Pearson Addison Wesley; Boston: 2004. [Google Scholar]