

Abstract
Purpose
To compare the genetic relationship between cyclin D1–positive and cyclin D1–negative mantle cell lymphomas (MCLs) and to determine whether specific genetic alterations may add prognostic information to survival prediction based on the proliferation signature of MCLs.
Patients and Methods
Seventy-one cyclin D1–positive and six cyclin D1–negative MCLs previously characterized by gene expression profiling were examined by comparative genomic hybridization (CGH).
Results
Cyclin D1–negative MCLs were genetically characterized by gains of 3q, 8q, and 15q, and losses of 1p, 8p23-pter, 9p21-pter, 11q21–q23, and 13q that were also the most common alterations in conventional MCLs. Parallel analysis of CGH aberrations and locus-specific gene expression profiles in cyclin D1–positive patients showed that chromosomal imbalances had a substantial impact on the expression levels of the genes located in the altered regions. The analysis of prognostic factors revealed that the proliferation signature, the number of chromosomal aberrations, gains of 3q, and losses of 8p, 9p, and 9q predicted survival of MCL patients. A multivariate analysis showed that the gene expression-based proliferation signature was the strongest predictor for shorter survival. However, 3q gains and 9q losses provided prognostic information that was independent of the proliferative activity.
Conclusion
Cyclin D1–positive and –negative MCLs share the same secondary genetic aberrations, supporting the concept that they correspond to the same genetic entity. The integration of genetic information on chromosome 3q and 9q alterations into a proliferation signature-based model may improve the ability to predict survival in patients with MCL.
INTRODUCTION
Mantle cell lymphoma (MCL) is an aggressive B-cell non-Hodgkin’s lymphoma that makes up 5% to 10% of all human B-cell lymphomas.1 MCL is genetically characterized by the chromosomal translocation t(11;14)(q13;q32)m resulting in juxtaposition of the cyclin D1 gene and the immunoglobulin heavy chain enhancer, leading to constitutive overexpression of cyclin D1.2 In addition to cyclin D1 deregulation, secondary chromosomal alterations also play a pivotal role in MCL lymphomagenesis (eg, by disturbing the highly coordinated cell cycle regulation or the response to DNA damage).3 Various studies using conventional cytogenetics,4,5 comparative genomic hybridization (CGH),6–10 and array-based CGH11–13 have revealed a high number of such secondary chromosomal alterations in MCL, including gains in 3q, 6p, 7p, 8q, 10p, 12q, and 18q as well as losses of 1p, 6q, 8p, 9p, 9q, 11q, and 13q. Crucial target genes such as p16INK4a in 9p21,14,15 BMI-1 in 10p12,16 ATM in 11q22.3,17–19 CDK4 in 12q14,20 and p53 in 17p1321,22 have been identified. In addition, alterations in a number of chromosomal regions show a clear association with the clinical course of MCL patients.7,10,11,23 In contrast to cyclin D1–positive MCL, data on genetic alterations in the recently defined small subgroup of cyclin D1–negative MCL is lacking.24
Recently, the Leukemia and Lymphoma Molecular Profiling Project conducted a comprehensive gene expression profiling study of MCL specimens and identified the proliferation signature as a biologic integrator of various oncogenic events and as a powerful predictor of survival, allowing the definition of prognostic subgroups that differ in median survival by more than 5 years.25 However, the correlation between the gene expression–based measurement of tumor cell proliferation (proliferation signature) and underlying secondary genetic alterations in MCL has not yet been elucidated. Secondary chromosomal alterations may deregulate a large number of genes that influence the biologic behavior of the tumor. In a previous study in diffuse large B-cell lymphoma, we demonstrated that chromosomal aberrations had a substantial impact on the expression profile of locus-specific genes and improved the predictive value of the gene expression– based prognostic model.26 In the present study, we performed CGH analysis in 77 primary MCL patient samples (71 cyclin D1–positive and six cyclin D1–negative cases) that were studied previously by gene expression profiling25 to address three specific questions. First, we investigated whether the global profile of genetic alterations in cyclin D1–negative MCL24 is similar to conventional MCL overexpressing cyclin D1. Second, we examined the influence of individual chromosomal aberrations on specific gene expression changes. Finally, we evaluated whether specific secondary genetic alterations may provide prognostic information independent from the proliferation signature and, therefore, improve the predicted survival of MCL patients.
PATIENTS AND METHODS
Patient Characteristics
We studied 77 untreated MCL patients who had been characterized previously by gene expression profiling using the Lymphochip cDNA micro-array (National Institutes of Health, Bethesda, MD).25 The analysis of genetic alterations of these patients has not been published previously. Tumors were selected for the study on the sole basis of availability of genomic DNA obtained simultaneously with mRNA extraction from the same frozen tissue used for gene expression profiling. Seventy-one tumors were classified as cyclin D1–positive MCL (58 classical and 13 blastoid variants) and six tumors were classified as cyclin D1–negative MCL. Cyclin D1–positive samples had been analyzed previously by real-time quantitative polymerase chain reaction (qPCR) for losses of the p16INK4a, ATM, and p53 gene loci.25 The proliferation signature of all samples was calculated using the expression levels of 20 proliferation-associated genes.25 Thus, the proliferation signature was built as a continuous variable, ranging from −1.31 to 1.5. Patients with a proliferation signature below the median (−0.04) were considered as the low proliferation group, whereas those with the index above the median were considered as the high proliferation group.
Clinical data were obtained from all patients according to a protocol approved by the National Cancer Institute Institutional Review Board.
CGH
CGH was performed using a commercially available CGH kit provided by Vysis (Downers Grove, IL). Hybridizations and digital image acquisition, processing, and evaluation were performed on a Cytovision Ultra Workstation (Applied Imaging, Sunderland, United Kingdom) as described previously.7 Signal ratios greater than 1.25 or less than 0.75 were considered as chromosomal gains or losses, respectively. Ratios exceeding 1.5 and/or strong focal signals with the ratio profile showing over-representation were considered as high-level DNA amplifications. Complete CGH data are available at http://www.ncbi.nlm.nih.gov/sky.
Statistical Analysis
The association between losses of 9p, 11q, and 17p as detected by CGH and losses of the p16INK4a, ATM, and p53 loci analyzed by qPCR25 was evaluated using χ² or Fisher’s exact test. In addition, odds ratios (ORs) and 95% CI were calculated. Kendall’s τb (Kt) test was used to assess concordance. To determine the relationship between chromosomal imbalances and the expression levels (as a continuous variable) of the genes located in the corresponding altered chromosomal region (gain versus normal copy number and loss versus normal copy number), the nonparametric Mann-Whitney test was performed. The association between 3q amplification versus gain versus normal and the expression levels of the genes in this region was analyzed by means of the Kruskal-Wallis test. Overall survival was estimated using the Kaplan-Meier method. Cox proportional hazards models were used to estimate hazard ratios (HRs) and calculate 95% CIs. Once a chromosomal abnormality was found to be significant univariately, a likelihood ratio test was used to determine whether this variable added significantly to the survival model based on the proliferation signature.25 When multiple chromosomal alterations or genes were considered in the same analysis, the P values were adjusted for multiple comparisons using the false discovery rate method,27 as implemented in the R package multitest version 1.10.2 (http://cran.r-project.org). Adjusted P values less than .05 were considered significant.
RESULTS
Cyclin D1–Positive and Cyclin D1–Negative MCL Share Recurrent Chromosomal Alterations
Clinical characteristics of MCL patients are summarized in Table 1. The median age of the patients was 62 years (range, 38 to 92 years), the ratio of males to females was 58 to 19. Seventy-one patients received multiagent chemotherapy, including rituximab in 10 patients; four patients were not treated, and no information on the treatment was available in two patients. Overall, the clinical characteristics of the cyclin D1–positive and cyclin D1–negative patients were similar (Table 1). All cyclin D1–negative MCLs had a typical morphology. In addition, the gene expression–based proliferation signature of the cyclin D1–positive and cyclin D1–negative tumors showed no statistically significant difference between these two groups (P =.46).
Table 1.
Clinical Characteristics of Patients With Cyclin D1 Positive and Cyclin D1 Negative MCL
| Cyclin D1 Positive |
Cyclin D1 Negative |
|||
|---|---|---|---|---|
| Characteristic | No. | % | No. | % |
| Total No. of patients | 71 | 6 | ||
| Age, years | ||||
| Median | 63 | 61 | ||
| Range | 38–92 | 54–77 | ||
| Sex | ||||
| Male | 53 | 5 | ||
| Female | 18 | 1 | ||
| Histology | ||||
| Classic | 58 | 82 | 6 | 100 |
| Blastoid | 13 | 18 | — | |
| Ann Arbor stage | ||||
| I/II | 8 | 11 | — | |
| III/IV | 70 | 89 | 6 | 100 |
| “B” symptoms | 25 | 36 | 2 | 33 |
| ECOG performance status | ||||
| 0−1 | 51 | 72 | 6 | 100 |
| ≥2 | 12 | 17 | — | |
| LDH level > normal | 26 | 37 | 2 | 33 |
| BM involvement | 39 | 57 | 6 | 100 |
| IPI score | ||||
| Low risk (0, 1) | 16 | 26 | — | |
| Intermediate risk (2, 3) | 35 | 56 | 6 | 100 |
| High risk (4, 5) | 11 | 18 | — | |
| Therapy* | ||||
| Combined chemotherapy | 57 | 83 | 4 | 66 |
| Combined chemotherapy plus rituximab | 9 | 13 | 1 | 17 |
| No treatment | 3 | 4 | 1 | 17 |
| Response to therapy (CR + PR) | 53 of 66 | 80 | 5 of 5 | 100 |
| Median follow-up, months | 23 | 34 | ||
| Median survival, months | 28 | NR | ||
Abbreviations: MCL, mantle cell lymphoma; ECOG, Eastern Cooperative Oncology Group; LDH, lactate dehydrogenase; IPI, International Prognostic Index; BM, bone marrow; CR, complete response; PR, partial response; NR, not reached.
No information on therapy was available for two patients.
Among the 71 cyclin D1–positive MCLs, 64 (90%) showed aberrant profiles by CGH analysis, whereas no chromosomal imbalances were detected in seven cases. Among aberrant cases, a total of 86 gains and 184 losses of chromosomal material were observed. Recurrent chromosomal alterations in cyclin D1–positive and cyclin D1–negative MCLs are listed in Table 2. In cyclin D1–positive tumors, chromosomal alterations occur most frequently in 3q, 1p, 13q, and 11q21–q23 (Fig 1A). No recurrent high-level DNA amplifications were detected. MCL patients with blastoid morphology (13%) showed more frequently losses of 9p21-pter than classical MCL variants (54% v 10%; P < .001). Overall, the global profile of genomic imbalances detected in our study is well in accordance with published data.6,7,11,13
Table 2.
Commonly Altered Chromosomal Regions in Cyclin D1–Positive and Cyclin D1–Negative MCL
| Cyclin D1–Positive MCL (n=71) |
Cyclin D1-Negative MCL (n=6) |
|||
|---|---|---|---|---|
| Alteration | No. of patients | % | No. of patients | % |
| Gain | ||||
| 3q21-qter | 23 | 32 | 3 | 50 |
| 8q21-qter | 8 | 11 | 2 | 33 |
| 15q21-qter | 8 | 11 | 2 | 33 |
| 18q11–q23 | 8 | 11 | — | |
| Loss | ||||
| 1p21–p31 | 37 | 52 | 2 | 33 |
| 13q14–q34 | 29 | 41 | 4 | 67 |
| 11q21–q23 | 20 | 28 | 3 | 50 |
| 6q22-qter | 16 | 22 | — | |
| 6q15–q21 | 13 | 18 | — | |
| 9p21-pter | 13 | 18 | 2 | 33 |
| 9q21-qter | 15 | 21 | 1(%) | 17 |
| 8p21-pter | 9 | 13 | 2 | 33 |
| 13q11–q13 | 12 | 17 | 2 | 33 |
| 17p13-pter | 9 | 13 | — | |
Abbreviation: MCL, mantle cell lymphoma.
Fig 1.

Ideogram of the distribution of gains and losses of genetic material detected by comparative genomic hybridization in (A) cyclin D1–positive mantle cell lymphoma (MCL) and (B) cyclin D1–negative MCL. Red bars on the left side correspond to genetic losses; green bars on the right side indicate genetic gains. Bold bars indicate amplifications.
In cyclin D1–negative MCL, the most common chromosomal alterations also affected 3q, 13q, and 11q (Table 2; Fig 1B). Although the number of cyclin D1–negative patients is small, these results suggest that these two MCL variants share the same profile of secondary genomic aberrations.
The CGH data in the chromosomal regions 9p21-pter, 11q22–q23, and 17p were in good concordance with deletions of specific target genes as detected by qPCR.25 Specifically, losses of 9p21-pter were significantly associated with deletions of the p16INK4a locus (Kt, 0.67; OR, 43.0; 95% CI, 7.2 to 484.6). Similarly, 11q22–q23 losses were associated with deletions of the ATM locus by qPCR (Kt, 0.55; OR, 13.3; 95% CI, 3.5 to 60.0), and losses of 17p13 with p 53 gene deletions (Kt, 0.49; OR, 21.7; 95% CI, 2.5 to 295.8).
Chromosomal Alterations Influence Locus-Specific Gene Expression
To determine the influence of chromosomal imbalances on locus-specific gene expression in cyclin D1–positive patients, the expression level of genes located in seven frequently altered regions (1p21–p31, 3q25-qter, 8p21-pter, 9p21-pter, 9q21–q32, 11q21–q23, and 13q32–q33) were correlated with chromosomal copy number changes. As expected, chromosomal gains and losses were associated with higher or lower expression of a subset of genes within the involved chromosomal regions, respectively. The number of genes with significant changes in gene expression in each band differed between chromosomal regions. For example, among 50 genes in the chromosomal region 3q25-qter represented on the Lymphochip, 24 (48%) were significantly overexpressed in patients with gains and amplifications, including PIK3CA, ACTL6A, YEATS2 (3q27), RFC4 (3q28), and CENTB2 (3q29; Fig 2A). In contrast, in the chromosomal region 8p21-pter, only 27% of genes present on the Lymphochip showed altered gene expression, with decreased levels as compared with MCL patients with normal gene copy number of this genomic region (Fig 2B). In the 9q21–q32 region, 21 genes (48%) showed decreased expression in patients with chromosomal losses (Fig 2C) and, similarly, 62% of genes were affected by loss of genomic material in 13q32–q33 (Fig 2D), although the number of clones represented on the Lymphochip is relatively low. Regions 9p21-pter and 11q21–q23 were also evaluated, with a percentage of 12.5% and 15% genes deregulated, respectively (Appendix Fig A1, online only). Finally, no significantly downregulated genes were found in the 1p21–p31 region. There were no overexpressed genes in areas of CGH loss, nor were any genes downregulated in regions with chromosomal gains in any of the regions examined.
Fig. 2.
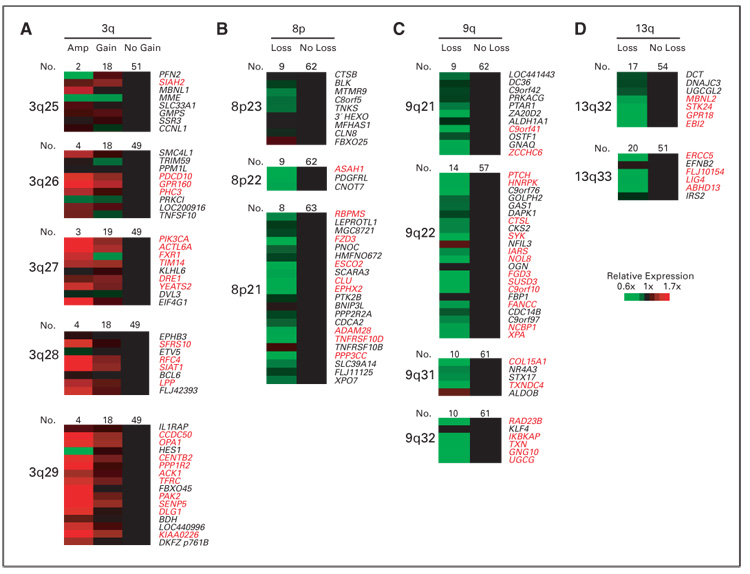
Influence of chromosomal alterations on locus-specific gene expression levels. (A) 3q, (B) 8p, (C) 9q, and (D) 13q. Genes are ordered according to their chromosomal position (Genes On Sequence Map, Homo sapiens built 33). For genes with more than one microarray element on the Lymphochip, the average expression from different clones was calculated. Genes with significant differences (P < .05) are highlighted in red. Amp, amplification.
Prognostic Value of Chromosomal Alterations in MCL
The prognostic value of the global number of chromosomal imbalances and specific altered regions with a frequency higher than 10% was analyzed in the entire set of cyclin D1–positive MCLs. The P values were adjusted for the step-up false discovery rate.27 In the univariate analysis, an increased number of CGH alterations (three or more v < three alterations per case) was associated with shorter overall survival (OS; median OS, 1.6 v 5.1 year, respectively; HR, 2.08; 95% CI, 1.10 to 3.93; P = .019). In addition, different chromosomal imbalances were associated with poor OS in MCL patients, namely gains of 3q27-qter (median OS, 2 v 3.3 years; P = .039; HR, 2.27; 95% CI, 1.19 to 4.32), as well as losses of 8p21-pter (median OS, 0.6 v 2.5 years; HR, 2.64; 95% CI, 1.21 to 5.75; P =.039;), 9p21-pter (median OS, 0.8 v 3.3 years; HR, 5.43; 95% CI, 2.44 to 12.0; P < .0001), and 9q21–q32 (median OS, 0.8 v 3.1 year; HR, 2.36; 95% CI, 1.23 to 4.52; P = .039). As previously reported, patients with high proliferation signature (median, > −0.04) showed poorer OS than the remainder (median OS, 1.4 v 3.6 years, respectively; HR, 4.28; 95% CI, 2.21 to 8.30; P < .0001).
To determine whether the prognostic value of these chromosomal alterations was independent of proliferation, a multivariate analysis was performed including the proliferation signature and all of the CGH alterations with predictive value for OS. The multivariate model showed that proliferation signature (HR, 4.25; 95% CI, 2.16 to 8.36; P < .0001), gain of 3q27-qter (HR, 2.51; 95% CI, 1.29 to 4.89;P =.007), and loss of 9q21–q32 (HR, 2.48; 95% CI, 1.26 to 4.86; P = .008) were associated simultaneously with poor OS. To visualize the independent prognostic value of these two CGH alterations from the proliferation signature, we subdivided the patients into four groups according to their proliferation signature and the presence or absence of the genetic alteration. Interestingly, the alterations in 3q27-qter seem to provide prognostic information predominantly among MCL patients with a low proliferation signature (Fig 3A), whereas losses of 9q21–q32 may have higher impact in the MCL subgroup with increased proliferation signature (Fig 3B).
Fig. 3.

Impact of genomic imbalances on survival of mantle cell lymphoma (MCL) patients. Kaplan-Meier survival estimates of MCL patients (A) with genomic gains of 3q27-qter (P = .039) and (B) losses of 9q22–q32 (P = .039) in comparison with their stratification into two survival groups based on the gene expression–based proliferation predictor model alone. n, number of patients; D, dead patients.
DISCUSSION
MCL is a well characterized lymphoid neoplasm with the t(11;14) (q13;q32) translocation as the primary genetic event leading to the constant overexpression of cyclin D1.2 Recently, the gene expression profile analysis of a large series of MCLs allowed us to identify a particular subset of tumors with the same clinical presentation, morphology, phenotype, and global expression profile as conventional MCL except the lack of cyclin D1 expression and the t(11;14) translocation.24,25 These tumors were termed cyclin D1–negative MCL. Interestingly, these patients overexpressed cyclin D2 or D3 suggesting that upregulation of these G1 cyclins could be an alternative mechanism in the pathogenesis of MCL. In this study, we demonstrate that cyclin D1–negative MCL share the same secondary genomic alterations as tumors overexpressing cyclin D1. The most frequent chromosomal aberrations in MCL lacking cyclin D1 were gains of 3q, 8q, and 15q, and losses of 1p, 8p23-pter, 9p21-pter, 11q21–q23, and 13q, which are the same alterations most commonly observed in conventional MCL. Most malignant lymphomas are characterized genetically by a distinct recurrent primary chromosomal translocation such as the t(11;14) in MCL, t(14;18) in follicular lymphoma, or the t(8;14) in Burkitt’s lymphoma. In addition, the profile of secondary chromosomal alterations is also relatively specific for each disease entity. For example, MCL and chronic lymphocytic leukemia (CLL) share some common alterations such as losses of 13q and 11q, but isolated trisomy 12 is present almost exclusively in CLL, whereas gains of 3q and losses of 1p are frequent in MCL but rare in CLL.28,29 In marginal zone lymphoma, trisomy 3 is a common finding and, although in cyclin D1–positive and cyclin D1–negative MCL gains of 3q are common, trisomy 3 is not observed in our series. In addition, losses of 1p, 11q, and 13q are not a feature of marginal zone lymphomas.30,31 Likewise, the combination of secondary chromosomal alterations as demonstrated in this study is not seen in follicular lymphomas that are mainly characterized by gains of chromosome 7, 12, 18, and X, and losses of 6q.32 Therefore, the similar profile of secondary genetic alterations in cyclin D1–positive and cyclin D1–negative tumors observed in our study supports the idea that they correspond to the same biologic entity and share similar genetic pathways of evolution.
The analysis of CGH and expression profile performed in DNA and RNA obtained from the same tissue sample has allowed us to study the relationship between genomic imbalances in MCL and the expression of genes located within altered chromosomal regions, and to identify potentially deregulated target genes. Recent studies in a variety of tumors, among them diffuse large B-cell lymphoma (DLBCL), have demonstrated a correlation between gene copy number changes and the expression level of genes encoded in numerically altered genomic regions.26,33–37 In our study, we have examined the relationship between chromosomal imbalances and the expression of genes located in seven commonly altered chromosomal regions, some of them also related to the proliferation of the tumors or the survival of the patients (1p21–p31, 3q25-qter, 8p21-pter, 9p21-pter, 9q21–q32, 11q21–q23, and 13q32–q33). Concordant with our previous findings in DLBCL, between 27% and 62% of genes located within these altered chromosomal regions showed a significant change in expression level in cases with chromosomal alterations. The finding that only a subset of genes shows altered expression levels in chromosomal regions with a genomic gain or loss is well in accordance with published literature in other types of lymphomas and in solid cancers.33,36 This may be, at least in part, explained by the fact that only a subset of the genome is expressed in the normal counterpart from which the malignant tumor cell is derived. In addition, other genetic alterations or transcriptional deregulation of key regulators in the tumor cell may influence expression levels of genes located in chromosomal regions with genomic imbalances that are independent of underlying DNA copy number alterations. Interestingly, a substantial number of these deregulated genes were related to pathways that may influence the biology of the tumor. Thus, a number of deregulated genes were involved in cell proliferation, such as YEATS2, PICK3, ACTL6 (3q27), RFC4 (3q28), and CENTB2 (3q29); DNA repair and maintenance of chromosome stability, such as FANCC and XPA (9q22), RAD23 (9q32), ESCO2 (8p21), ATM (11q23), ERCC5, and LIG4 (13q33); or cellular homeostasis and apoptosis, such as BIRC2 (11q22), SIAH2 (3q25), CASP1 and CASP4 (11q21), CLU and TNFRSF10D (8p21), and PAK2 (3q29).
Gains and amplifications of the chromosomal region 3q25-qter are a common feature of MCL, but also of the activated B-cell–like subtype of DLBCL, as demonstrated in our previous analysis of DLBCL.26 However, the particular group of genes deregulated by this chromosomal aberration differs in part in the two types of lymphomas. Thus, 29 genes mapped to this region included in the Lymphochip microarray could be evaluated in both types of lymphomas. MCL and activated B-cell–like DLBCL with gains in 3q25-qter had a significant upregulation of 16 (61%) and 10 (34%) of these genes, respectively. Interestingly, seven genes (SIAH2, PDCD10, RFC4, OPA1, PPP1R2, PAK2, and KIAA0226) were upregulated in both lymphoma entities, whereas ten (GPR160, PH3, PIK3CA, FXR1, SIAT1, LPP, CCDC50, CENTB2, ACK1, and TFRC) and three genes (GMPS, TNSF10, and BDH) were differentially overexpressed only in MCL and activated B-cell–like DLBCL, respectively. These findings suggest that similar chromosomal aberrations in different lymphoma entities may influence the expression of different subsets of genes.
MCL has an aggressive clinical course with a median survival of 3 to 4 years.38 However, clinical studies have recognized that some patients have MCL with a more indolent behavior and have longer survival, whereas others follow a very rapid course and die from the disease in less than 1 year.25,38 Clinical studies have identified several prognostic factors including the International Prognostic Index.1,39–41 Molecular investigations have identified inactivation of p53, INK4a-ARF locus, and high cyclin D1 expression levels as markers of shorter survival.21,25,42 Recently, the proliferative activity has been recognized as a powerful prognostic indicator that probably integrates multiple oncogenic events in the progression of the tumors. The quantification of the expression levels of 20 proliferation-related genes stratified MCL patients with a difference of almost 6 years in the median survival.25 Conversely, previous genetic studies in MCL observed that gains of chromosome 3q and losses of 8p, 9p, 9q, 13q, and 17p identify patients with a more aggressive clinical evolution.7,11,23 However, the relationship between genetic alterations and proliferation as prognostic parameters is not known.
In our study, increased number of chromosomal alterations, gains of 3q27-qter, and losses of 8p21-pter, 9p21-pter, and 9q21–q32 were associated with a poor clinical outcome. Interestingly, the prognostic value of 3q27-qter gains and losses of 9q21–q32 were found to be independent of the gene expression–based proliferation signature. The finding that losses of 9p21-pter do not provide prognostic information to the gene expression–based proliferation signature is expected given the strong association between losses of p16INK4a (located at 9p21) and the proliferation of the tumor cells. It is an interesting observation that chromosomal alterations in 3q27-qter and 9q21–q32 seem to influence the evolution of different subsets of tumors. Thus, gains of 3q had a prognostic impact mainly in patients with low proliferation, whereas losses of 9q improved the predictive value in the subgroup of MCL with high proliferation. Therefore, the integration of genetic information (3q and 9q alterations) and the quantitative measurement of tumor cell proliferation (proliferation signature) may improve the ability to predict survival in patients with MCL.
Acknowledgment
We acknowledge the contributions of Philipp Jehn, Xavier Puig, Liming Yang, Richard Simon, John Powell, Wyndham Wilson, Kai Fu, Timothy Greiner, James Armitage, Daphne de Jong, Joseph M. Connors, Lisa M. Rimsza, Rita Braziel, Richard I. Fisher, Erlend B. Smeland, Stein Kvaloy, and Harald Holte.
Supported by the Spanish Comisión Interministerial de Ciencia y Tecnología (CICYT) Grant No. SAF05/5855, Instituto de Salud Carlos III, Red Temática de Cáncer (Grant No. G03/10), Red temática limfomas (Grant No. G03/179; to E.C.); the European Union Contract No. LSHC-CT 2004-503351, the Interdisciplinary Center for Clinical Research of the University of Würzburg, Germany (to A.R.); The Lymphoma Research Foundation, and by a Director’s Challenge grant (Grant No. UO1-CA84967) from the National Cancer Institute, Bethesda, MD (to W.C.C.).
Appendix
The Appendix is included in the full-text version of this article, available online at www.jco.org. It is not included in the PDF version (via Adobe® Reader®)
Footnotes
Presented as oral communication at the 2006 United States and Canadian Academy of Pathology Annual Meeting, February 11–17, 2006, Atlanta, GA.
AUTHORS' DISCLOSURES OF POTENTIAL CONFLICTS OF INTEREST
The authors indicated no potential conflicts of interest.
REFERENCES
- 1.The Non-Hodgkin‘s Lymphoma Classification Project: A clinical evaluation of the International Lymphoma Study Group classification of non-Hodgkin's lymphoma. Blood. 2006;89:3909–3918. [PubMed] [Google Scholar]
- 2.Bosch F, Jares P, Campo E, et al. PRAD-1/cyclin D1 gene overexpression in chronic lympho-proliferative disorders: A highly specific marker of mantle cell lymphoma. Blood. 1994;84:2726–2732. [PubMed] [Google Scholar]
- 3.Fernandez V, Hartmann E, Ott G, et al. Pathogenesis of mantle-cell lymphoma: All oncogenic roads lead to dysregulation of cell cycle and DNA damage response pathways. J Clin Oncol. 2005;23:6364–6369. doi: 10.1200/JCO.2005.05.019. [DOI] [PubMed] [Google Scholar]
- 4.Cuneo A, Bigoni R, Rigolin GM, et al. Cytogenetic profile of lymphoma of follicle mantle lineage: Correlation with clinicobiologic features. Blood. 1999;93:1372–1380. [PubMed] [Google Scholar]
- 5.Wlodarska I, Pittaluga S, Hagemeijer A, et al. Secondary chromosome changes in mantle cell lymphoma. Haematologica. 1999;84:594–599. [PubMed] [Google Scholar]
- 6.Monni O, Oinonen R, Elonen E, et al. Gain of 3q and deletion of 11q22 are frequent aberrations in mantle cell lymphoma. Genes Chromosomes Cancer. 1998;21:298–307. doi: 10.1002/(sici)1098-2264(199804)21:4<298::aid-gcc3>3.0.co;2-u. [DOI] [PubMed] [Google Scholar]
- 7.Bea S, Ribas M, Hernandez JM, et al. Increased number of chromosomal imbalances and high-level DNA amplifications in mantle cell lymphoma are associated with blastoid variants. Blood. 1999;93:4365–4374. [PubMed] [Google Scholar]
- 8.Bentz M, Plesch A, Bullinger L, et al. T(11;14)-positive mantle cell lymphomas exhibit complex karyotypes and share similarities with B-cell chronic lymphocytic leukemia. Genes Chromosomes Cancer. 2000;27:285–294. [PubMed] [Google Scholar]
- 9.Martinez-Climent JA, Vizcarra E, Sanchez D, et al. Loss of a novel tumor suppressor gene locus at chromosome 8p is associated with leukemic mantle cell lymphoma. Blood. 2001;98:3479–3482. doi: 10.1182/blood.v98.12.3479. [DOI] [PubMed] [Google Scholar]
- 10.Allen JE, Hough RE, Goepel JR, et al. Identification of novel regions of amplification and deletion within mantle cell lymphoma DNA by comparative genomic hybridization. Br J Haematol. 2002;116:291–298. doi: 10.1046/j.1365-2141.2002.03260.x. [DOI] [PubMed] [Google Scholar]
- 11.Kohlhammer H, Schwaenen C, Wessendorf S, et al. Genomic DNA-chip hybridization in t(11;14)-positive mantle cell lymphomas shows a high frequency of aberrations and allows a refined characterization of consensus regions. Blood. 2004;104:795–801. doi: 10.1182/blood-2003-12-4175. [DOI] [PubMed] [Google Scholar]
- 12.Schraders M, Pfundt R, Straatman HM, et al. Novel chromosomal imbalances in mantle cell lymphoma detected by genome-wide array-based comparative genomic hybridization. Blood. 2005;105:1686–1693. doi: 10.1182/blood-2004-07-2730. [DOI] [PubMed] [Google Scholar]
- 13.Tagawa H, Karnan S, Suzuki R, et al. Genomewide array-based CGH for mantle cell lymphoma: Identification of homozygous deletions of the proapoptotic gene BIM. Oncogene. 2005;24:1348–1358. doi: 10.1038/sj.onc.1208300. [DOI] [PubMed] [Google Scholar]
- 14.Pinyol M, Cobo F, Bea S, et al. P16(INK4a) gene inactivation by deletions, mutations, and hypermethylation is associated with transformed and aggressive variants of non-Hodgkin‘s lymphomas. Blood. 1998;91:2977–2984. [PubMed] [Google Scholar]
- 15.Dreyling MH, Bullinger L, Ott G, et al. Alterations of the cyclin D1/p16-pRB pathway in mantle cell lymphoma. Cancer Res. 1997;57:4608–4614. [PubMed] [Google Scholar]
- 16.Bea S, Tort F, Pinyol M, et al. BMI-1 gene amplification and overexpression in hematological malignancies occur mainly in mantle cell lymphomas. Cancer Res. 2001;61:2409–2412. [PubMed] [Google Scholar]
- 17.Schaffner C, Idler I, Stilgenbauer S, et al. Mantle cell lymphoma is characterized by inactivation of the ATM gene. Proc Natl Acad Sci U S A. 2000;97:2773–2778. doi: 10.1073/pnas.050400997. [DOI] [PMC free article] [PubMed] [Google Scholar]
- 18.Camacho E, Hernandez L, Hernandez S, et al. ATM gene inactivation in mantle cell lymphoma mainly occurs by truncating mutations and missense mutations involving the phosphatidylinositol-3 kinase domain and is associated with increasing numbers of chromosomal imbalances. Blood. 2002;99:238–244. doi: 10.1182/blood.v99.1.238. [DOI] [PubMed] [Google Scholar]
- 19.Greiner TC, Dasgupta C, Ho VV, et al. Mutation and genomic deletion status of ataxia telangiectasia mutated (ATM) and p53 confer specific gene expression profiles in mantle cell lymphoma. Proc Natl Acad Sci U S A. 2006;103:2352–2357. doi: 10.1073/pnas.0510441103. [DOI] [PMC free article] [PubMed] [Google Scholar]
- 20.Hernandez L, Bea S, Pinyol M, et al. CDK4 and MDM2 gene alterations mainly occur in highly proliferative and aggressive mantle cell lymphomas with wild-type INK4a/ARF locus. Cancer Res. 2005;65:2199–2206. doi: 10.1158/0008-5472.CAN-04-1526. [DOI] [PubMed] [Google Scholar]
- 21.Hernandez L, Fest T, Cazorla M, et al. p53 gene mutations and protein overexpression are associated with aggressive variants of mantle cell lymphomas. Blood. 1996;87:3351–3359. [PubMed] [Google Scholar]
- 22.Greiner TC, Moynihan MJ, Chan WC, et al. p53 mutations in mantle cell lymphoma are associated with variant cytology and predict a poor prognosis. Blood. 1996;87:4302–4310. [PubMed] [Google Scholar]
- 23.Rubio-Moscardo F, Climent J, Siebert R, et al. Mantle-cell lymphoma genotypes identified with CGH to BAC microarrays define a leukemic subgroup of disease and predict patient outcome. Blood. 2005;105:4445–4454. doi: 10.1182/blood-2004-10-3907. [DOI] [PubMed] [Google Scholar]
- 24.Fu K, Weisenburger DD, Greiner TC, et al. Cyclin D1-negative mantle cell lymphoma: A clinico-pathologic study based on gene expression profiling. Blood. 2005;106:4315–4321. doi: 10.1182/blood-2005-04-1753. [DOI] [PMC free article] [PubMed] [Google Scholar]
- 25.Rosenwald A, Wright G, Wiestner A, et al. The proliferation gene expression signature is a quantitative integrator of oncogenic events that predicts survival in mantle cell lymphoma. Cancer Cell. 2003;3:185–197. doi: 10.1016/s1535-6108(03)00028-x. [DOI] [PubMed] [Google Scholar]
- 26.Bea S, Zettl A, Wright G, et al. Diffuse large B-cell lymphoma subgroups have distinct genetic profiles that influence tumor biology and improve gene-expression-based survival prediction. Blood. 2005;106:3183–3190. doi: 10.1182/blood-2005-04-1399. [DOI] [PMC free article] [PubMed] [Google Scholar]
- 27.Benjamini Y, Hochberg Y. Controlling the base discovery rate: A practical and powerful approach to multiple testing. J R Stat Soc B. 1995;57:289–300. [Google Scholar]
- 28.Bentz M, Huck K, du MS, et al. Comparative genomic hybridization in chronic B-cell leukemias shows a high incidence of chromosomal gains and losses. Blood. 1995;85:3610–3618. [PubMed] [Google Scholar]
- 29.Bea S, Lopez-Guillermo A, Ribas M, et al. Genetic imbalances in progressed B-cell chronic lymphocytic leukemia and transformed large-cell lymphoma (Richter"s syndrome) Am J Pathol. 2002;161:957–968. doi: 10.1016/S0002-9440(10)64256-3. [DOI] [PMC free article] [PubMed] [Google Scholar]
- 30.Dierlamm J, Rosenberg C, Stul M, et al. Characteristic pattern of chromosomal gains and losses in marginal zone B cell lymphoma detected by comparative genomic hybridization. Leukemia. 1997;11:747–758. doi: 10.1038/sj.leu.2400635. [DOI] [PubMed] [Google Scholar]
- 31.Hernandez JM, Garcia JL, Gutierrez NC, et al. Novel genomic imbalances in B-cell splenic marginal zone lymphomas revealed by comparative genomic hybridization and cytogenetics. Am J Pathol. 2001;158:1843–1850. doi: 10.1016/S0002-9440(10)64140-5. [DOI] [PMC free article] [PubMed] [Google Scholar]
- 32.Viardot A, Moller P, Hogel J, et al. Clinicopathologic correlations of genomic gains and losses in follicular lymphoma. J Clin Oncol. 2002;20:4523–4530. doi: 10.1200/JCO.2002.12.006. [DOI] [PubMed] [Google Scholar]
- 33.Hyman E, Kauraniemi P, Hautaniemi S, et al. Impact of DNA amplification on gene expression patterns in breast cancer. Cancer Res. 2002;62:6240–6245. [PubMed] [Google Scholar]
- 34.Orsetti B, Nugoli M, Cervera N, et al. Genomic and expression profiling of chromosome 17 in breast cancer reveals complex patterns of alterations and novel candidate genes. Cancer Res. 2004;64:6453–6460. doi: 10.1158/0008-5472.CAN-04-0756. [DOI] [PubMed] [Google Scholar]
- 35.Phillips JL, Hayward SW, Wang Y, et al. The consequences of chromosomal aneuploidy on gene expression profiles in a cell line model for prostate carcinogenesis. Cancer Res. 2001;61:8143–8149. [PubMed] [Google Scholar]
- 36.Pollack JR, Sorlie T, Perou CM, et al. Microarray analysis reveals a major direct role of DNA copy number alteration in the transcriptional program of human breast tumors. Proc Natl Acad Sci U S A. 2002;99:12963–12968. doi: 10.1073/pnas.162471999. [DOI] [PMC free article] [PubMed] [Google Scholar]
- 37.Virtaneva K, Wright FA, Tanner SM, et al. Expression profiling reveals fundamental biological differences in acute myeloid leukemia with isolated trisomy 8 and normal cytogenetics. Proc Natl Acad Sci U S A. 2001;98:1124–1129. doi: 10.1073/pnas.98.3.1124. [DOI] [PMC free article] [PubMed] [Google Scholar]
- 38.Campo E, Raffeld M, Jaffe ES. Mantle-cell lymphoma. Semin Hematol. 1999;36:115–127. [PubMed] [Google Scholar]
- 39.Bosch F, Lopez-Guillermo A, Campo E, et al. Mantle cell lymphoma: Presenting features, response to therapy, and prognostic factors. Cancer. 1998;82:567–575. doi: 10.1002/(sici)1097-0142(19980201)82:3<567::aid-cncr20>3.0.co;2-z. [DOI] [PubMed] [Google Scholar]
- 40.Dreyling M, Lenz G, Hoster E, et al. Early consolidation by myeloablative radiochemotherapy followed by autologous stem cell transplantation in first remission significantly prolongs progression-free survival in mantle-cell lymphoma: Results of a prospective randomized trial of the European MCL Network. Blood. 2005;105:2677–2684. doi: 10.1182/blood-2004-10-3883. [DOI] [PubMed] [Google Scholar]
- 41.Argatoff LH, Connors JM, Klasa RJ, et al. Mantle cell lymphoma: A clinicopathologic study of 80 cases. Blood. 1997;89:2067–2078. [PubMed] [Google Scholar]
- 42.Pinyol M, Hernandez L, Cazorla M, et al. Deletions and loss of expression of p16INK4a and p21Waf1 genes are associated with aggressive variants of mantle cell lymphomas. Blood. 1997;89:272–280. [PubMed] [Google Scholar]