

Abstract
The neural mechanisms supporting visuospatial orienting and focusing were investigated by recording event-related potentials (ERPs) in a cued, line-orientation discrimination task. Search arrays flashed randomly in the left or right visual field and were preceded by peripheral cues that varied in validity (valid or invalid, with 50% each) and size (large or small, with 50% each). Facilitation of response time was observed for valid trials, regardless of cue size. In contrast to previous cued search studies, however, small (i.e., more precise) cues were associated with delayed responses. Both the timing and the amplitudes of the early ERP components, P1 and N1, were modulated by attentional orienting, with valid trials eliciting a larger and later contralateral vP1 (ventral P1) and a smaller and later contralateral N1 compared to invalid trials. Attentional focusing modulated only the amplitudes of the P1 component, with precisely cued trials eliciting a larger dP1 (dorsal P1) than less precisely cued trials at both contralateral and ipsilateral sites. Thus, both attentional orienting and focusing modulate early stimulus processing stages that overlap in time, but with dissociable effects on the scalp distribution of these components, indicating possibly different underlying mechanisms. In addition, the results support the notion that voluntary and involuntary allocations of visuospatial attention are mediated by different underlying neural processes.
Keywords: Event-related potentials (ERPs), Visual attention, Focusing, orienting, Peripheral cues, Cue size effect, Cue validity effect
1. Introduction
The human visual system can both orient and focus attention to a restricted region of visual space so that the perception of the stimuli within that area is facilitated [9,27,42]. However, the relation between these two processes is not fully understood, particularly when attention is involuntary. A processing benefit from a precue to target location – a cue validity effect – has been consistently observed. This effect shows that responses are faster and/or more accurate for valid (i.e., the target location is predicted by the cue) than for invalid trials (i.e., the target appears at an uncued location) [37], possibly because disengagement and shifting processes of visuospatial attention are involved during invalid trials, in addition to the engagement of attention in valid trials [44]. The cue validity effect can be induced by peripheral cues that draw attention involuntarily, or by central, symbolic cues which direct attention voluntarily [5,22]. The overall effects of both types of cue on performance are similar, although their underlying mechanisms are different [45].
In addition to the ability to orient and shift attention in space, people can also adjust the size of the focus of attention. The attentional focus has been likened to a “zoom lens” [14] in which processing efficiency declines as the area to be attended increases [13]. This decline in efficiency has been termed a cue size effect of visuospatial attention in visual detection and discrimination tasks [3,4,49], or a scaling effect of visuospatial attention in visual search tasks [17-19]. Typical cue size or scaling effects indicate that a larger distribution or focus of attention in space slows processing relative to a smaller focus.
In the present study, we use the term “orienting” to refer to the ability to move the attentional focus in visual space, and “focusing” to refer to the ability to adjust the size of the attentional focus in the space. Furthermore, “involuntary” refers to reflexive processes elicited by peripheral cueing with a short cue-to-stimulus onset asymmetry (SOA); “voluntary” refers to the processes elicited by either central cueing or peripheral cueing with a long cue-to-stimulus SOA. According to these definitions, previous studies have revealed that the orienting of visuospatial attention, as indicated by the cue validity effect, can be elicited in both an involuntary and a voluntary manner [5,37]. Similarly, the focusing of visuospatial attention, as indicated by the cue size effect, can also be elicited in both an involuntary ([33,49] experiments 3 and 4) and a voluntary fashion ([17,49] experiments 1 and 2).
Despite these similarities, there is some evidence that attentional focusing is distinct from orienting. First, focusing can take place without orienting, whereas orienting may simultaneously activate focusing [4,49]. For example, the abrupt onset of cues can attract attention and change the focus size inside or just outside the attentional focus, without the process of orienting [49]. Second, strong focusing of attention in one visual field can inhibit orienting when the abrupt stimulus onset appears at another part of the visual field [48,50,54]. Third, orienting of visuospatial attention can be triggered by both stimulus onset and offset [48], whereas focusing can be triggered only by onsets but not offsets [49], suggesting that some mechanisms that trigger orienting cannot trigger focusing.
It has been suggested that the processing components of orienting and focusing of voluntary visuospatial attention are deployed independently in visual search tasks, depending on task demands [18]. However, it is unclear whether this also applies to involuntary visuospatial attention. Single-unit and brain imaging studies have shown that voluntary orienting of visuospatial attention modulates stimulus processing in extrastriate cortex [29,36], and possibly striate cortex (for a review, see Ref. [43]). The neural regions responsible for involuntary orienting of visuospatial attention have been less well investigated using these methods. As to the focusing of visuospatial attention, a recent functional imaging study found that the magnitude of the activation in striate and extrastriate cortex increased, and the extent of the activation decreased, as the focus size constricted voluntarily [38].
The event-related potential (ERP) method provides a good tool for investigating neural events due to its millisecond-level temporal resolution. The voluntary orienting of attention facilitates visual processing by modulating the early P1 component, which reflects neural activity in extrastriate cortex, as well as the later N1 component [6,7,11,23,24,32,34,39]. Involuntary orienting of attention elicited by peripheral cueing has also been found to modulate visual processing in extrastriate cortex, but with different modulations of the latency and amplitude of the P1 and N1 components [16,26,28], suggesting that voluntary and involuntary attentional orienting are mediated by different neural processes.
In previous work we observed that orienting of visuospatial attention elicited by peripheral cues modulated the P1 and N1 ERP components. More specifically, we found that the contralateral P1 was larger, and the contralateral N1 was smaller, for valid compared to invalid trials [16]. Meanwhile, Luo et al. provided ERP evidence of the mechanisms of attentional focusing by systematically manipulating the cue size of peripheral cues [30]. Luo et al. observed that a less precisely cued target (large cue) elicited a larger P1 and a smaller N1 than a more precisely cued target (small cue). Therefore, both attentional orienting and attentional focusing via peripheral cues have been found to elicit a larger P1 but a smaller N1 [16,30], suggesting that these two processes are initiated at similar time points after stimulus onset and have similar ERP modulations in the early stage of processing. Thus, although the behavioral evidence reviewed above suggests that orienting and focusing of visuospatial attention are distinct processes, the psychophysiological evidence is less clear.
Using ERPs, the present study examined the underlying mechanisms of orienting and focusing of involuntary visuospatial attention and the relationship between these mechanisms. Orienting was measured as the cue validity effect elicited by peripheral location cues, whereas focusing was measured as the cue size effect arising from the manipulation of the size of the peripheral cues. We addressed three questions regarding the timing and independence of attentional orienting and focusing: (1) Can a cue size effect be elicited under experimental conditions which can elicit a peripheral cue validity effect? That is, can attentional focusing occur under the same conditions optimal for involuntary attentional orienting? (2) Can a cue validity effect be modulated by the size of peripheral cues, or can a cue size effect be modulated by the validity of the peripheral cues? That is, what is the relationship between attentional orienting and focusing? (3) Are orienting and focusing of visuospatial attention dissociable processes, or they do share the same underlying neural mechanisms? We reasoned that similar orienting-related and focusing-related ERPs point to similar underlying neural processes, whereas different ERP manifestations indicate two dissociable processes.
2. Method
2.1. Participants
Seventeen healthy participants (9 male) participated as paid volunteers. One male participant’s data were excluded from data analyses because of uncontrollable eye blinks. Participants were between 18 and 32 years of age (mean age of 24.1 years), right-handed, and had normal or corrected to normal vision. They reported no history of neurological illness. Informed consent was obtained.
2.2. Stimuli
A fixation cross (0.5° × 0.5°) was presented at the center of the monitor (black on white) throughout the whole block. Each search array (3.06° × 3.44°; Fig. 1, last panels) appeared randomly at the left or right side of the screen, with its center 6.02° lateral to and 2.63° above the fixation cross. The search array consisted of four lines: two horizontal, one vertical, and one diagonal. The diagonal line was the target on all trials. One line appeared in each quadrant of the array, and the two horizontal lines were always in opposite corners. The target diagonal line could appear in any of the four quadrants. The orientation of the diagonal line could be backward (“\”) or forward (“/”), with a probability of 10% and 90%, respectively. Therefore, 90% of the search arrays were standard stimuli, whereas 10% of the arrays contained the target. Prior to the presentation of the search array, a peripheral cue consisting of four small dots (with each dot subtending 0.24° × 0.24° of visual angle, Fig. 1) arranged in a virtual rectangle flashed randomly in either the left or the right visual hemi-field. Half of the cues were big (with the illusory rectangle created by the four dots subtending 3.82° × 4.30°) and were centered at one of the same two locations at which the search array could be centered. The cues for the other half were small, subtending 1.15° × 1.34° visual angle. When the small cue and the subsequent search array appeared on the same side, the cue predicted the precise location of the diagonal line with 100% accuracy. When the small cue and the subsequent search array appeared on opposite sides of fixation, the cue predicted the quadrant of the diagonal line with 100% accuracy but, like the large cue, was inaccurate in regards to which side of fixation the array would appear. In other words, both small and large cues were uninformative as to the location of the search array, but the small cues were highly informative as to where the potential target line would appear relative to the other lines in the array. The purpose of this design was to testify the cue size effect in the context of the cue validity effect and their relationship. The durations of the cues and the stimuli were 50 and 200 ms, respectively, and the cue disappeared before the array appeared. The cue-to-stimulus onset asynchrony (SOA) ranged between 100 and 300 ms, and the intertrial interval (ITI) ranged between 1300 and 1800 ms.
Fig. 1.
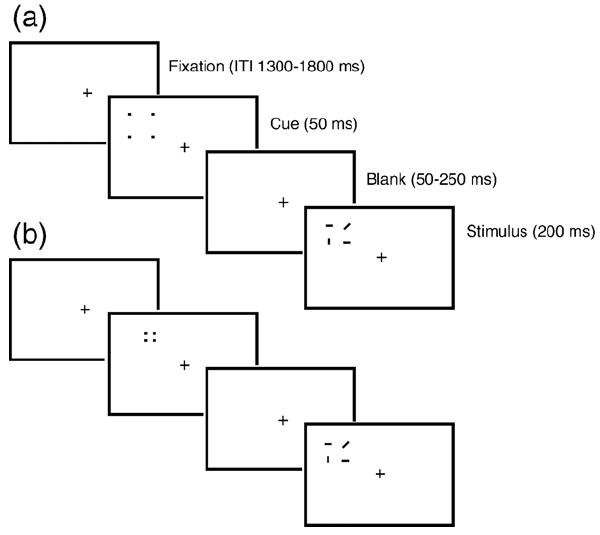
Schematic illustration of the procedure for the present study. The cues consisted of four small dots that formed an imaginary rectangle. The size of the cues could be large (a) or small (b). The search array consisted of two horizontal lines, one vertical line and one diagonal line. The large valid cues covered the whole search array (a), whereas the small valid cues covered only the quadrant containing the diagonal line (b). On 50% of trials, the search array appeared at the same side as the cue. Cues and search arrays could appear either to the left or to the right of fixation with equal probability. Invalid trials are not shown here; however, they were identical to valid trials except that the cue and the search array appeared on opposite sides of the screen from one another.
2.3. Procedure
Participants were required to fixate the cross and minimize eye blinks and body motion during all experimental blocks. They were instructed to discriminate the orientation of the diagonal line but to respond only to the backward line (the target stimulus, 10% of trials) by pressing a key on a NeuroScan Stimpad using their right thumb. This ratio of targets to non-targets allowed a sufficient number of target present trials (10%) to assess behavioral performance while leaving the majority of trials (i.e., correctly identified non-target trials) uncontaminated by manual responses that could confound analysis of the ERP data. Both response accuracy and speed were emphasized. Each block consisted of 40 trials. In total 32 blocks were presented in random order for each subject. Short breaks were allowed between blocks, and the length of breaks was controlled by the participants.
2.4. EEG recording
STIM and SCAN software packages (NeuroScan, Texas, USA) were used to present stimuli and to record and analyze EEG data. Thirty-two channels of EEG and EOG were recorded from the scalp with an electrode cap. Standard 10–20 sites were FP1, FP2, FZ, F3, F4, F7, F8, CZ, C3, C4, PZ, P3, P4, O1, O2, T3, T4, T5, and T6 (American Electrophysiological Society, 1991). EEG from the left mastoid was also recorded, with the right mastoid serving as a reference. Additional electrodes were CP1/CP2 (halfway between PZ and C3/C4), OL/OR (halfway between O1/O2 and T5/T6), OZ (occipital midline electrode 2/3 off PZ on the PZ-inion line), O1′/O2′ (halfway between OZ and O1/O2), and TP5/TP6 (halfway between T5/T6 and T3/T4). Horizontal eye movements (HEOG) were monitored by placing two electrodes lateral to the left and right orbits. Vertical eye movements (VEOG) and eye blinks were measured by placing two electrodes 1.5 cm below and above the left eye. The EEG from each electrode site was digitized at 500 Hz and was filtered with a band-pass of 0.1–40 Hz. 200 ms of pre-stimulus EEG was used as a baseline.
2.5. Data analysis
Prior to averaging the EEG, artifact rejection was performed to discard epochs contaminated by eye blinks, body movements, and muscle activity. The rejection criterion was a negative or positive change of more than 75 μV. ERPs for the cues and search arrays were averaged from the time point of their onset. The EEGs for target arrays (10%) were not included for averaging. The ERP overlap between the cues and the search arrays was removed by using the ADJAR algorithm [47,51]. Peak amplitudes and peak latencies were used for statistical analyses. Behavioral data were analyzed by means of repeated measures analysis of variances (ANOVAs) with three factors: cue validity (valid or invalid), cue size (big or small), and visual field (left or right). For electrophysiological data analysis, the hemisphere (left or right) factor was also included. The ranges for defining P1 and N1 peak latency and amplitude were 90–160 and 140–220 ms, respectively. The statistical results from ANOVAs performed on parietal (P3/P4), occipital (O1/O2), occipito-temporal (OL/OR), and temporal (T5/T6) sites are reported. TANOVA [46] from the LORETA package [40,41] was used to test the dissimilarity between the ERP maps of the attentional focusing and orienting effects across all 32 electrode sites.
3. Results
3.1. Behavioral measures
Participants missed 10.45% of the targets, and their mean false alarm rate was 1.16%. As shown in Fig. 2, participants responded faster to valid than to invalid targets [662 vs. 703 ms, F(1,15) = 17.444, P < 0.001]. In contrast to previous studies manipulating precue size [3,4,18,19], participants responded moderately faster to the targets preceded by large cues than to those preceded by small cues [669 vs. 697 ms, F(1,15) = 14.144, P < 0.002]. No other main effects or interactions were significant. Hence, the classic cue validity effect was replicated, whereas a negative cue size effect was observed in the present study.
Fig. 2.
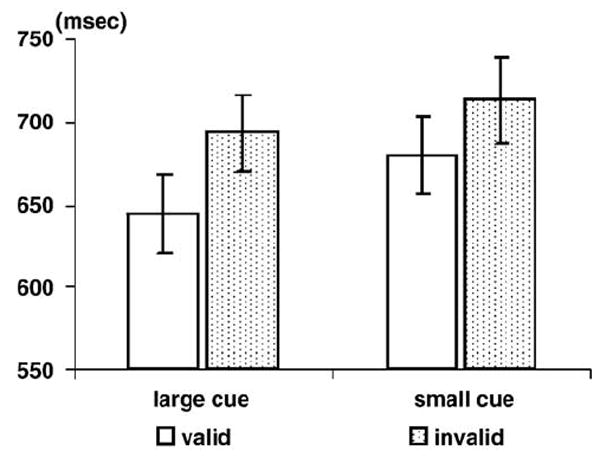
The mean reaction times (RTs) and standard errors for the targets as a function of cue validity and cue size.
3.2. ERP measures
3.2.1. ERPs elicited by the cues
For the amplitude of the P1 component, the visual field × cue size interaction was significant at the posterior electrode sites [P3/P4: F(1,15) = 10.80, P < 0.005; and OL/ OR: F(1,15) = 6.93, P < 0.019]. Large cues elicited a larger P1 than small cues when the stimuli appeared in the right visual field [P3/P4: F(1,15) = 12.89, P < 0.003].
For the N1 component, the contralateral N1 amplitude was affected by the cue size (Fig. 3). The visual field × cue size × hemisphere interaction was significant at the posterior electrode sites [P3/P4: F(1,15) = 12.12, P < 0.003; T5/T6: F(1,15) = 12.38, P < 0.003; and OL/OR: F(1,15) = 18.59, P < 0.001]. The cue size main effect was significant at contralateral temporal [T5/T6: F(1,15) = 7.80, P < 0.014] and occipito-temporal sites [OL/OR: F(1,15) = 7.09, P < 0.018] but not at the corresponding ipsilateral sites [T5/T6: F(1,15) = 1.34, P < 0.259; OL/OR: F(1,15) = 3.48, P < 0.082].
Fig. 3.
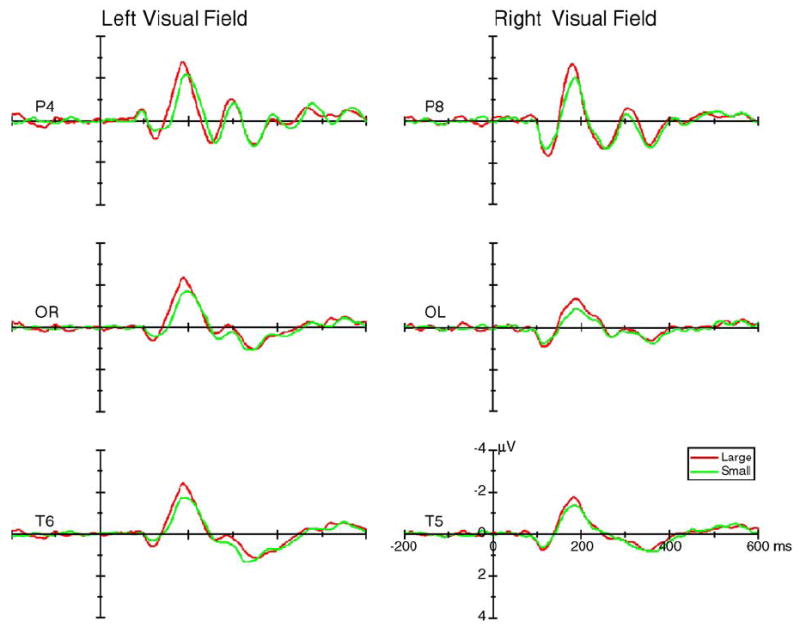
The grand average of ERPs (across 16 subjects) elicited by the large (red lines) and small cues (green lines) at the posterior contralateral sites when the cues appeared in the left (left column) and right (right column) visual field. Data were averaged across valid and invalid cues.
3.3. ERPs elicited by the standard stimuli
3.3.1. P1
3.3.1.1. Cue validity effect
The posterior contralateral P1 was larger for valid trials, whereas the ipsilateral P1 was larger for invalid trials, as indicated by significant visual field × validity × hemisphere interactions in the parietal [P3/P4: F(1,15) = 39.40, P < 0.0005], occipito-temporal [OL/OR: F(1,15) = 67.70, P < 0.0005], and temporal [T5/ T6: F(1,15) = 71.32, P < 0.0005] electrode sites (Fig. 4). These cue validity effects were apparent in both large cue and small cue conditions and could be seen more clearly after averaging across cue sizes (Fig. 5). The mean voltage and the statistical results of the cue validity effects on the contralateral and ipsilateral P1 component are shown in Figs. 6a and b. The scalp voltage distribution of the cue validity effect on the P1 component is shown in Fig. 7 (upper panels).
Fig. 4.
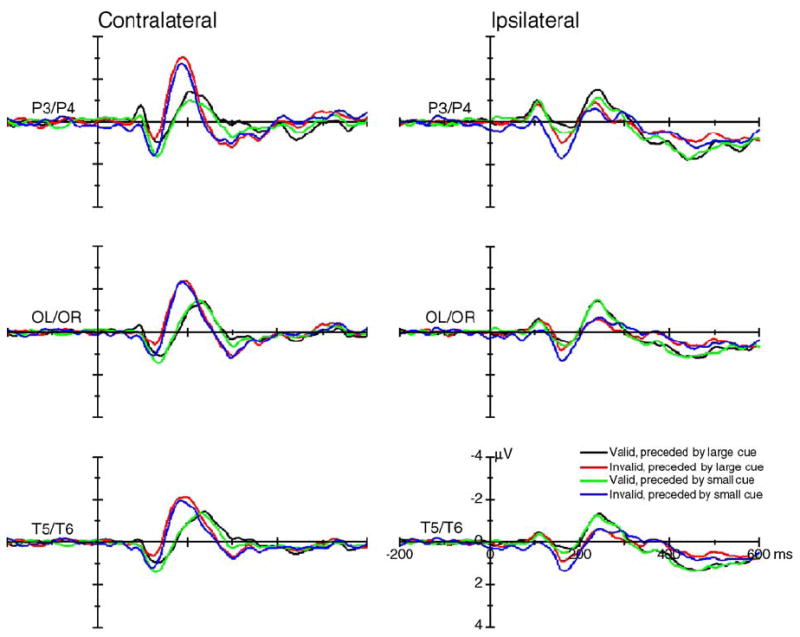
The grand average of ERPs (across 16 subjects) elicited by standard stimuli at the posterior contralateral (left column) and ipsilateral (right column) sites. Data were averaged across visual field and hemisphere.
Fig. 5.
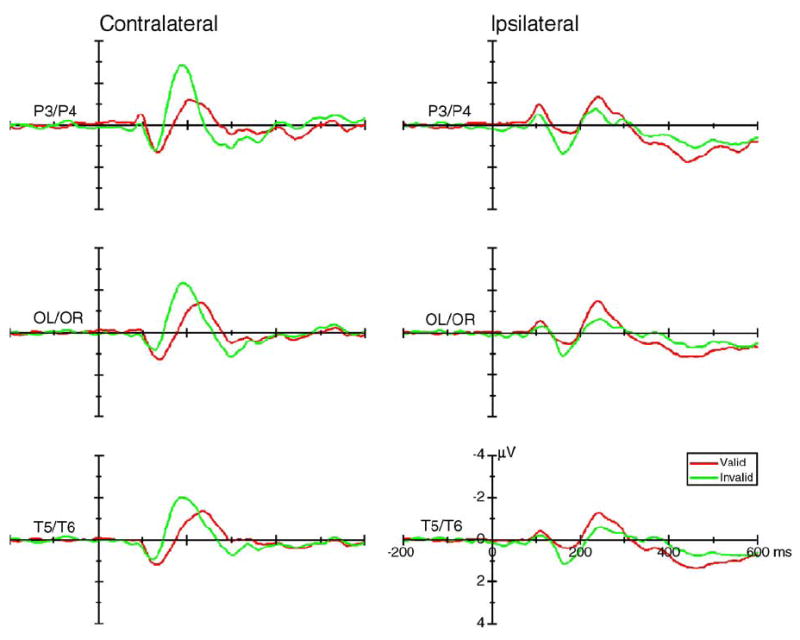
The grand average of ERPs (across 16 subjects) elicited by the valid (red lines) and invalid (green lines) stimuli at the contralateral (left column) and ipsilateral (right column) recording sites. Data were averaged across visual field, hemisphere, and cue size.
Fig. 6.
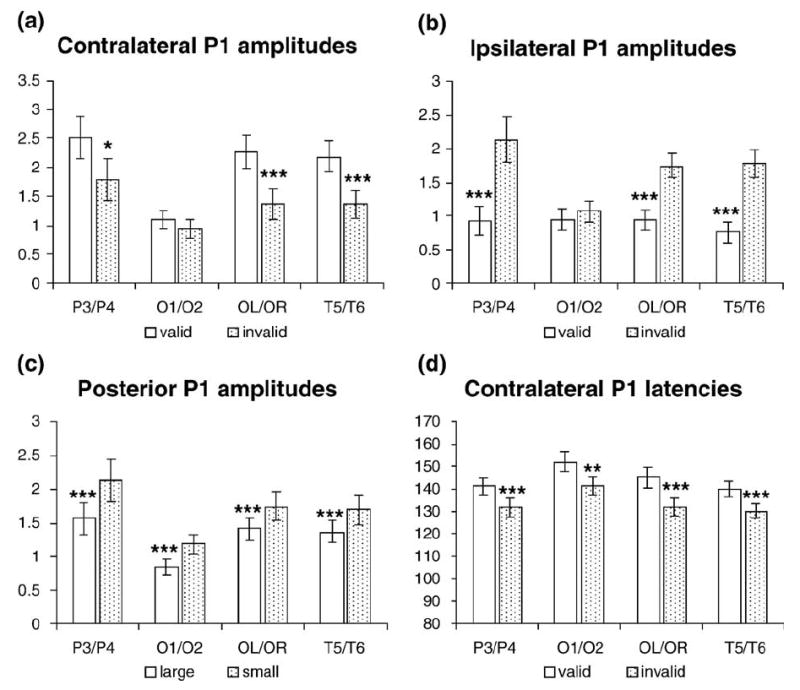
The mean voltages and peak latencies of the cue validity effects and cue size effects on the P1 components, along with the statistical results (*P < 0.05; **P < 0.005; ***P < 0.001). (a) The cue validity effects on the amplitude of contralateral P1; (b) the cue validity effects on the amplitude of ipsilateral P1; (c) the cue size effects on the amplitude of posterior P1; (d) the cue validity effects on the latency of contralateral P1.
Fig. 7.
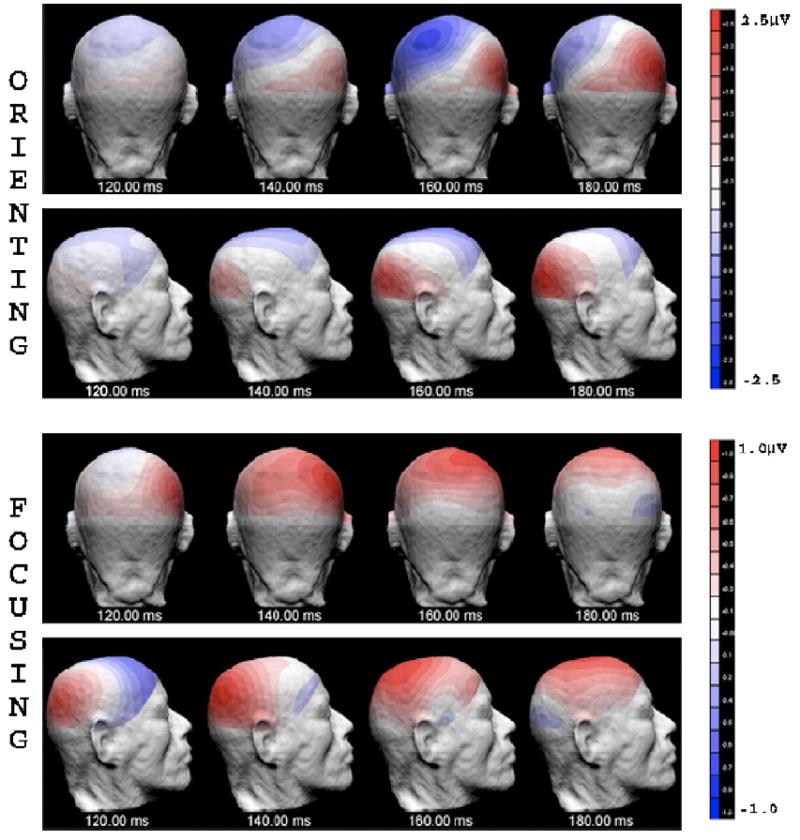
The 3D scalp voltage distribution of the orienting-related ERP (cue validity effect, obtained by subtracting ERPs of the invalid condition from ERPs of the valid condition), and the focusing-related ERP components (cue size effect, obtained by subtracting ERPs of the large valid cue condition from ERPs of the small valid cue condition), when the target array appeared in the left visual field. Data for orienting were averaged across small cue and large cue conditions. Only the ERPs of valid trials for the small and large cue conditions were used regarding the subtraction for focusing-related component. Data are shown in back view and right view of the head, every 20 ms from 120 to 180 ms after the onset of search array. Note that the focusing-related ERP had a more dorsal distribution as compared with a more ventral distribution of the orienting-related ERP at 140 ms (the P1 time range).
The P1 latency analyses showed that valid trials elicited a later P1 than the invalid trials, as suggested by a significant validity main effect [O1/O2: F(1,15) = 6.46, P < 0.023; and OL/OR: F(1,15) = 8.50, P < 0.011] (Fig. 6d). This latency change was more obvious at the contralateral sites, as shown by a significant visual field × validity × hemisphere interaction [P3/P4: F(1,15) = 26.77, P < 0.0005; OL/OR: F(1,15) = 25.68, P < 0.0005; and T5/ T6: F(1,15) = 14.18, P < 0.002]. The contralateral P1 was earlier than the ipsilateral P1 in posterior electrode sites, as suggested by significant visual field × hemisphere interactions [P3/P4: F(1,15) = 76.93, P < 0.0005; OL/OR: F(1,15) = 50.48, P < 0.0005; and T5/T6: F(1,15) = 50.52, P < 0.0005]. The interaction between validity and cue size was significant.
3.3.1.2. Cue size effect
The arrays preceded by small cues elicited a larger P1 than those preceded by large cues, as indicated by a significant cue size main effect at occipital [O1/O2: F(1,15) = 19.36, P < 0.001], occipito- temporal [OL/OR: F(1,15) = 20.17, P < 0.0005], temporal [T5/T6: F(1,15) = 27.83, P < 0.0005], and parietal [P3/P4: F(1,15) = 16.31, P < 0.001] sites (Figs. 4 and 6c). The interaction between cue size and validity was not significant. The scalp voltage distribution of the cue size effect on the P1 component is shown in Fig. 7 (bottom panels). The validity effect and the size effect showed different patterns of hemisphere distribution in response to the laterally presented stimuli, as suggested by a significant visual field × validity × size × hemisphere interaction [OL/OR: F(1,15) = 5.46, P < 0.034].
The P1 latency analysis showed no significant main effect of cue size or related interactions.
3.3.2. N1
3.3.2.1. Cue validity effect
The validity main effect on N1 was significant at parietal sites [P3/P4: F(1,15) = 6.71, P < 0.021] (Figs. 4 and 5, upper row), with a larger amplitude for invalid than for valid trials. There was a significant visual field × validity × hemisphere interaction in posterior sites [O1/O2: F(1,15) = 4.67, P < 0.047; P3/P4: F(1,15) = 31.21, P < 0.0005; OL/OR: F(1,15) = 23.80, P < 0.0005; and T5/T6: F(1,15) = 32.41, P < 0.0005], suggesting that the contralateral N1 was larger for invalid trials, whereas the ipsilateral N1 was larger for valid trials (Figs. 9a and b). The visual field × hemisphere interaction was also significant in posterior electrode sites [P3/P4: F(1,15) = 33.39, P < 0.0005; OL/OR: F(1,15) = 27.68, P < 0.0005; and T5/T6: F(1,15) = 27.82, P < 0.0005], suggesting that the contralateral N1 was larger than the ipsilateral N1 (Figs. 5, 8, and 9).
Fig. 9.
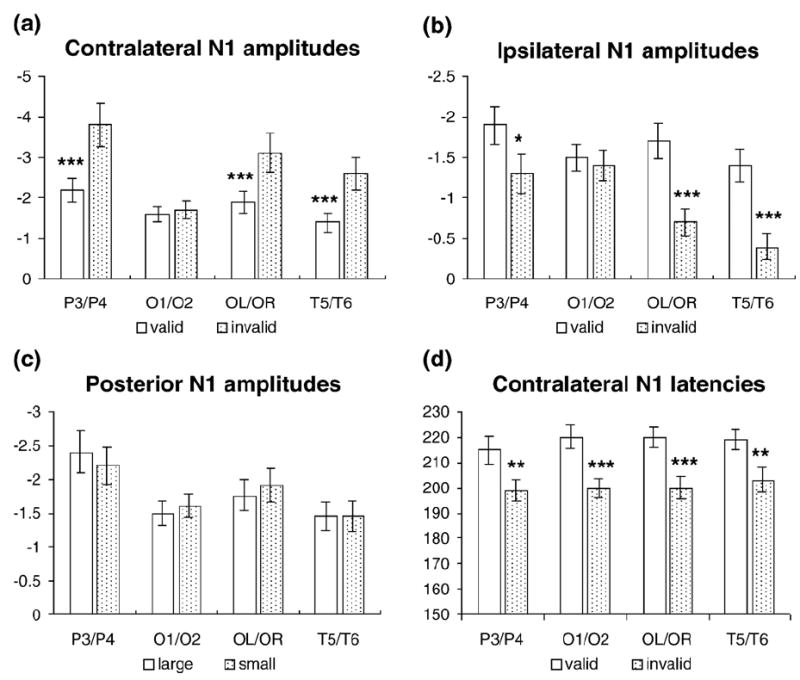
The mean voltages and peak latencies of the cue validity effects and cue size effects on the N1 component, along with the statistical results (*P < 0.05; **P < 0.005; ***P < 0.001). (a) The cue validity effects on the amplitude of contralateral N1; (b) the cue validity effects on the amplitude of ipsilateral N1; (c) the cue size effects on the amplitude of posterior N1; (d) the cue validity effects on the latency of contralateral N1.
Fig. 8.
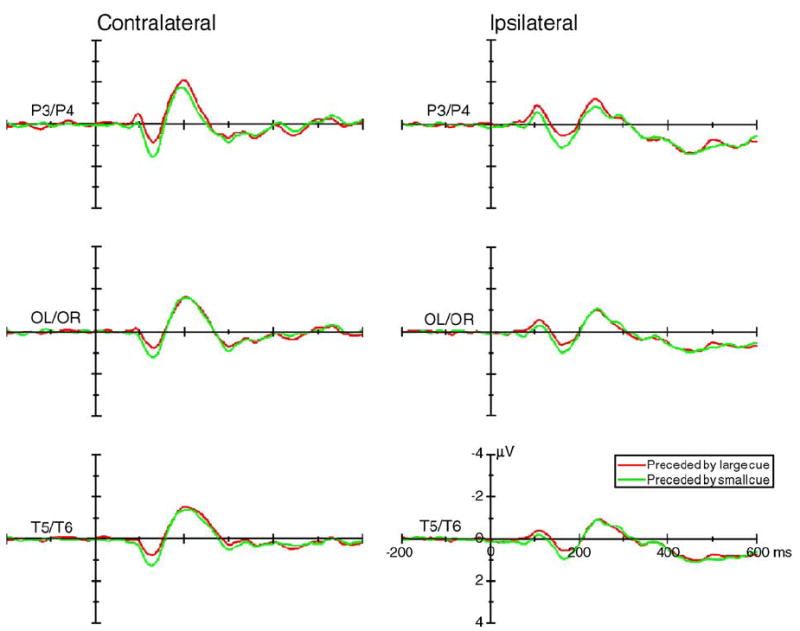
The grand average of ERPs (across 16 subjects) elicited by stimuli that were preceded by large cues (red lines) and by small cues (green lines) at the posterior contralateral (left column) and ipsilateral recording sites (right column). Data were averaged across visual field, hemisphere, and cue validity.
The N1 latency analysis showed that valid trials elicited a later N1 than the invalid trials, as suggested by significant validity main effects [OL/OR: F(1,15) = 13.70, P < 0.002]. This latency change was more pronounced at the contralateral sites, as shown by significant visual field × validity × hemisphere interactions [P3/P4: F(1,15) = 31.02, P < 0.0005; O1/O2: F(1,15) = 4.99, P < 0.041; OL/OR: F(1,15) = 16.81, P < 0.001; and T5/T6: F(1,15) = 24.23, P < 0.0005] (Fig. 9d). The contralateral N1 was earlier than the ipsilateral N1 in the posterior sites, as suggested by significant visual field × hemisphere interactions [P3/P4: F(1,15) = 10.06, P < 0.006; O1/O2: F(1,15) = 4.59, P < 0.049; OL/OR: F(1,15) = 27.10, P < 0.0005; and T5/T6: F(1,15) = 12.00, P < 0.003]. The visual field × validity interaction was significant at the parietal sites [P3/P4: F(1,15) = 7.05, P < 0.018].
3.3.2.2. Cue size effect
Only the main effect of cue size was significant [P3/P4: F(1,15) = 6.71, P < 0.021; and OL/OR: F(1,15) = 8.43, P < 0.011] (Figs. 4 and 8, upper row; Fig. 9c). No other significant interaction related to the cue size was found.
The N1 latency analysis showed no significant main effect of cue size or related interactions.
3.3.3. Scalp distribution map
We also tested the dissimilarity of scalp distribution map [40,41,46] between the attentional orienting and attentional focusing based on the difference waves obtained. The ERPs for attentional orienting were obtained by subtracting ERPs for invalid trials from ERPs for valid trials, and the ERPs for attentional focusing were obtained by subtracting ERPs for stimulus preceded by large cues from ERPs for stimulus preceded by small cues. The results confirmed the observation in Fig. 7 that there was a significant difference between the processes of attentional orienting and focusing at the time range between 120 and 160 ms [ P < 0.003 and P < 0.017, for LVF and RVF stimuli, respectively].
4. Discussion
The present study used event-related potentials to investigate the neural mechanisms of orienting and focusing of visuospatial attention in a peripheral cueing task. More specifically, we sought to determine whether a single involuntary attentional mechanism can account for both cue validity and cue size effects, or alternatively whether these effects represent the operation of distinct cognitive and neural processes. Response time measures replicated the typical cue validity effect but surprisingly revealed a negative cue size effect, with longer RTs for the targets preceded by smaller cues. For ERP measures, we used a jittered SOA and applied the ADJAR algorithm [47,51] to all the ERP data, which should have minimized the overlap of ERPs between the cue and the search array. The early P1 and N1 ERP components were modulated by both visuospatial orienting and focusing, suggesting that the early involuntary processes elicited by the peripheral cues with the short SOA used here may subserve both of these functions.
4.1. The orienting of visuospatial attention
The behavioral results confirmed the well-established cue validity effect, with participants responding faster to valid relative to invalid trials, confirming that peripheral cues attracted attention, even though the cues were uninformative of the target location. Consistent with our previous study [16], the present study found modulation of the amplitude and latency of both P1 and N1 by the location validity of peripheral cues. Valid trials elicited a larger and later contralateral P1 and a smaller and later contralateral N1 relative to invalid trials, irrespective of the size of peripheral cues. Furthermore, the uninformative nature of the cues used in the present study makes a possible voluntary attentional allocation explanation due to participants’ knowledge of high cue validity less likely (e.g., 75% cue validity in Ref. [16]), although it is still possible that the voluntary allocation of attention and/or arousal effects might be larger for search arrays preceded by small cues, because the small cues were more accurate than large cues concerning the exact quadrant where the target element occurs.1
These involuntary attentional effects differed from the voluntary attentional effects observed previously in sustained attention and central cueing tasks [1,7,10,15,25,31] in both the timing and magnitude of the early P1 and N1 components. In the previous studies cited above, the amplitude of P1 and/or N1 to attended stimuli was enhanced without a change in latency. The different results of the present study using dynamic, peripheral cueing could indicate different underlying neural mechanisms of peripheral cueing tasks, presumed to elicit involuntary attentional processes, and central cueing or sustained attention tasks in the previous studies, presumed to elicit voluntary attentional processes [12,28,52,53]. Because this is a cross-study comparison between the present involuntary attention task and previous voluntary attention tasks, more decisive evidence for a dissociation between voluntary and involuntary attention awaits a design comparing these two forms of attention directly in one study [8]. Moreover, it is possible that the activity related to disengaging and shifting processes differs in timing and strength between voluntary and involuntary visuospatial attention. If so, then the ERP components related to these processes may overlap in the P1 and N1 range, and they may change the manifestation in the P1 and N1 range as compared with previous voluntary attention tasks.
It could also be argued that the ERP difference between valid and invalid trials may not necessarily reflect distinctive attention-sensitive processes in peripheral cueing tasks because of potential cue–stimulus interactions between valid and invalid trials that would not occur in voluntary attention tasks. For example, one can argue that valid trials may have elicited a smaller N1 relative to invalid trials, due to sensory adaptation; this effect on N1 could have overlapped the late portion of the P1, with the larger N1 for invalid trials apparently canceling out the late portion of the P1 and resulting in the P1 appearing smaller for invalid than for valid trials.2 Such low-level interactions between the cue and the target as adaptation or refractory effects, however, predict inhibitory effects to valid relative to invalid trials and therefore cannot explain the fact of larger contralateral P1 and short response times for valid compared to invalid trials. Similarly, one could argue that the response to a stimulus preceded by a large cue was of lower amplitude than the response to a stimulus that was preceded by a small cue because larger cues lead to greater adaptation than small cues.2 However, this is inconsistent with the RT data showing faster RTs for search array preceded by large relative to small cues. Also because large and small cues have exactly the same physical strength (composed of four dots), it is not convincing that large cues lead to greater adaptation than small cues. Rather, the opposite is true, i.e., that the small cues lead to greater adaptation because the dots are physically closer to the target element in the display. Furthermore, there is no evidence that suggests sensory adaptation and/or refractoriness would affect only the later N1 component but not the earlier and more exogenous-like P1 component. Therefore, low-level sensory interactions between the cue and the search array are possible limitations for the present study, but these effects alone cannot account for the present results. One previous study used stimulus offset rather than onset as the peripheral cue and observed attentional effects only on the P1 component, which seems to be unaffected by sensory adaptations [26].2 However, further studies will be needed to test the contribution of these low-level interactions, or to minimize these effects.
The possible ERP overlap by disengage and shift processes for invalid trials could also account for the apparent inconsistency between the ERP and behavioral results showing later P1 peak latency but faster responses to valid relative to invalid trials, because the peaks and amplitudes of the P1 component might have been contaminated by this overlap. An alternative is that the later and larger P1 reflects allocation of more attentional resources at the early stage of processing, which might have facilitated the processing at the “intermediate” stage, such as stimulus categorization and evaluation, and therefore yielded faster responses at late stages of processing. This might be because the similar early processing for valid and invalid trials have been interrupted prematurely during invalid trials, presumably because of the shifting of attentional focus from cued location to the new location of search array.
4.2. The focusing of visuospatial attention
In contrast with previous work, in the present study we observed a negative cue size effect in which participants responded more slowly to targets preceded by small cues than to targets preceded by large cues. Such a negative cue size effect, although atypical, has been reported in previous studies when the display size varied unpredictably, or when cues were invalidly located; under such conditions of unpredictability, a broader attentional focus is optimal, so that response time is reduced with larger than with smaller cues [17,18]. Consistent with this proposal, it is possible that the unpredictability induced by the 50% cue validity in the present study might have biased participants to adopt a broader attentional focus that favored target discrimination in the large cue condition. Another possible explanation for the negative cue size effect is a stronger masking effect at the target location induced by small cues than by larger cues. We will discuss several other possible accounts for this negative cue size effect.
First, the traditional, positive cue size effect may not be present or may occur to a lesser extent in involuntary attention tasks, such as the one used here. Previous studies have shown that voluntary focusing might take longer than 100–300 ms (the SOA used in the present study) to develop [18,19] and that cue size effects in visual search tasks increase with SOA from 100 to 500 ms [17]. Castiello and Umilta observed a cue size effect with a 500-ms SOA, but not a 40-ms SOA, although a cue validity effect was seen at the shorter SOA [3]. This suggests that the positive cue size effect might develop more slowly (however, see Ref. [33]).
Second, participants might have had difficulty maintaining their attentional focus at an empty location [4,49] because the cue disappeared after 50 ms in the present study. In previous studies that observed a positive cue size effect, the precue usually remained on the screen during presentation of the search array ([3,4], experiments 1, 3, and 4, [30,35,38]). Some studies have reported cue size effects with the cue turned off before the search array [18], or with a cue and search array gap [4 (experiment 2a), 18 (experiment 2)]. However, the cues used in these studies were more conspicuous than the relatively faint cues in the present study.
Finally, the onset of the search array might have automatically attracted participants’ attention to the overall configuration of the search array, overriding the focusing of attention generated by small valid cues. A study by Carrasco and Yeshurun supports this view [2]. They found a significant effect of array size with a 100% valid cue that drew attention to only a single array element (target) location. Studies using the global/local task have also found that the onset of a search array may invoke an automatic expansion of the attentional focus to the size of the array as a whole [20]. This might account for the negative cue size effect in the present study—for the small valid cue condition, an additional adjustment of the attentional focus from the size of the search array to the size of the target element might have been necessary in order to perform the task relative to the large valid cue condition.
The ERP results also showed a negative cue size effect, with the precisely cued trials (i.e., trials with the small cue size) eliciting a larger contralateral P1 than the less precisely cued trials. This ERP result seems to be inconsistent with the previous observation that P1 amplitudes increased with cue size, i.e., a positive cue size effect on ERPs [30]. This discrepancy between these two studies might be reconciled in terms of the amount of attentional effort needed to perform the task. In both studies, the stimuli with the slower RT (harder task) elicited a larger contralateral P1, indicating that this P1 modulation was related to increased attentional effort, or increased computation using the terms of Luo et al. [30]. We hypothesize that the amplitude of the P1 component could be an index of the amount of attentional effort allocated to perform the task. This proposal is supported by results from several studies. First, Hopfinger and Mangun observed that P1 amplitude was larger and RT was faster for the attended stimuli when the cue-to-stimulus SOA was short [26]. On the other hand, the RT facilitation by cue validity disappeared, and P1 became smaller for the attended stimuli, when the SOA was long, probably because attentional effort to the cued spatial location was decreased by inhibition of return (IOR) in the long cue-to-stimulus SOA condition. Second, Handy and Mangun (2000) found that the expectancy effect (cued vs. uncued, i.e., cue validity effect) in the P1 component increased with the perceptual load of the task (experiment 1), suggesting a close relationship between the P1 amplitude and attentional effort or perceptual difficulty. Finally, in a global/local task, Han et al. observed that subjects responded faster to a local target preceded by a local target than to a local target preceded by a global target [21]. Moreover, they found that P1 was larger for a local target preceded by a global target (harder task) than for a local target preceded by a local target (easier task), supporting our proposed link between the amplitude of P1 and performance.
The present study appears to have observed both the orienting- and focusing-sensitive effects in the time range of the P1 component, as suggested by the cue validity effect and cue size effect on the ERPs, respectively; however, we speculate that there are two different P1 components generated by two different processes on the basis of the significant differences in their scalp distributions. Specifically, the orienting-sensitive P1 (cue validity effect) was positive in the contralateral hemisphere and negative in the ipsilateral hemisphere, and its ventral–occipital voltage distribution is similar to that of the classic P1 modulation by attention [6,23]. In contrast, the focusing-sensitive P1 (cue size effect) was positive in both hemispheres, and its voltage map was distributed relatively more on the dorsal–occipital area. This suggests that the neural generator of the more dorsally distributed P1, dP1, modulated by attentional focusing is different from the more ventrally distributed generator, vP1, modulated by attentional orienting in the present study.1 However, no timing difference was found between these two components, indicating that orienting and focusing of visuospatial attention can both occur at the same time in the early processing stage.
4.3. The relationship between attentional orienting and focusing
Behavioral results showed that participants responded faster to valid than to invalid targets, regardless of cue size. They also responded faster to targets preceded by large cues than by small cues. Moreover, there was no interaction between the cue validity effect and the cue size effect. These behavioral results suggest that attentional shifting and focusing are two separate processes as we proposed previously [18]. The ERP results provide some corroborative evidence. Both cue validity and cue size modulated the amplitude of the P1 component with different hemispheric characteristics and without interaction between them. The cue validity effect of P1 reversed from the contralateral to the ipsilateral hemisphere, whereas the cue size effect of P1 showed the same direction of modulation for both hemispheres regardless of the hemi-field of the stimulus. The scalp distribution maps also showed that the orienting of visuospatial attention elicited a positive activity over contralateral occipito-temporal sites and negative activity over ipsilateral parietal sites, whereas only positive activities were observed for the focusing of visuospatial attention over contralateral occipito-temporal sites, and more dorsal, over parietal sites. Therefore, it is likely that they are two different components at the P1 time range modulated by potentially different underlying mechanisms, with one reflecting an orienting-related process over the ventral areas (vP1, the cue validity effect on P1), and the other reflecting an focusing-related process over the dorsal areas (dP1, the cue size effect on P1).
5. Conclusions
Orienting and focusing have been likened to “reaching and grasping” of the hand when trying to grab hold of an object [49]. This metaphor indicates that these two processes can be deployed independently at the same time, as argued by Greenwood and Parasuraman [17,18]. The present results provide ERP evidence for this view by showing that orienting and focusing begin at roughly the same time at an early stage of visual processing. This suggests the potentially parallel orienting and focusing mechanisms of visuospatial attention with different underlying neural mechanisms.
Acknowledgments
This research was supported by NIH grant AG19653 to RP. Thanks to Greg Young for assistance with data collection and processing. We are grateful to Dr. George R. Mangun and three anonymous reviewers for their valuable comments on an earlier version of this manuscript. Special thanks to Dr. Durk Talsma for providing the software package for the ADJAR algorithm and for helpful suggestions.
Footnotes
We thank an anonymous reviewer for pointing out the possible voluntary attention/arousal account and the dichotomy of dP1 and vP1 and its implication to our present results. The dP1 may not be related to the classic definition of the P1 component. For example, it may be a completely new component overlapping at the P1/N1 time range that can be isolated from the classic P1/N1 component.
We acknowledge a second anonymous reviewer for raising these interesting points.
References
- 1.Anllo-Vento L, Hillyard SA. Selective attention to the color and direction of moving stimuli: electrophysiological correlates of hierarchical feature selection. Percept Psychophys. 1996;58:191–206. doi: 10.3758/bf03211875. [DOI] [PubMed] [Google Scholar]
- 2.Carrasco M, Yeshurun Y. The contribution of covert attention to the set-size and eccentricity effects in visual search. J Exp Psychol Hum Percept Perform. 1998;24:673–692. doi: 10.1037//0096-1523.24.2.673. [DOI] [PubMed] [Google Scholar]
- 3.Castiello U, Umilta C. Size of the attentional focus and efficiency of processing. Acta Psychol (Amsterdam) 1990;73:195–205. doi: 10.1016/0001-6918(90)90022-8. [DOI] [PubMed] [Google Scholar]
- 4.Castiello U, Umilta C. Splitting focal attention. J Exp Psychol Hum Percept Perform. 1992;18:837–848. doi: 10.1037//0096-1523.18.3.837. [DOI] [PubMed] [Google Scholar]
- 5.Cheal M, Lyon DR. Central and peripheral precuing of forced-choiced discrimination. Q J Exp Psychol, A. 1991;43:859–880. doi: 10.1080/14640749108400960. [DOI] [PubMed] [Google Scholar]
- 6.Clark VP, Hillyard SA. Spatial selective attention affects early extrastriate but not striate components of the visual evoked potential. J Cogn Neurosci. 1996;8:387–402. doi: 10.1162/jocn.1996.8.5.387. [DOI] [PubMed] [Google Scholar]
- 7.Clark VP, Fan S, Hillyard SA. Identification of early visual evoked potential generators by retinotopic and topographic analyses. Hum Brain Mapp. 1995;2:170–187. [Google Scholar]
- 8.Doallo S, Lorenzo-Lopez L, Vizoso C, Rodriguez Holguin S, Amenedo E, Bara S, Cadaveira F. The time course of the effects of central and peripheral cues on visual processing: an event-related potentials study. Clin Neurophysiol. 2004;115:199–210. doi: 10.1016/s1388-2457(03)00317-1. [DOI] [PubMed] [Google Scholar]
- 9.Downing CJ. Expectancy and visual–spatial attention: effects on perceptual quality. J Exp Psychol Hum Percept Perform. 1988;14:188–202. doi: 10.1037//0096-1523.14.2.188. [DOI] [PubMed] [Google Scholar]
- 10.Eimer M. Spatial cueing, sensory gating and selective response preparation: an ERP study on visuo-spatial orienting. Electroencephalogr Clin Neurophysiol. 1993;88:408–420. doi: 10.1016/0168-5597(93)90017-j. [DOI] [PubMed] [Google Scholar]
- 11.Eimer M. “Sensory gating” as a mechanism for visuospatial orienting: electrophysiological evidence from trial-by-trial cuing experiments. Percept Psychophys. 1994;55:667–675. doi: 10.3758/bf03211681. [DOI] [PubMed] [Google Scholar]
- 12.Eimer M. The time course of spatial orienting elicited by central and peripheral cues: evidence from event-related brain potentials. Biol Psychol. 2000;53:253–258. doi: 10.1016/s0301-0511(00)00049-1. [DOI] [PubMed] [Google Scholar]
- 13.Eriksen CW, St James JD. Visual attention within and around the field of focal attention: a zoom lens model. Percept Psychophys. 1986:225–240. doi: 10.3758/bf03211502. [DOI] [PubMed] [Google Scholar]
- 14.Eriksen CW, Yeh YY. Allocation of attention in the visual field. J Exp Psychol Hum Percept Perform. 1985;11:583–597. doi: 10.1037//0096-1523.11.5.583. [DOI] [PubMed] [Google Scholar]
- 15.Fu S, Fan S, Chen L. Selective attention to orientation and closure: an event-related potential (ERP) study. Sci China (Series E) 2000;43:232–241. [Google Scholar]
- 16.Fu S, Fan S, Chen L, Zhuo Y. The attentional effects of peripheral cueing as revealed by two event-related potential studies. Clin Neurophysiol. 2001;112:172–185. doi: 10.1016/s1388-2457(00)00500-9. [DOI] [PubMed] [Google Scholar]
- 17.Greenwood PM, Parasuraman R. Scale of attentional focus in visual search. Percept Psychophys. 1999;61:837–859. doi: 10.3758/bf03206901. [DOI] [PubMed] [Google Scholar]
- 18.Greenwood PM, Parasuraman R. The scaling of spatial attention in visual search and its modification in healthy aging. Percept Psychophys. 2004;66:3–22. doi: 10.3758/bf03194857. [DOI] [PMC free article] [PubMed] [Google Scholar]
- 19.Greenwood PM, Parasuraman R, Alexander GE. Controlling the focus of spatial attention during visual search: effects of advanced aging and Alzheimer disease. Neuropsychology. 1997;11:3–12. doi: 10.1037//0894-4105.11.1.3. [DOI] [PubMed] [Google Scholar]
- 20.Han S, Humphreys GW, Chen L. Parallel and competitive processes in hierarchical analysis: perceptual grouping and encoding of closure. J Exp Psychol Hum Percept Perform. 1999;25:1411–1432. doi: 10.1037//0096-1523.25.5.1411. [DOI] [PubMed] [Google Scholar]
- 21.Han S, He X, Woods DL. Hierarchical processing and level-repetition effect as indexed by early brain potentials. Psychophysiology. 2000;37:817–830. [PubMed] [Google Scholar]
- 22.Hawkins HL, Hillyard SA, Luck SJ, Mouloua M, Downing CJ. Visual attention modulates signal detectability. J Exp Psychol Hum Percept Perform. 1990;16:802–811. doi: 10.1037//0096-1523.16.4.802. [DOI] [PubMed] [Google Scholar]
- 23.Heinze HJ, Mangun GR, Burchert W, Hinrichs J, Scholz M, Munte TF, Goes A, Scherg M, Johannes S, Hundeshagen J, Gazzaniga MS, Hillyard SA. Combined spatial and temporal imaging of brain activity during visual selective attention in humans. Nature. 1994;372:543–546. doi: 10.1038/372543a0. [DOI] [PubMed] [Google Scholar]
- 24.Hillyard SA, Anllo-Vento L. Event-related brain potentials in the study of visual selective attention. Proc Natl Acad Sci U S A. 1998;95:781–787. doi: 10.1073/pnas.95.3.781. [DOI] [PMC free article] [PubMed] [Google Scholar]
- 25.Hillyard SA, Munte TF. Selective attention to color and location: an analysis with event-related brain potentials. Percept Psychophys. 1984;36:185–198. doi: 10.3758/bf03202679. [DOI] [PubMed] [Google Scholar]
- 26.Hopfinger JB, Mangun GR. Reflexive attention modulates processing of visual stimuli in human extrastriate cortex. Psychol Sci. 1998;9:441–447. doi: 10.1111/1467-9280.00083. [DOI] [PMC free article] [PubMed] [Google Scholar]
- 27.LaBerge D. Computational and anatomical models of selective attention in object identification. In: Gazzaniga MS, editor. Cong Neurosci. 1995. pp. 279–290. [Google Scholar]
- 28.Lubbe RHJ, Woestenburg JC. Modulation of early ERP components with peripheral precues: a trend analysis. Biol Psychol. 1997;45:143–158. doi: 10.1016/s0301-0511(96)05226-x. [DOI] [PubMed] [Google Scholar]
- 29.Luck SJ, Chelazzi L, Hillyard SA, Desimone R. Neural mechanisms of spatial selective attention in areas V1, V2, and V4 of macaque visual cortex. J Neurophysiol. 1997;77:24–42. doi: 10.1152/jn.1997.77.1.24. [DOI] [PubMed] [Google Scholar]
- 30.Luo YJ, Greenwood PM, Parasuraman R. Dynamics of the spatial scale of visual attention revealed by brain event-related potentials. Cogn Brain Res. 2001;12:371–381. doi: 10.1016/s0926-6410(01)00065-9. [DOI] [PubMed] [Google Scholar]
- 31.Mangun GR. Neural mechanisms of visual selective attention. Psychophysiology. 1995;32:4–18. doi: 10.1111/j.1469-8986.1995.tb03400.x. [DOI] [PubMed] [Google Scholar]
- 32.Mangun GR, Hillyard SA. Allocation of visual attention to spatial locations: tradeoff functions for event-related brain potentials and detection performance. Percept Psychophys. 1990;47:532–550. doi: 10.3758/bf03203106. [DOI] [PubMed] [Google Scholar]
- 33.Maringelli F, Umilta C. The control of the attentional focus. Eur J Cogn Psychol. 1998;10:225–246. [Google Scholar]
- 34.Martinez A, Anllo-Vento L, Sereno MI, Frank LR, Buxton RB, Dubowitz DJ, Wong EC, Hinrichs H, Heinze HJ, Hillyard SA. Involvement of striate and extrastriate visual cortical areas in spatial attention. Nature Neurosci. 21999:364–369. doi: 10.1038/7274. [DOI] [PubMed] [Google Scholar]
- 35.Mizuno M, Umilta C, Sartori G. Deficits in the control of the attentional focus in chronic schizophrenics. Cortex. 1998;34:263–270. doi: 10.1016/s0010-9452(08)70753-6. [DOI] [PubMed] [Google Scholar]
- 36.Moran J, Desimone R. Selective attention gates visual processing in the extrastriate cortex. Science. 1985;229:782–784. doi: 10.1126/science.4023713. [DOI] [PubMed] [Google Scholar]
- 37.Muller HJ, Rabbitt PM. Reflexive and voluntary orienting of visual attention: time course of activation and resistance to interruption. J Exp Psychol Hum Percept Perform. 1989;15:315–330. doi: 10.1037//0096-1523.15.2.315. [DOI] [PubMed] [Google Scholar]
- 38.Muller NG, Bartelt OA, Donner TH, Villringer A, Brandt SA. A physiological correlate of the “Zoom Lens” of visual attention. J Neurosci. 232003:3561–3565. doi: 10.1523/JNEUROSCI.23-09-03561.2003. [DOI] [PMC free article] [PubMed] [Google Scholar]
- 39.Noesselt T, Hillyard SA, Woldorff MG, Schoenfeld A, Hagner T, Jancke L, Tempelmann C, Hinrichs H, Heinze HJ. Delayed striate cortical activation during spatial attention. Neuron. 2002;35:575–587. doi: 10.1016/s0896-6273(02)00781-x. [DOI] [PubMed] [Google Scholar]
- 40.Pascual-Marqui RD. Review of methods for solving the EEG inverse problem. Int J Bioelectromagn. 1999;1:75–86. [Google Scholar]
- 41.Pascual-Marqui RD, Michel CM, Lehmann D. Low resolution electromagnetic tomography: a new method for localizing electrical activity in the brain. Int J Psychophysiol. 1994;18:49–65. doi: 10.1016/0167-8760(84)90014-x. [DOI] [PubMed] [Google Scholar]
- 42.Posner MI. Orienting of attention. Q J Exp Psychol. 1980;32:3–25. doi: 10.1080/00335558008248231. [DOI] [PubMed] [Google Scholar]
- 43.Posner MI, Gilbert CD. Attention and primary visual cortex. Proc Natl Acad Sci U S A. 1999;96:2585–2587. doi: 10.1073/pnas.96.6.2585. [DOI] [PMC free article] [PubMed] [Google Scholar]
- 44.Posner MI, Walker JA, Friedrich FJ, Rafal RD. How do the parietal lobes direct covert attention? Neuropsychologia. 1987;25:135–145. doi: 10.1016/0028-3932(87)90049-2. [DOI] [PubMed] [Google Scholar]
- 45.Riggio L, Kirsner K. The relationship between central cues and peripheral cues in covert visual orientation. Percept Psychophys. 1997;59:885–899. doi: 10.3758/bf03205506. [DOI] [PubMed] [Google Scholar]
- 46.Strik WK, Fallgatter AJ, Brandeis D, Pascual-Marqui RD. Three-dimensional tomography of event-related potentials during response inhibition: evidence for phasic frontal lobe activation. Electroencephalogr Clin Neurophysiol. 1998;108:406–413. doi: 10.1016/s0168-5597(98)00021-5. [DOI] [PubMed] [Google Scholar]
- 47.Talsma D, Woldorff MG. Methods for the estimation and correction of artifacts and overlap. In: Handy T, editor. Event-Related Potentials: A Methods Handbook. MIT press: Cambridge, MA ; in press. [Google Scholar]
- 48.Theeuwes J. Exogenous and endogenous control of attention: the effect of visual onsets and offsets. Percept Psychophys. 1991;49:83–90. doi: 10.3758/bf03211619. [DOI] [PubMed] [Google Scholar]
- 49.Turatto M, Benso F, Facoetti A, Galfano G, Mascetti GG, Umilta C. Automatic and voluntary focusing of attention. Percept Psychophys. 2000;62:935–952. doi: 10.3758/bf03212079. [DOI] [PubMed] [Google Scholar]
- 50.Warner CB, Juola JF, Koshino H. Voluntary allocation versus automatic capture of visual attention. Percept Psychophys. 1990;48:243–251. doi: 10.3758/bf03211524. [DOI] [PubMed] [Google Scholar]
- 51.Woldorff MG. Distortion of ERP averages due to overlap from temporally adjacent ERPs: analysis and correction. Psychophysiology. 1993;30:98–119. doi: 10.1111/j.1469-8986.1993.tb03209.x. [DOI] [PubMed] [Google Scholar]
- 52.Yamaguchi S, Kobayashi S. Contributions of the dopaminergic system to voluntary and automatic orienting of visuospatial attention. J Neurosci. 1998;18:1869–1878. doi: 10.1523/JNEUROSCI.18-05-01869.1998. [DOI] [PMC free article] [PubMed] [Google Scholar]
- 53.Yamaguchi S, Tsuchiya H, Kobayashi S. Electroencephalographic activity associated with shifts of visuospatial attention. Brain. 1994;117:553–562. doi: 10.1093/brain/117.3.553. [DOI] [PubMed] [Google Scholar]
- 54.Yantis S, Jonides J. Abrupt visual onsets and selective attention: voluntary versus automatic allocation. J Exp Psychol Hum Percept Perform. 1990;16:121–124. doi: 10.1037//0096-1523.16.1.121. [DOI] [PubMed] [Google Scholar]