

Abstract
Theoretically visual gain has been identified as a control variable in models of isometric force. However, visual gain is typically confounded with visual angle and distance, and the relative contribution of visual gain, distance, and angle to the control of force remains unclear. This study manipulated visual gain, distance, and angle in three experiments to examine the visual information properties used to regulate the control of a constant level of isometric force. Young adults performed a flexion motion of the index finger of the dominant hand in 20 s trials under a range of parameter values of the three visual variables. The findings demonstrate that the amount and structure of the force fluctuations were organized around the variable of visual angle, rather than gain or distance. Furthermore, the amount and structure of the force fluctuations changed considerably up to 1°, with little change higher than a 1° visual angle. Visual angle is the critical informational variable for the visuomotor system during the control of isometric force.
Introduction
The human visuomotor system includes multiple brain regions that transform visual signals into motor commands (Ellermann et al. 1998; Vaillancourt et al. 2003). These brain regions span across cortical areas, such as the parietal cortex and premotor cortex (Milner and Goodale 1993; Jeannerod et al. 1995; Caminiti et al. 1996), cerebellum (Stein and Glickstein 1992; Ebner and Fu 1997), and basal ganglia (Mushiake and Strick 1995). When these brain regions perform visuomotor transformations, it remains unclear which informational variables are the critical variables that tune performance and optimize manual control.
Physiological and human performance models of isometric force control have incorporated the control to display gain as an important control variable (Jagacinski and Flach 2003). The gain of the system is an index of the sensitivity of the system to error and is usually controlled operationally by the ratio of the pixels on the computer screen representing a given level or increment of force in the isometric controller. Previous studies have shown that increments of gain up to some level can facilitate performance beyond which there may be no improvement or even a decrement of performance (Stephens and Taylor 1974; Newell and McDonald 1994; Beuter et al. 1995; Rougier et al. 2004). In addition, estimates of the error deadzone in sensori-motor performance suggest that error correction does not occur until a critical display value is reached resulting in a spatial range where errors in performance cannot be reduced any further (Wolpert et al. 1992).
Visual gain in isometric force tasks is readily modulated in computer-controlled manipulandum environments but its effect can be mediated by the distance of the observer from the information on the computer screen (Gibbs 1962). Nevertheless, and, as noted above, the visual distance is often not reported in the methods sections of experimental papers. Furthermore, and importantly both theoretically and operationally, the visual distance and gain variables create the variable of visual angle, an informational property that has been shown to be important in the veridical perception of objects (Levin and Haber 1993; Gogel and Eby 1997). Indeed, visual angle would seem to be a potential critical variable tuning the visuomotor system because it captures two dimensions of the visual scene whereas the variables visual gain and visual distance represent one perceptual dimension. In head-controlled computer devices (Jagacinski and Monk 1985) it has been shown that viewing distance has no effect on performance in a fixed gain ratio of screen displacement to the angle of head motion (Schaab et al. 1996). In experimental visual manual control devices the head position and distance from the computer screen is typically fixed, so that the visual angle and gain effects are mediated through eye movements rather than head movements.
The first purpose of the current study was to determine the relative contribution of visual angle, gain, and distance in the control of force output where the head position is fixed. The second purpose was to determine if visual angle, which is a product of visual gain and distance, acts as a critical variable tuning the visuomotor system for optimal performance. We report three motor psychophysics experiments that were set-up to systematically test a broad range of visual gain, distance and angle levels in the regulation of isometric force output. We study the visual control of isometric force through computerized feedback because this motor psychophysics setup has yielded previous insights into the properties of visual information that are used to regulate force output (Newell and McDonald 1994; Slifkin et al. 2000). The influence of these visual information variables was assessed on both the amount and structure of force variability (Vaillancourt and Newell 2003).
Methods
Participants
A total of 12 participants were in Experiment 1 (mean = 26.2; SD = 4.2), 10 participants in Experiment 2 (mean = 25.5; SD = 5.1), and 11 participants in Experiment 3 (mean = 28.3; SD = 5.8). Participants’ age ranged from 21 to 44 years across all 3 studies. There was an even balance between males and females in each Experiments 1 and 2. Experiment 3 had three females. Each participant participated in only one of the three experiments. All participants had normal or corrected to normal vision. The participants were naive to the purpose of the experiment and all participants gave informed consent to all experimental procedures, which were approved by The Pennsylvania State University Institutional Review Board.
Apparatus
Participants were seated in a chair with their dominant forearm resting on a table (75 cm in height). The participant’s dominant hand was pronated and lay flat on the table with the digits of the hand comfortably extended. The elbow position remained constant throughout the experimental session. Through index finger flexion, the participant’s distal pad of the index finger contacted the load cell (Entran ELFS-B3, NJ, USA), 1.27 cm in diameter, which was secured to the table. The distance of the load cell from the participant’s body midline remained constant at 36 cm. Analog output from the load cell was amplified through a Coulbourn Type A (Strain gauge Bridge) S72-25 amplifier at an excitation voltage of 10 V and a gain of 100. A computer controlled 16-bit Data Translation (Model DT322) A/D board sampled the force output at 100 Hz. The A/D board units were transferred to Newtons using a calibration factor derived using known weights prior to the study. The maximum and minimum of the board was −10 to 10 V. The smallest increment of change in force the A/D board could detect was 0.0016 N. The force output was displayed on a 19″ Samsung Sync-Master 912 N video monitor located 48 cm from the participants’ eyes and 100 cm from the floor. There were 1,000 pixels vertically on the visual display that spanned 30 cm vertically. The monitor refresh rate was 60 Hz and the color depth was 32-bit.
The mapping of Newtons to pixels was performed by first determining the maximal voluntary contraction (MVC), the target force level, and screen gain. Since there were 1,000 pixels vertically on the screen, this limited the range of forces and the range of forces depended on the gain level chosen. A high gain level was associated with a small range of forces that were displayed on the screen. A low gain level was associated with a large range of forces that were displayed. For example, assume that a participant has a maximum voluntary contraction (MVC) of 50 N and you want him/her to maintain a force level of 10% of their MVC (i.e., 5 N). The center of the monitor would have a target line drawn horizontally across it which would represent 5 N of force. Assuming that the Newton to pixel ratio is 0.01, then the vertical number of pixels you window is 1,000 pixels with 500 pixels above and 499 pixels below the target line. There are only 499 pixels below the target line because the target line is 1 pixel thick. This would represent 4 N of force above and below the horizontal target line (i.e., force range from 1 to 9 N would be visible).
Procedures
During the initial portion of each experiment, the participant’s MVC was estimated. Participants flexed their index finger against the load cell with maximal force for three consecutive 6 s trials. A 60-s rest period was provided for each participant between each MVC trial. In each MVC trial, the mean of the greatest ten force samples was calculated. The means obtained from three trials were averaged to provide an estimate of each participant’s MVC.
In each experiment, the instruction to the participants was to adjust their level of force output to match a red target line (1 pixel thick) on the video monitor. Participants viewed online feedback of their performance in the form of a yellow force-time trajectory that moved from left to right in time across the video monitor. Participants matched the yellow trajectory line to the red horizontal target line throughout each trial, and were instructed to minimize all deviations of the yellow line from the red line. Participants performed three trials at each unique condition.
Procedures for Experiment 1
Our goal in this study was to determine how the visual angle (through a gain manipulation with the distance held constant) of the force output affected force variability across a range of target force levels. The study manipulated two independent variables. First, we manipulated the target force level specified on the video display. The force levels used in the study were 5, 19, 33, 47, 61, 75, and 89% of the MVC. The second variable we manipulated was the visual angle. The visual angle can be varied by altering the distance from the video display and by changing the height of the force fluctuations provided to the participant on the video display. Figure 1b depicts a schematic diagram of each of these two scenarios where visual angle (α) is affected by both the force feedback height and distance of the eye from the video display. In Eq. 1,
Fig. 1.
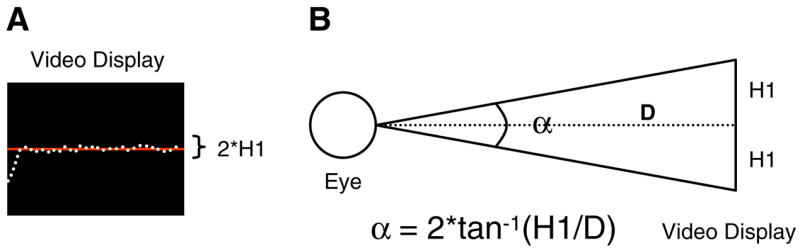
The experimental paradigm provided on-line visual feedback from left to right on a video display. a An example of the video display. The solid horizontal line represents the target and the white dots represent the updated force cursor. b The calculation for visual angle. The distance from the eye to the monitor was determined, along with the height of the force fluctuations viewed on the computer display
| (1) |
α is the visual angle and is a function of the height and distance of the video display. The distance (D) was constant in Experiment 1 at 48 cm, but the height was varied by manipulation of gain. Thus, in Experiment 1 we cannot differentiate between gain and visual angle. The Newton-to-pixel ratio (i.e., gain) was adjusted and these gain adjustments resulted in 3 visual angle conditions that covered a broad range of angles. In calculating the visual angle we first determined the gain levels for each individual participant at each target percent of the MVC. The gain levels were adjusted to maintain three visual angle levels across each force level. We used 5, 250, and 2,500 vertical pixels to display the force fluctuations to the participant.
Table 1 shows the across participant average gain levels (Newton-to-pixel ratio) used to achieve the 5, 250, and 2,500 pixel condition. It should be noted that participants were allowed either 5, 250, or 2,500 pixels depending on the condition over which their force could vary at each force level. In calculating the visual angle, prior to data collection we assumed that a participant produced force at 25% MVC (MVC = 40 N) and had a standard deviation of 0.3 N. This estimate was derived from previous studies (Slifkin and Newell 1999; Laidlaw et al. 2000; Jones et al. 2002). The standard deviation was multiplied by 6 to approximate the full range of estimated variance. This calculation resulted in an estimated visual angle for 5, 250, and 2,500 vertical pixels of 0.10°, 4.4°, and 38°. While the total allotted 2,500 pixel condition was more than the 1,000 pixels presented on the video display, participants’ force output during the steady-state phase did not go outside the monitor height during the steady state phase of the task. However, at the beginning of the trial the force feedback cursor was below the monitor (not visible to the participant) and the participant had to increase force to find the window around the target where the feedback cursor remained within the 1,000 displayed pixels. Following the practice session, participants had no problem achieving this task.
Table 1.
Average gain levels in Experiment 1
| %MVC | 5 Pixels | 250 Pixels | 2,500 Pixels |
|---|---|---|---|
| 5 | 0.2602 | 0.0052 | 0.0007 |
| 19 | 0.9890 | 0.0197 | 0.0019 |
| 33 | 1.7278 | 0.0343 | 0.0033 |
| 47 | 2.4423 | 0.0489 | 0.0049 |
| 61 | 3.1753 | 0.0634 | 0.0063 |
| 75 | 3.9041 | 0.0780 | 0.0078 |
| 89 | 4.6333 | 0.0926 | 0.0092 |
Procedures for Experiment 2
The goal in Experiment 2 was the same as Experiment 1, which was to determine how the visual angle affected force variability across a range of target force levels. In contrast to Experiment 1 where gain was manipulated along with the visual angle, Experiment 2 manipulated the visual angle by varying the distance of the monitor from the participant’s eyes. Thus, we assessed visual angle independent from gain, but angle and distance covaried in Experiment 2. Three visual distances were chosen: 24, 163, and 481 cm. The gain was set to 0.01 for each distance. The corresponding visual angles were 6°, 0.9°, and 0.3°. Participants produced force at 5, 25, 45, 65, and 85% of their MVC at each of the three distances.
Procedures for Experiment 3
Experiment 3 manipulated a broad range of visual angle, gain, and distance values at the same force level to determine if visual angle influenced force variability independently of gain and screen distance. In particular, we set out to examine force variability at two separate gain levels across the same visual angles in order to determine if the key informational variable was visual angle, gain, distance, or some combination of the three. Participants produced force at 25% MVC across 14 different visual feedback conditions. There were seven visual angle levels at the 0.1 gain level and seven visual angle levels at the 0.01 gain level. There was an overlap such that four visual angle levels were tested at a gain of 0.1 and 0.01.
Table 2 shows the conditions chosen for Experiment 3. There were four visual angle levels that overlapped at two different gain conditions. Similarly, there were three distances that overlapped at the two gain conditions. In the calculations, we again assumed that a participant produced force at 25% MVC (MVC = 40 N) with a standard deviation of 0.3 N. We then multiplied the standard deviation by 6 to approximate the full range of estimated variance, as shown as the height (2 × H1) in Newtons in Fig. 1. The height in pixels is a function of the gain, and the number of pixels (1,000) shown vertically. The height in centimeters was calculated from the number of pixels per unit centimeter. Finally, from Eq. 1 we calculated the distance needed for the video display to achieve the corresponding visual angle. The video display was moved to these 14 distances during the experiment to realize the respective visual angle and gain level conditions.
Table 2.
Experimental design for Experiment 3
| Visual angle (°) | Visual angle (rad) | Vertical height (N) | Vertical height (pixels) | Vertical height (cm) | Distance cm) |
|---|---|---|---|---|---|
| Gain of 0.01 | |||||
| 6 | 0.1047 | 1.8 | 180 | 2.7 | 26 |
| 5 | 0.0872 | 1.8 | 180 | 2.7 | 31 |
| 4 | 0.0698 | 1.8 | 180 | 2.7 | 39 |
| 3 | 0.0523 | 1.8 | 180 | 2.7 | 52 |
| 2 | 0.0349 | 1.8 | 180 | 2.7 | 77 |
| 1 | 0.0174 | 1.8 | 180 | 2.7 | 155 |
| 0.5 | 0.0087 | 1.8 | 180 | 2.7 | 309 |
| Gain of 0.1 | |||||
| 3 | 0.0523 | 1.8 | 18 | 0.27 | 5 |
| 2 | 0.0349 | 1.8 | 18 | 0.27 | 8 |
| 1 | 0.0174 | 1.8 | 18 | 0.27 | 15 |
| 0.5 | 0.0087 | 1.8 | 18 | 0.27 | 31 |
| 0.25 | 0.0043 | 1.8 | 18 | 0.27 | 62 |
| 0.1 | 0.0017 | 1.8 | 18 | 0.27 | 155 |
| 0.05 | 0.0008 | 1.8 | 18 | 0.27 | 309 |
Data analysis
The force time series data were processed by the following methods. First, the initial 4 s of each force time series was removed to allow participants time to achieve the force target, and the final 1 s was removed because on occasion participants release force prior to the end of the trial in anticipation of the trial ending. Second, force data were digitally filtered using a fourth order Butter-worth filter with a lowpass cuto3 frequency of 20 Hz. Next, the mean force was calculated for the 1,000 data points spanning 10 s. In addition, to assess variability we calculated the standard deviation (SD) and approximate entropy (ApEn) of force. ApEn was calculated consistent with previous work (Pincus 1991; Slifkin et al. 2000). The mean, SD, and ApEn for each of the trials were then used in the inferential statistics. All data processing was performed using software written in Matlab (The MathWorks Inc., Natick, MA, USA).
Statistics
The dependent variables mean, standard deviation, and ApEn were analyzed using separate repeated measures ANOVAs. In Experiments 1 and 2, the first within-participant factor was the vision condition and the second factor was force. All ANOVAs were evaluated as significant when there was less than a 5% chance of making a Type I error (P < 0.05). If an interaction was found, we next calculated a simple effects analysis using a one-way ANOVA for visual angle at each of the seven force level conditions (Keppel 1991). If the simple effects ANOVA was significant, Tukey’s HSD post hoc analysis was performed. In Experiment 3, repeated measures ANOVAs were run for each gain level across visual angle conditions. Paired t-tests between gain conditions were used at each of the four overlapping visual angle conditions. Finally, we combined all of the SD data across the three experiments to run a multiple regression analysis with force, visual angle, gain, and distance as independent factors. All statistical analyses were completed using the Statistica statistical package (StatSoft Inc., OK, USA).
Results
Experiment 1: visual angle manipulated through gain
Figure 2a depicts the mean force across the three visual angle conditions. As expected, participants monotonically increased their mean force with the target % MVC force that was specified on the video display [F(6, 66) = 113.42, P < 0.01]. As shown in Fig. 2a and confirmed in the statistics, there was no effect of visual angle on the mean force and no evidence for a visual angle by force interaction.
Fig. 2.

Experiment 1 force output data. a The mean force across force levels, b the standard deviation, and c approximate entropy (ApEn). Each value represents the average across trials and participants at the corresponding force and visual angle condition. The high (38°), medium (4.4°), and low (0.1°) visual angles are depicted with different symbols. See Methods for visual angle calculations
Figure 2b shows the SD of force across visual angle and force level conditions. The SD of force increased across force levels [F(6, 66) = 40.85, P < 0.01]. There was also a significant effect of visual angle [F(2, 22) = 11.01, P < 0.01], with greater visual angle having lower force variability. In addition, the statistics confirmed the qualitative observation in Fig. 2b that there was a significant visual angle by force interaction [F(12, 132) = 3.29, P < 0.01]. Namely, Fig. 2b indicates that the low visual angle resulted in a more substantial increase in the standard deviation starting at 47% MVC compared with the medium and high visual angle conditions.
Simple effects analysis was performed in the form of one factor ANOVAs for visual angle at each of the seven force level conditions. This analysis found that at each force level condition, visual angle significantly affected force variability (all P’s < 0.05). We next calculated Tukey’s HSD post hoc test across the three visual angles at each of the seven force levels. Tukey’s HSD test revealed that the high visual angle was significantly different (P’s < 0.05) from the low visual angle at the 5, 19, 61, and 75% force levels. At the 33, 47, and 89% force levels the high visual angle was significantly different from the low and the medium visual angle levels. Thus, these findings demonstrate that: (1) variability increased with force level, (2) variability decreased with greater visual angle, and (3) variability increased the most at the lowest visual angle and the highest force level conditions.
Figure 2c depicts ApEn across force and visual angle conditions. There was a small, but significant increase in ApEn with force [F(6, 66) = 6.29, P < 0.01]. In addition, greater visual angle resulted in high ApEn values [F(2, 22) = 116.03, P < 0.01]. The medium and high visual angle conditions had similar ApEn levels across force. There was no significant interaction between visual angle and force for ApEn. Thus, the complexity of the force output increased with increased visual angle.
Experiment 2: visual angle manipulated through distance
Figure 3a shows that participants scaled their mean force with the target force requirement [F(4, 36) = 87.58, P < 0.01]. Visual angle did not affect the mean force, and the angle by force interaction did not approach significance. Figure 3b shows that the SD of force was reduced with increased visual angle [F(2, 18) = 7.85, P < 0.01]. As expected, the SD of force increased with force level [F(4, 36) = 18.75, P < 0.01], but there was not a significant visual angle by force interaction. Thus, force variability was reduced with higher visual angle.
Fig. 3.

Experiment 2 force output data. a The mean force across force levels, b the standard deviation, and c ApEn. Each value represents the average across trials and participants at the corresponding force and visual angle condition. The high (6°), medium (0.9°), and low (0.3°) visual angles are depicted with different symbols. See Methods for visual angle calculations
Figure 3c depicts ApEn across force level and visual angle. ApEn increased with the force level [F(4, 36) = 7.6, P < 0.01], and ApEn was increased with high visual angle [F(2, 18) = 18.11, P < 0.01]. In addition, there was a significant visual angle by force interaction [F(2, 22) = 116.03, P < 0.01]. Simple effects analysis using separate one-way ANOVAs at each force level determined that visual angle significantly affected ApEn at 5, 25, 45, and 65% MVC, but visual angle had a non-significant effect at the 85% force level. Tukey’s HSD post hoc test at each force level indicated that the high visual angle was significantly different from the low and medium visual angle at the 5 and 45% force levels, whereas the high visual angle was different from the low visual angle at the 25 and 65% levels. The post hoc test was consistent with the simple effects analysis in showing that the 85% level did not differ between visual angle levels.
Experiment 3: visual angle, distance, and gain
Figure 4a shows that the SD of force was systematically reduced across the visual angle levels. Similarly, Fig. 4b demonstrates a similar trend but in the opposite direction for ApEn. The functions for both the SD and ApEn across visual angles are non-linear, with much of the change occurring between 0° and 3°. We first conducted a one-way ANOVA for visual angle at each gain level. The main effect of visual angle for the SD and ApEn was significant at each gain level (all P’s < 0.05). Since the main purpose of Experiment 3 was to examine the effect of gain at the same visual angle, we conducted t-tests for gain at the four overlapping visual angle levels. The t-test comparisons were all non-significant for the SD and ApEn (all P’s > 0.05), and none of the t-values approached significance. The lack of a significant effect for gain is consistent with qualitative observations from the data in Fig. 4. Thus, Experiment 3 indicates that visual angle systematically altered force output variability but gain did not.
Fig. 4.
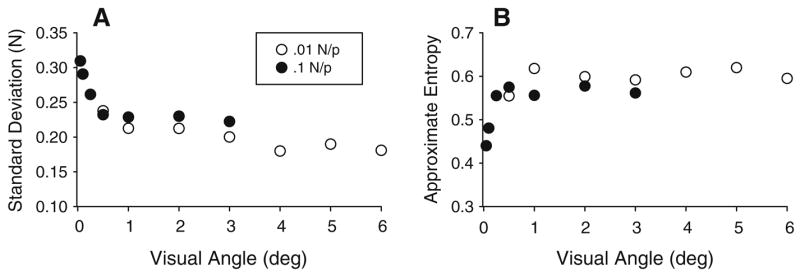
Experiment 3 force output data. a The standard deviation and b ApEn. The two gain levels 0.1 and 0.01 (N/P ratio) are depicted as different symbols in the legend. Each value represents the average standard deviation or ApEn value across trials and participants
Multiple regression analysis: force, distance, gain, and visual angle
Although the data in Experiment 3 were convincing for the effects of visual angle, we decided to combine the data across all three experiments to examine the contribution of visual distance, gain, and angle using multiple regression. Since Figs. 2b and 3b indicate that the SD of force is non-linear across force and Fig. 4a showed that the SD of force was non-linear across visual angle, we log transformed the dependent variable SD. We used a backward multiple regression approach with all four independent variables included in the model. These included force, distance, gain, and angle. In the regression model, we used the data from all 3 experiments including 33 participants. The backward multiple regression resulted in a significant model, [F(2, 47) = 173.29, P < 0.05], with an R2 = 0.87. The model kept force and visual angle as both were highly significant predictors of the SD of force (Fig. 5). The model did not keep distance or gain as these variables were not significant predictors of the SD of force. The final regression model was SD of force = −3.51 + 0.93 × Force - 0.24 × visual angle. It is important to note that the slope for the force level was greater than the slope for visual angle.
Fig. 5.
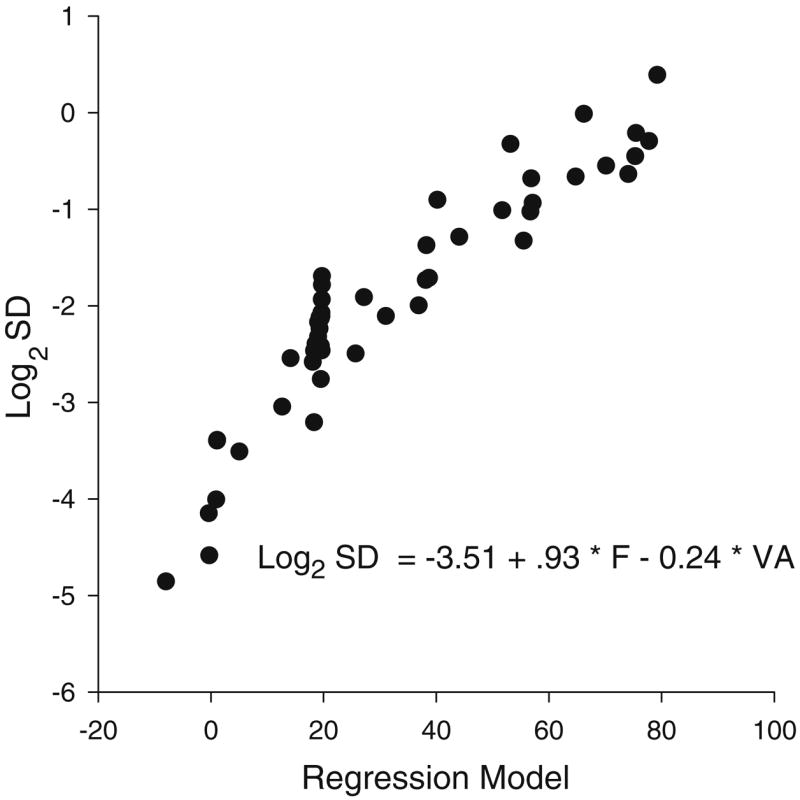
Multiple regression model prediction. The equation log2 SD of force = −3.51 + 0.93 × force − 0.24 × visual angle was calculated using the actual force (F) and visual angle (VA) values and is shown predicting the log transformed standard deviation (SD) values for each participant under each condition across the three studies
Discussion
The experiments were designed to determine the relative contribution of visual angle, distance and gain in the visual-manual control of isometric force. The findings are clear in showing that visual angle organizes the amount and structure of the variability of isometric force. Visual angle is a variable that is geometrically derived from the combination of the gain (force/pixel ratio) of the visual display and the distance that the performer’s eye is from the visual information on the computer screen (see Fig. 1). Visual angle has been shown to be a powerful mediator of the perception of object properties and distances (Levin and Haber 1993; Gogel and Eby 1997), and manipulation of visual angle alters neural firing properties in visual cortex (Rosenbluth and Allman 2002). Gibbs (1962) hypothesized that visual angle may mediate visual-manual control but emphasis has been given to the role of gain in visual displays of tracking behavior (cf. Jagacinski and Flach 2003; Wickens 1984).
The findings of Experiment 1 showed that increments of gain (with distance held constant) reduced the amount of isometric force variability (Stephens and Taylor 1974; Newell and McDonald 1994; Vaillancourt et al. 2002). Experiment 2 showed that increments of visual distance (with gain held constant) increased the amount of variability of force output, suggesting that visual angle may play a critical role in isometric manual control. The independent manipulation of visual distance and gain in Experiment 3 a3orded a stronger test of the relative contribution of visual angle, visual distance and visual gain to the force output. This experiment included different combinations of visual distance and gain that produced the same visual angle in force control. The findings revealed that isometric force variability is mediated over a wide parameter range largely by the visual angle independent of the respective visual distance or the gain.
This interpretation of the relative importance of visual angle to gain and distance was confirmed by the results of the multiple regression analysis on the data of all three experiments. This outcome is consistent with the expectations that arise from a consideration of the geometry of the visual information of the force output to the eye of the performer (see Fig. 1). Nevertheless, future experiments could examine more precisely the possible asymmetry of the contribution of gain and distance to visual angle effects in force control.
The pattern of findings obtained on the amount of variability as a function of visual angle, distance and gain were complemented by those on the structure of the force variability. That is, increments in visual angle led to higher levels of irregularity and lower levels in the amount of force variability. Here we used ApEn (Pincus 1991) as a robust indicator of the irregularity of the force output. This inverse relation between the amount and structure of variability is consistent with findings on force variability from several previous experiments on isometric force control (Newell and Slifkin 1998; Vaillancourt and Newell 2003).
These findings regarding distance, gain, and visual angle raise the question as to why visual angle was a better predictor of performance variability than gain or distance. A potential answer to this question may be found in a consideration of the specific aspect of each variable. For instance, there is a difference in the dimensionality between distance and visual angle. Distance is a perceptual variable in one dimension, whereas in contrast, visual angle takes into account the distance from the video display and the height of the force fluctuations, thereby providing a perceptual variable combining two dimensions. Gain on the other hand incorporates one dimension (height on screen) in the perceptual domain and maps this to the motor coordinates (Newtons). Thus, visual angle may be a more powerful predictor than distance and gain in visual-motor control because of the extra dimension included in the variable (Levin and Haber 1993).
Previous studies have revealed a quazi U- or J-shaped function for the amount of force variability as a function of visual gain in both isometric force (Newell and McDonald 1994) and tracking (Gibbs 1962; Hess 1973) tasks. Namely, increments of visual information gain up to some level facilitate performance beyond which there is a performance decrement. The current study did not find an increase in force variability when visual angle was increased past a critical value, although a broad range of visual angles was examined spanning from 0.05° to 6°. However, we would anticipate that further increases in the visual angle could potentially cause force variability to increase. Such a finding would be consistent with a U or J shaped functions shown in tracking tasks when display gain is manipulated (Gibbs 1962; Hess 1973), rather than the nonlinear function observed here (Fig. 4).
It has been hypothesized that the cross over of effort and instability of the output determines the optimal level of gain in tracking tasks (Wickens 1984) and the relevance of these constructs to gain and visual angle effects in isometric force control needs to be examined. High gain or visual angle conditions can lead to over corrections, oscillations and instability as realized in the enhanced amount and structure of the variability. This is because in a high visual angle condition a small change of output on the screen can lead to a larger than required modulation of the isometric output, thus increasing rather than decreasing variability. This perspective is consistent with the idea that there is some minimal variation in motor output that cannot be reduced due to the neuromuscular and mechanical constraints as reflected in tremor (Elble and Koller 1990; Vaillancourt and Newell 2000). Thus, behaviorally in tasks such as isometric control there is an error deadzone in which error correction is not invoked until a critical value is reached resulting in a spatial range where errors in performance cannot be reduced any further (Wolpert et al. 1992).
The change in force variability as a function of visual angle occurred predominantly in the range of less than 1°. In visual angle conditions larger than 1° force variability changed at a much slower rate and tended to plateau (Fig. 4). The same pattern of findings was observed for ApEn. The approximately 1° error deadzone is larger than that traditionally attributed to an oculo-motor deadzone (Wyman and Steinman 1973) and thus the effects here are much more readily interpreted in terms of sensori-motor processes (Wolpert et al. 1992).
These spatially mediated findings of visual angle parallel previous findings in the temporal domain. For instance, when visual feedback is presented intermittently from 0.2 to 25 Hz during an isometric force task, force variability declines hyperbolically toward an asymptote (Slifkin et al. 2000). Most of the changes in force variability occur from 0 to 6.4 Hz, and the changes in force variability after 6.4 Hz are minimal. Thus, it is evident that both spatial and temporal visual feedback modulates force variability, and that after a critical value force variability changes at a much slower rate in both dimensions. An fMRI study has shown that visuomotor related signals occur in the parietal and premotor cortex at both infrequent (0.4 Hz) and frequent (25 Hz) visual feedback, but only frequent visual feedback recruited the lateral cerebellum to process visuomotor signals (Vaillancourt et al. 2006).
We speculate that a similar mechanism could be operating in the cerebellum for the spatial domain, in that low visual angles may not elicit visuomotor activation in the lateral cerebellum thereby limiting the participant’s ability to reduce force variability. In contrast, with high visual angles we hypothesize that the cerebellum processes additional visuomotor signals thereby allowing the participant to reduce force variability. One interesting possibility that needs to be explored further is that a common mechanism for both spatial and temporal properties of visual feedback could be operating at the level of the cerebellum to modulate force variability. The alternative possibility is that the different regions of the cerebellum process visuomotor signals related to spatial and temporal feedback.
Finally, it should be noted that while the findings show that visual angle is the organizing visual variable in regulating force output this does not in practice rule out the important experimental role of visual distance or gain as independent variables in driving the variability of isometric force output. In most manual control experiments visual gain is varied with the viewing distance held constant, and moreover the distance of the eye of the observer to the computer screen is usually not reported. These manipulations of gain and distance alter the visual angle and have a direct impact on the measured force variability. In addition, we also note that while visual angle was isolated as an important control variable in this isometric task, this finding may not apply in other contexts such as movement tasks where other informational variables are more relevant. In conclusion, the findings from our experiments show that the standard visual gain effect in visual-motor force control is more generally and fundamentally a visual angle effect (Gibbs 1962).
Acknowledgments
This research was supported in part by grants from the National Institutes of Health (R01-NS52318, R01-HD46918, R03-AG23259). We thank Tim Benner for his technical assistance in setting up the computerized software of the display for the experiment. Pamela S. Haibach is now at SUNY Brockport.
References
- Beuter A, Haverkamp H, Glass L, Carriere L. Effect of manipulating visual feedback parameters on eye and finger movements. Int J Neurosci. 1995;83:281–294. doi: 10.3109/00207459508986345. [DOI] [PubMed] [Google Scholar]
- Caminiti R, Ferraina S, Johnson PB. The sources of visual information to the primate frontal lobe: a novel role for the superior parietal lobule. Cereb Cortex. 1996;6:319–328. doi: 10.1093/cercor/6.3.319. [DOI] [PubMed] [Google Scholar]
- Ebner TJ, Fu Q. What features of visually guided arm movements are encoded in the simple spike discharge of cerebellar Purkinje cells? Prog Brain Res. 1997;114:431–447. doi: 10.1016/s0079-6123(08)63379-8. [DOI] [PubMed] [Google Scholar]
- Elble RJ, Koller WC. Tremor. The John Hopkins University Press; Baltimore: 1990. [Google Scholar]
- Ellermann JM, Siegal JD, Strupp JP, Ebner TJ, Ugurbil K. Activation of visuomotor systems during visually guided movements: a functional MRI study. J Magn Reson. 1998;131:272–285. doi: 10.1006/jmre.1998.1379. [DOI] [PubMed] [Google Scholar]
- Gibbs CB. Controller designs, interactions of controlling limbs, time-lags, and gains in positional and velocity systems. Ergonomics. 1962;17:385–402. [Google Scholar]
- Gogel WC, Eby DW. Measures of perceived linear size, sagittal motion, and visual angle from optical expansions and contractions. Percept Psychophys. 1997;59:783–806. doi: 10.3758/bf03206024. [DOI] [PubMed] [Google Scholar]
- Hess RA. Nonadjectival rating scales in human response experiments. Hum Factors. 1973;15:275–280. [Google Scholar]
- Jagacinski RJ, Flach JM. Control theory for humans: quantitative approaches to modeling performance. Lawrence Erlbaum Associates; Mahwah: 2003. [Google Scholar]
- Jagacinski RJ, Monk DL. Fitts’ Law in two dimensions with hand and head movements. J Mot Behav. 1985;17:77–95. doi: 10.1080/00222895.1985.10735338. [DOI] [PubMed] [Google Scholar]
- Jeannerod M, Arbib MA, Rizzolatti G, Sakata H. Grasping objects: the cortical mechanisms of visuomotor transformation. Trends Neurosci. 1995;18:314–320. [PubMed] [Google Scholar]
- Jones KE, Hamilton AF, Wolpert DM. Sources of signal-dependent noise during isometric force production. J Neurophysiol. 2002;88:1533–1544. doi: 10.1152/jn.2002.88.3.1533. [DOI] [PubMed] [Google Scholar]
- Keppel G. Design and analysis: a researcher’s handbook. Prentice Hall; Upper Saddle River: 1991. [Google Scholar]
- Laidlaw DH, Bilodeau M, Enoka RM. Steadiness is reduced and motor unit discharge is more variable in old adults. Muscle Nerve. 2000;23:600–612. doi: 10.1002/(sici)1097-4598(200004)23:4<600::aid-mus20>3.0.co;2-d. [DOI] [PubMed] [Google Scholar]
- Levin CA, Haber RN. Visual angle as a determinant of perceived interobject distance. Percept Psychophys. 1993;54:250–259. doi: 10.3758/bf03211761. [DOI] [PubMed] [Google Scholar]
- Milner AD, Goodale MA. Visual pathways to perception and action. Prog Brain Res. 1993;95:317–337. doi: 10.1016/s0079-6123(08)60379-9. [DOI] [PubMed] [Google Scholar]
- Mushiake H, Strick PL. Pallidal neuron activity during sequential arm movemetns. J Neurophysiol. 1995;74:2754–2758. doi: 10.1152/jn.1995.74.6.2754. [DOI] [PubMed] [Google Scholar]
- Newell KM, McDonald PV. Information, coordination modes and control in a prehensile force task. Hum Mov Sci. 1994;13:375–391. [Google Scholar]
- Newell KM, Slifkin AB. The nature of movement variability. In: Piek J, editor. Motor control and human skill: a multidisciplinary perspective. Human Kinetics; Champaign: 1998. pp. 143–160. [Google Scholar]
- Pincus SM. Approximate entropy as a measure of system complexity. Proc Natl Acad Sci USA. 1991;88:2297–2301. doi: 10.1073/pnas.88.6.2297. [DOI] [PMC free article] [PubMed] [Google Scholar]
- Rosenbluth D, Allman JM. The effect of gaze angle and fixation distance on the responses of neurons in V1, V2, and V4. Neuron. 2002;33:143–149. doi: 10.1016/s0896-6273(01)00559-1. [DOI] [PubMed] [Google Scholar]
- Rougier P, Farenc I, Berger L. Modifying the gain of the visual feedback affects undisturbed upright stance control. Clin Biomech (Bristol, Avon) 2004;19:858–867. doi: 10.1016/j.clinbiomech.2004.04.013. [DOI] [PubMed] [Google Scholar]
- Schaab JA, Radwin RG, Vanderheiden GC, Hansen PK. A comparison of two control-display gain measures for head-controlled computer input devices. Hum Factors. 1996;38:390–403. doi: 10.1518/001872096778702042. [DOI] [PubMed] [Google Scholar]
- Slifkin AB, Newell KM. Noise, information transmission, and force variability. J Exp Psychol Hum Percept Perform. 1999;25:837–851. doi: 10.1037//0096-1523.25.3.837. [DOI] [PubMed] [Google Scholar]
- Slifkin AB, Vaillancourt DE, Newell KM. Intermittency in the control of continuous force production. J Neurophysiol. 2000;84:1708–1718. doi: 10.1152/jn.2000.84.4.1708. [DOI] [PubMed] [Google Scholar]
- Stein JF, Glickstein M. Role of the cerebellum in visual guidance of movement. Physiol Rev. 1992;72:967–1017. doi: 10.1152/physrev.1992.72.4.967. [DOI] [PubMed] [Google Scholar]
- Stephens JA, Taylor A. The effect of visual feedback on physiological muscle tremor. Electroencephalogr Clin Neurophysiol. 1974;36:457–464. doi: 10.1016/0013-4694(74)90202-8. [DOI] [PubMed] [Google Scholar]
- Vaillancourt DE, Newell KM. Amplitude changes in the 8–12, 20–25, and 40 Hz oscillations in finger tremor. Clin Neurophysiol. 2000;111:1792–1801. doi: 10.1016/s1388-2457(00)00378-3. [DOI] [PubMed] [Google Scholar]
- Vaillancourt DE, Newell KM. Aging and the time and frequency structure of force output variability. J Appl Physiol. 2003;94:903–912. doi: 10.1152/japplphysiol.00166.2002. [DOI] [PubMed] [Google Scholar]
- Vaillancourt DE, Larsson L, Newell KM. Time-dependent structure in the discharge rate of human motor units. Clin Neurophysiol. 2002;113:1325–1338. doi: 10.1016/s1388-2457(02)00167-0. [DOI] [PubMed] [Google Scholar]
- Vaillancourt DE, Thulborn KR, Corcos DM. Neural basis for the processes that underlie visually guided and internally guided force control in humans. J Neurophysiol. 2003;90:3330–3340. doi: 10.1152/jn.00394.2003. [DOI] [PubMed] [Google Scholar]
- Vaillancourt DE, Mayka MA, Corcos DM. Intermittent visuomotor processing in the human cerebellum, parietal cortex, and premotor cortex. J Neurophysiol. 2006;95:922–931. doi: 10.1152/jn.00718.2005. [DOI] [PMC free article] [PubMed] [Google Scholar]
- Wickens CD. Engineering psychology and human performance. Merrill; Columbus: 1984. [Google Scholar]
- Wolpert DM, Miall RC, Winter JL, Stein JF. Evidence for an error deadzone in compensatory tracking. J Motor Behav. 1992;24:299–308. doi: 10.1080/00222895.1992.9941626. [DOI] [PubMed] [Google Scholar]
- Wyman D, Steinman RM. Small step tracking: implications for the oculomotor “dead zone”. Vision Res. 1973;13:2165–2172. doi: 10.1016/0042-6989(73)90194-6. [DOI] [PubMed] [Google Scholar]