

Abstract
Many studies require the measurement of nucleic acid sequence diversity. Here we describe a method, called AmpliCot, that measures the sequence diversity of PCR products on the basis of DNA hybridization kinetics, thereby avoiding the time, expense and biases associated with cloning and sequencing. SYBR Green dye is used to measure DNA hybridization kinetics in a homogeneous, automated fashion. PCR products are prepared in wholly double-stranded homoduplex form for a baseline measurement of DNA concentration. The DNA is melted and then reannealed under stringent conditions that allow only homoduplexes to form. The sequence diversity of a sample is proportional to the product of its concentration and the time required for it to anneal. After validating AmpliCot with a library of diverse sequences, we use it to measure the diversity of expressed rearrangements of the gene encoding the T-cell antigen receptor (TCR) β chain. AmpliCot measurements are in good agreement with previous estimates of murine TCR repertoire diversity that required extensive cloning and sequencing.
Decades before high-throughput DNA sequencing, a method called ‘Cot analysis’ was developed to measure the nucleotide sequence complexity of genomes1. This method was based on the principle that the time required for a DNA sample to reanneal (expressed in terms of the nucleotide concentration–time product, or ‘Cot value’) is related to the sequence complexity of the sample. Although Cot analysis yielded results that were subsequently confirmed by genome sequencing, the difficulty and limitations of traditional protocols limit its use today.
We now describe an assay, called AmpliCot, that combines the powerful techniques of Cot analysis and PCR to facilitate economical, high-throughput measurement of DNA sequence diversity without the expense, time and artifacts involved in cloning and sequencing. The assay is homogeneous and may be carried out with widely accessible real-time PCR machines. As an application of this method, we used AmpliCot to measure the diversity of TCR rearrangements in the immune repertoire. The diversity of this repertoire is a fundamental determinant of the competence of the immune system, but has been difficult to study because of its magnitude: each mouse has been estimated by laborious cloning and sequencing techniques to have ~106 unique TCR rearrangements out of a much larger set of possible sequences2. AmpliCot should facilitate the large number of measurements required for detailed basic and clinical studies of immune repertoire diversity.
RESULTS
Applying Cot analysis to the study of PCR products
AmpliCot is essentially the application of Cot analysis to PCR products (Fig. 1). Short PCR products are prepared in a wholly homoduplex form; for example, Figure 1a shows the preparation of TCR genes from a lymphocyte sample. Annealing kinetics are measured by fluorescence intensity (Fig. 1b). The relative diversity of samples can be calculated by measuring the nucleotide concentration–time product required for a specified percentage of the sample to anneal (Fig. 1c). Standards of known diversity can be used to calculate absolute diversities.
Figure 1.
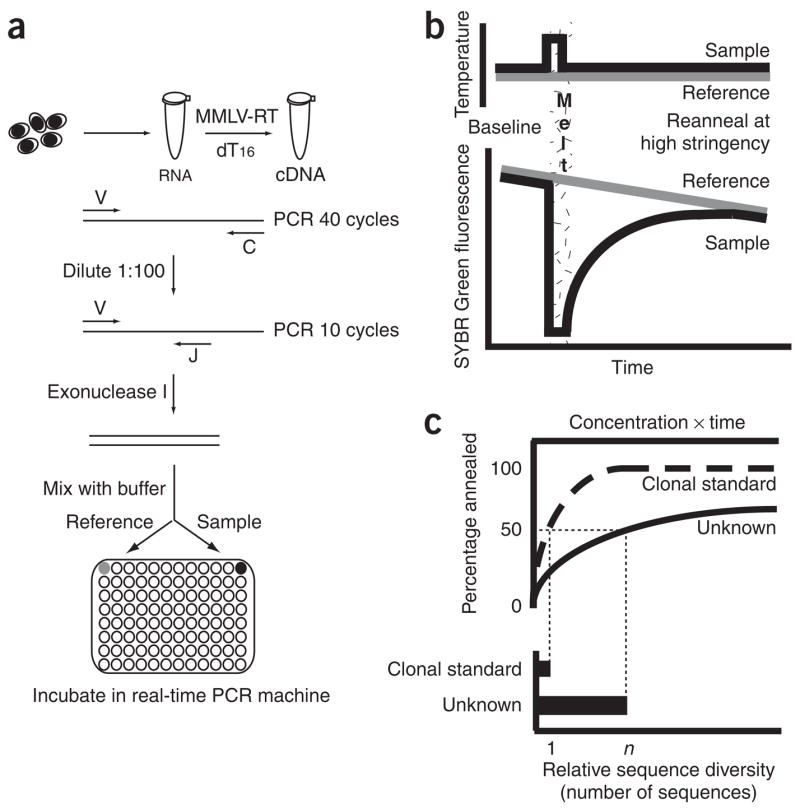
Overview of AmpliCot. (a) Preparation of TCR gene PCR products for AmpliCot. V, C and J represent primers specific for the variable, constant and joining regions of the TCR gene. (b) Data collection in a real-time PCR machine. The sample is heated to the annealing temperature to make a baseline fluorescence measurement. The sample is then melted at 95 °C and the fluorescence decreases to background levels. Finally, the sample is quickly cooled to the annealing temperature, and fluorescence measurements are made as the DNA strands anneal. To correct for the decay of fluorescence over time, fluorescence of the sample is normalized to that of an unmelted reference held at the annealing temperature. The gradient feature of our realtime PCR machine facilitated simultaneous analysis of 32 paired samples. (c) Annealing curve interpretation. To translate normalized fluorescence intensity into an annealing curve (top), the normalized fluorescence at baseline is set as 100% annealed and the normalized fluorescence during the 95 °C melt is set as 0% annealed. Sample concentrations are calculated from the baseline fluorescence intensities of the samples and are used to generate annealing curves against a concentration × time (Cot) value. Sequence diversity (bottom) is calculated from the annealing curve. To estimate the number of sequences in a sample, the Cot value of the sample is divided by the Cot value measured for a standard of known clonal diversity.
In developing AmpliCot, we needed to the accommodate four ways that PCR products differ from the sheared genomic DNA traditionally used in Cot analysis. First, because PCR provides only a small amount of material to study, we developed a homogenous assay that uses a fluorescent double-stranded DNA-binding dye, SYBR Green, to measure the annealing kinetics of nanogram quantities of DNA. Second, PCR products often contain heteroduplexes and single-stranded DNA, which can confound kinetic measurements. To obtain a PCR product in wholly homoduplex form, therefore, the PCR reaction is diluted, amplified for a few cycles in exponential phase, and then treated with exonuclease I to remove excess single-stranded product3. Third, PCR products share end sequences and thus, to ensure that only homoduplexes can form, must be hybridized under more stringent conditions than those traditionally used for Cot analysis. Fourth, sequences in a PCR product are present in varying amounts. Cot values are traditionally measured at the 50% annealing point, but sensitivity for rare sequences in the mixture is improved by reading the curves at higher annealing points, as close to completion as possible.
AmpliCot annealing curves as diversity measurements
To validate AmpliCot, we created templates of known diversity from a library of 96 individually synthesized oligonucleotides. AmpliCot could indeed measure the diversity of these templates (Fig. 2). Whereas classical Cot analysis measures ‘complexity’, defined as the number of different nucleotides in the sequence, AmpliCot measures ‘diversity’, defined as the number of different full-length sequences in a PCR product. The annealing rates of the samples decreased as the diversity of their templates increased (Fig. 2a). Replotting these annealing data in reciprocal form yielded linear plots, as expected from second-order kinetics (Fig. 2b). Two methods of quantifying the annealing curves—the 50% annealing time point (known as the ‘Cot1/2 value’) and the inverse slopes of the kinetic plots—yielded measurements that correlated linearly with template diversity (Fig. 2c).
Figure 2.

Measurement of sequence diversity with hybridization kinetics. (a,b) Annealing curves of PCR products amplified from templates of differing sequence diversity in equimolar ratio, as acquired (a) and after reciprocal transformation (b). (c) Two AmpliCot measurements, the 50% annealing time point known as the ‘Cot1/2 value’ and the slope of the reciprocal annealing curve, correlate linearly with template diversity. (d) AmpliCot annealing curves for samples containing sequences of equal or unequal abundance: a single sequence, a pool of 96 sequences in equimolar ratio, and a mixture of these two samples. (e) Kinetic plot of the beginning of the annealing curves in d, showing a transition between the abundant and rare components of the mixed sample.
To determine whether AmpliCot could measure the diversity of rare sequences in the presence of an abundant sequence, we used the oligonucleotide library to prepare a sample containing a single sequence, a sample containing 96 sequences in equimolar amounts, and an unbalanced sample composed of a 1:1 mixture of the other two samples (thereby containing 96 sequences, with 1 sequence present at 100 times the copy number of the other 95). Reading the annealing curves close to completion (for example, at 80% annealed) facilitated measurement of the full sequence diversity of the unbalanced sample, despite the presence of the high-copy sequence (Fig. 2d,e).
Applying AmpliCot to the measurement of TCR diversity
AmpliCot can be used to measure the diversity of expressed TCR gene rearrangements in a T-lymphocyte sample by analyzing the diversity of sequences encoding the CDR3 region of the receptors. The CDR3 region, comprising 30 nucleotides on average, encompasses the junction of the recombined variable (V), diversity (D) and joining (J) segments of the gene. It encodes the binding specificity of the receptor and is useful as a sequence tag to identify uniquely a given TCR gene rearrangement4. We measured the sequence diversity of the β chain of the TCR heterodimer, which has greater sequence diversity than the α chain and is more amenable to PCR analysis5–8.
Using cDNA rather than genomic DNA as a PCR template permitted enrichment of expressed TCR gene rearrangements in the template and excluded nonproductive TCR gene rearrangements from analysis. To ensure that the diversity of cDNA in the samples was a reasonable representation of the diversity of the cells being studied, we verified that different subpopulations of lymphocytes contained similar numbers of TCR transcripts per cell and that dilution steps in the protocol did not artificially reduce the diversity of TCR transcripts in the sample (Supplementary Fig. 1 online).
To avoid excessive dilution of the RNA sample, our protocol used a specific V primer and a universal C primer that enabled a whole V family of TCR β genes to be amplified in one PCR reaction. Unfortunately, the resulting VC amplicon was too long to allow hybridization conditions that selected for homoduplex formation (Fig. 3a). By contrast, a VJ amplicon was short enough to allow heteroduplexes and homoduplexes to be differentiated by melting temperature. We therefore designed a nested amplification protocol.
Figure 3.

Monitoring hybridization stringency. (a) cDNA from 5 × 10⁵ mouse mononuclear cells was amplified with a V and C primer set (top) or a V and J primer set (bottom), stopping in exponential phase to obtain homoduplex products. Melting curves were generated either directly after PCR (broken) or after the PCR products were denatured and reannealed at 70 °C to allow heteroduplexes to form (unbroken). Filled and open triangles indicate homoduplex and heteroduplex peaks. (b–d) Assessment of hybridization stringency for VJ amplicons with a Tm of 87 °C. (b) Melting curves of samples either melted or unmelted after PCR and then incubated at different temperatures. Peaks in the shaded areas are artifacts from annealing of leftover single-stranded DNA after the incubation. (c) Nondenaturing PAGE of PCR products stained with SYBR Green. (d) Kinetic analysis of annealing at different temperatures. Fss, fraction of single-stranded DNA.
In theory, too many amplification cycles might decrease the diversity of the final PCR product, owing to the loss of sequences that are amplified less efficiently. Instead, we found that allowing the VC amplification to go to completion produced a more diverse final VJ product (as measured by AmpliCot) than if the amplification was stopped at an early point (data not shown). This increased diversity may result because rare sequences are preferentially amplified during the final cycles of a PCR reaction that is allowed to go to completion9,10.
VJ amplicons distinguish between closely related TCRs
Heteroduplex formation during the annealing experiment could lead to underestimation of the diversity of a sample. To study this effect, we annealed aliquots of an identical amplicon either at the usual stringent temperature (83 °C in this example) or under less stringent conditions (temperature <83 °C). We measured the degree of heteroduplex formation by comparing each annealed sample to an unmelted reference incubated under the same conditions. We chose a moderately complex template derived from 105 splenic lymphocytes to allow annealing to progress to completion without extensive melting of the reference.
Four observations suggested that the hybridization conditions used achieved adequate stringency to distinguish matches from mismatches. First, melting curve analysis (Fig. 3b) showed that the sample reannealed at high stringency (83 °C) was indistinguishable from the unmelted reference11. Second, nondenaturing gel electrophoresis (Fig. 3c) showed that homoduplex bands were equivalent between the sample and the reference after high-stringency annealing (83 °C)12. As the annealing conditions became less stringent, the migration of the PCR product was retarded, an indication of heteroduplex formation.
Third, inverse plots of the annealing kinetics at different temperatures (Fig. 3d) showed that the annealing took a linear form at high stringency (83 °C), as expected for second-order kinetics13, and the fluorescence returned to baseline intensity. By contrast, when the same sample was annealed at lower stringency (for example, at 74 °C and 77 °C), there was an early, fast increase in fluorescence that reached a plateau below the baseline, suggesting that the DNA strands were trapped in heteroduplexes that could not bind as many dye molecules per duplex. The subsequent slow increase in fluorescence in these samples probably represented the conversion of these heteroduplexes into homoduplexes that could bind more dye.
Fourth, melting temperature calculations suggested that heteroduplexes should not form under the annealing conditions used: with an amplicon of ~60 nucleotides, two mismatches should decrease the melting temperature of a heteroduplex by >3 °C, and any two independently generated TCR genes are likely to differ from each other at more than two nucleotide positions14. Although some heteroduplexes may form when complex PCR products are annealed, the results of titration experiments (see below) suggest that the assay can measure increasing diversity—up to thousands of different sequences—as the input diversity increases.
AmpliCot measures TCR diversity
For a titration experiment, samples containing the same total number of cells with increasing ratios of T cells to non–T cells were prepared from the spleen of a single mouse. The samples were simultaneously analyzed with AmpliCot and with Immunoscope, the most commonly used existing technique to measure TCR repertoire diversity4. Immunoscope, also known as Spectratyping, is a qualitative technique based on the size distribution of TCR genes amplified with a V and J pair of primers. A smooth or ‘gaussian’ distribution of lengths indicates a diverse sample, whereas a ragged distribution indicates a lack of diversity.
When more T cells were present in the sample, AmpliCot measured greater TCR diversity, as expected (Fig. 4a). The relationship appeared roughly linear with small sample sizes and then leveled off at ~2,000 V4J1-1 sequences (corresponding to ~400,000 total β chain sequences) once the input reached 106 T cells. Analysis of several samples containing more than 5 × 10⁶ cells from other mice confirmed this trend (data not shown). This plateau could be a measurement of the diversity of the sample or merely a limit of the ability of the assay to measure diversity. To distinguish between these possibilities, we prepared samples totaling 2.5 × 10⁶ splenic T cells from three single donors and compared them with samples of the same total number of cells mixed from the three donors. The assay measured more diversity in the mixed sample than in single-donor samples, suggesting that the plateau represents the true diversity present in populations of splenic T cells. In addition, this plateau value is in good agreement with estimates of TCR diversity derived from sequencing2. By contrast, Immunoscope did not distinguish the diversity of samples containing more than 8,000 T cells (Fig. 4b–d).
Figure 4.

Titration of input diversity. (a) AmpliCot measurements of V4J1-1 TCRβ chain diversity. This VJ pair is used in ~0.5% of splenic T cells. Samples containing increasing numbers of T splenocytes were tested, with non-T splenocytes added to maintain a constant number of either 0.5 or 1 million total cells per sample. Diversity was also measured for two samples of 2.5 × 10⁶ T splenocytes from single mice or from a mixture of three mice. The right y axis shows the Cot1/2 value for each sample in traditional concentration × time units. Sequence diversity was estimated by normalizing to Cot1/2 values for a clonal standard, as shown on the left y axis. Error bars represent the s.d. (n = 4); P = 0.009 (one-tailed t-test). (b–d) Immunoscope electropherograms, performed on the same samples shown in a with the same V and J primer sequences, for 8,000 (b), 16,000 (c) and 500,000 (d) T splenocytes.
AmpliCot was applied to the analysis of TCR repertoire in two other samples where previous sequencing experiments have provided expected results. First, the TCR repertoire of memory T cells was compared with that of naive T cells. Because memory cells are expanded from selected clones of the naive population, the TCR repertoire of memory cells should be less diverse than that of naive cells. Naive cells had a TCR diversity corresponding to approximately one sequence per cell, whereas memory cells had a TCR repertoire that was significantly less diverse (Fig. 5a). Second, AmpliCot was used to compare the TCR repertoire of wild-type mice and mice lacking terminal deoxynucleotidyl transferase (TdT)15. This enzyme is responsible for adding non-templated nucleotides at junctional sites during VDJ recombination, and its absence is known to be associated with a TCR repertoire that is less diverse16. The AmpliCot assay showed good reproducibility in duplicate cell pellets from the same mouse (intra-assay coefficient of variation (c.v.) of 11%) and confirmed that the TdT knockout mice have a significantly less diverse repertoire (Fig. 5b). AmpliCot also showed reasonable interassay variability, with a c.v. of 21% (Supplementary Fig. 2 online).
Figure 5.

Validation of AmpliCot with samples previously studied with sequencing methods. (a) Relative sequence diversity of the V4J1-1 combination was measured for 105 sort-purified naive (CD8+CD44loCD62Lhi) and memory (CD8+CD44hiCD62Lhi) splenic T cells from three mice. The approximate number of T cells with the V4J1-1 rearrangement in a sample of this size is 500. The y axis shows the approximate receptor diversity calculated by normalization to a Cot value measured for a clonal standard. Error bars denote the s.d.; P = 0.05 (two-tailed t-test). (b) Relative sequence diversities were measured for a V4J1-1 PCR product amplified from two samples of 5 × 10⁶ splenic mononuclear cells from each of seven TdT knockout and seven wildtype C57BL/6 mice. There are ~5,000 V4J1-1 T cells in a sample of this size. Because mice that lack this enzyme have shorter receptor genes, their PCR products melt at temperatures lowered by 0.8 °C on average. The annealing temperature was therefore reduced for the TdT knockout samples so that it would remain at Tm −3 °C. The two measurements for each mouse are plotted as a single point on the graph; perfectly reproducible results would fall on the diagonal. The intra-assay c.v. was 11%. The repertoire diversities of wild-type and TdT knockout mice are significantly different: P < 0.0001 (two-tailed t-test).
Finally, to simulate the common situation in which a sample contains many rare lymphocyte specificities mixed together with a few expanded ones, we looked at the effect of mixing sorted memory cells together with sorted naive cells. AmpliCot detected the full diversity of the unexpanded naive population in this situation (Fig. 6).
Figure 6.
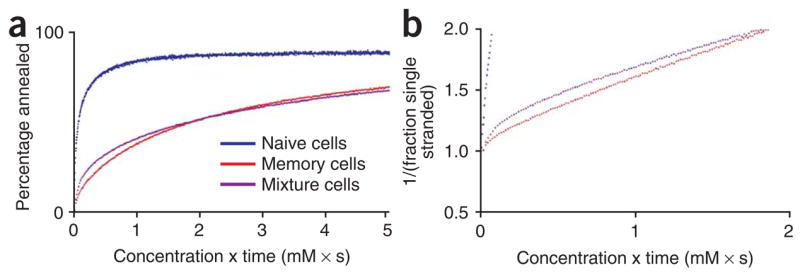
Effect of expanded lymphocyte clones on AmpliCot measurements of TCR repertoire. Lymphocyte samples were prepared containing ~4 × 10⁵ CD8+CD44hi memory cells, 8 × 10⁵ CD8+CD44loCD62Lhi naive cells or a mixture of 8 × 10⁵ CD8+CD44loCD62Lhi naive cells spiked with 4 × 10⁵ CD8+CD44hi memory cells to simulate the presence of clonal expansions. (a) Annealing curves for V4J2-1 PCR products. Reading the annealing curves close to completion (for example, at 80% annealed) allows measurement of the full sequence diversity of the mixed memory and naive sample, despite the presence of the expanded clones in the memory pool. (b) Kinetic plot of the beginning of the same annealing curves, showing a transition between the abundant and rare components of the mixed sample.
Erratum: Labels for Naive and Memory cells are reversed in this figure.
DISCUSSION
AmpliCot is an automated assay that is inexpensive, rapid and quantitative. It will render the measurement of TCR sequence diversity practical and affordable for the first time. Our validation of the method used mouse samples to minimize the effects of genetic and environmental variation, but AmpliCot can be used to evaluate the TCR diversity of T-cell subpopulations from any species for which the genomic sequences of the TCR genes are known. Indeed, human TCR genes have longer CDR3 regions than do mouse TCR genes and are therefore easier to resolve2.
Although titration experiments suggest that its measurements correlate well with changes in sample diversity, AmpliCot might still underestimate the true sequence diversity found in a sample. First, as with any PCR-based method for measuring TCR diversity, care must be taken to ensure that all TCR sequences in the T-cell sample are represented in the PCR product. An additional complication for AmpliCot is that, because it requires a short amplicon, the primers used might fail to amplify some TCR genes with extensive deletions in the V or J region. Second, AmpliCot is affected by the distribution of sequences in the mixture and may undercount rare sequences. This problem is not unique to AmpliCot: sequencing approaches will also undercount rare sequences if too few clones are sequenced. We confirmed that different T-cell subpopulations have generally similar expression of the TCR mRNA. Continuing the first-round PCR reaction to saturation enriches the rare sequences in the product9,10, and reading the annealing curves as close to completion as possible maximizes the detection of rare sequences. Third, the experimental conditions are unlikely to be stringent enough to resolve very closely related sequences, such as those that differ by only one or two nucleotides. Independently generated TCR sequences, however, are likely to differ from each other by more than this amount.
Nucleic acid assays have a unique capability to measure global immune receptor diversity, but they have several limitations. First, although TCRs function as αβ heterodimers, most genetic assays have focused on β chain diversity. Except for unusual circumstances (such as transgenic mice expressing an invariant β chain), it is technically difficult to study the pairing of α and β chain gene sequences17. Second, the genetic diversity of these receptors is several steps removed from their functional diversity: two genes with different nucleotide sequences may encode identical receptor proteins, and two receptors with different amino acid sequences may have similar binding specificities. It is likely, however, that there is a correlation between nucleotide sequence diversity and binding specificity diversity. Third, genetic studies of receptor diversity do not give any information about the functional state of the cells being studied (such as whether they are activated, anergic or regulatory); this issue could be addressed by performing the genetic assay on sorted cell populations. Despite the limitations of nucleic acid–based analysis of TCR diversity, it is difficult to foresee any other method measuring the full diversity of the immune repertoire. Protein- and cell-based assays require a priori selection of the antigens being studied and also require that the cells responding to the antigen be present at relatively high frequency. For example, Elispot or intracellular cytokine staining studies using peptide pools can measure specificity to, at most, hundreds of antigenic peptides; high-throughput tetramer-binding assays can test, at most, thousands of peptide–major histocompatibility complex pairs at a time18.
Relatively few genetic techniques have been used to measure the global diversity of the TCR repertoire (in contrast to the many methods that detect clonal expansions within the repertoire). These techniques fall into two broad groups. The first group estimates repertoire diversity through the directed sequencing of a small fraction of the repertoire2,6. Unlike these sequencing-based methods, AmpliCot can directly examine large fractions of the repertoire at a time, including all clones, both rare and expanded, within that fraction. The second group relies on equilibrium hybridization (usually in association with limiting dilution)19–21. These hybridization methods have not been shown to have adequate stringency to allow discrimination between matched and mismatched receptor sequences. In addition, methods based on limiting dilution of individual clones make the problematic assumption that all clones are represented at equal frequencies in the repertoire.
AmpliCot is an automated, homogeneous assay: dozens of samples may be processed per day and each costs little more than the price of a PCR reaction. There is likely to be substantial variation in repertoire diversity, as there is in most biological measurements, but AmpliCot will facilitate the analysis of enough samples to enable studies of immune repertoire diversity to achieve statistical and biological significance. Whereas other methods can barely make order-of-magnitude approximations about repertoire diversity, AmpliCot is sufficiently reproducible, and permits enough replicate measurements to be made, to detect less than twofold changes in diversity. Although the assay itself seems reasonably reproducible, it remains to be seen how stable an individual’s diversity is over time and to what extent the diversity in one V or J family predicts the diversity of the whole repertoire. Another issue to be addressed is the proper denominator for diversity measurements: per million lymphocytes, per milliliter of blood, or per organism? Each one may be important in different circumstances22.
In conclusion, AmpliCot can measure PCR product diversity conveniently and economically, facilitating the study of sequence diversity in biology and medicine. In addition to measuring the diversity of TCRs and other receptor types, AmpliCot may be useful in charting the diversity, evolution and epidemiology of viruses and bacteria, in discovering polymorphisms for genetic studies, and in determining genetic mutation rates. In fields such as genomics, combinatorial chemistry, in vitro evolution and DNA computing that use complex DNA sequence libraries23–25, AmpliCot might be used to measure the true (rather than the theoretical) diversity of a library and to measure the efficiency of the selection processes that it undergoes.
METHODS
Automated fluorescence measurement
Fluorescence measurements were made with an Opticon real-time PCR machine (Bio-Rad) calibrated biweekly with a fluorescein standard. We mixed 50-μl PCR samples with 12.5 μl of annealing buffer concentrate (final concentrations of the annealing reaction were 20 mM MOPS (pH 7.5), 0.03% Brij 700, 250 mM NaCl, 10 mM EDTA and 5× SYBR Green; Invitrogen). We determined the melting temperature (Tm) of 10 μl of each sample and then placed 25-μl aliquots of each sample on both sides of a 96-well plate (HSP-9655, Bio-Rad) as the annealing sample and reference. We measured baseline fluorescence at the annealing temperature (generally, Tm − 3 °C). By using the gradient feature of the PCR machine, samples on the right side were melted for 2 min at 95 °C, while the left side references remained unmelted to control for the decay of fluorescence over time. Samples were returned to the annealing temperature and allowed to anneal from 1 h to overnight; fluorescence measurements were made every 5–20 s, depending on the sample diversity. We checked wells for bubbles before the run and for evaporation afterwards.
Readings from melted samples were normalized to readings from the corresponding unmelted references. We calculated the percentage of sample annealed at each time point by taking the normalized pre-melt baseline fluorescence as 1 and the normalized fluorescence during the 95 °C melt as 0. We generated Cot curves by plotting the percentage of sample reannealed versus concentration × time. We estimated the concentration of each sample by subtracting the fluorescence intensity during the melted state (95 °C) from the baseline fluorescence reading before melting.
AmpliCot analysis of TCR genes
RNA was prepared by an RNeasy mini kit (Qiagen) using an elution volume of 30 μl; yields averaged 1–2 pg of total RNA per cell, as assessed with a spectrophotometer (Nanodrop). Capillary electrophoresis of representative samples obtained with this procedure showed intact rRNA bands on a bioanalyzer (Agilent). cDNA was synthesized from 14 μl of the RNA sample in a 20-μl reaction, using dT16 and MMLV reverse transcriptase (NEB) at 37 °C for 60 min. We used 4 μl of the cDNA as a template in a 100-μl first-round PCR reaction with a V4-specific primer and a universal C primer26, and SYBR Green master mix (MCLab). PCR consisted of 40 cycles of a combined annealing/extension step of 1 min at 60 °C, followed by a final extension of 10 min at 72 °C. We further amplified 0.5 μl of the first-round PCR product in a 50-μl PCR reaction using the same V4 primer and a J1-1 primer. Primer positions were chosen to be far enough from the edges of the V and J segments to allow amplification of TCR genes that had substantial exonuclease degradation of these regions during the process of VDJ recombination, but close enough to allow discrimination between heteroduplexes and homoduplexes by melting temperature. The VJ amplification was monitored in real time in an MJ Opticon (Bio-Rad) and stopped at the end of the exponential phase of amplification (between 9 and 11 cycles, empirically determined). Single-stranded PCR product was digested with 20 units of exonuclease I (NEB) at 37 °C for 60 min, followed by 75 °C for 20 min. Buffer was added, melting curves were checked and annealing kinetics was measured as described above. Sequence diversity was determined by normalizing the Cot1/2 values (in units of milli-molar nucleotide–seconds; mM × s) of the samples to the Cot1/2 value measured for a cloned TCR template.
Additional methods
Information about oligonucleotide sequences, mouse strains, cell sorting, real-time PCR, nondenaturing gel electrophoresis and Immunoscope is available in Supplementary Methods online. Protocols and additional information are available from the authors’ website (http://amplicot.ucsf.edu).
Supplementary Material
Note: Supplementary information is available on the Nature Methods website.
Acknowledgments
We thank C. Stoddart, T. Liegler and K. Shokat for use of equipment; G. Chkhenkeli and N. Sapitan for assistance with mice; P. Harbury, M. Chamberlin, L. Hood, R. Britten and members of The J. David Gladstone Institutes for discussions; and J. Oksenberg, E. Delwart, C. Barker and laboratory colleagues for comments on the manuscript. The work was supported in part by grants from the US National Institutes of Health (including AI47062 and AI43864 to J.M.M.), and was conducted while P.B. was a Pfizer Postdoctoral Fellow. J.M.M. is a recipient of the Burroughs Wellcome Fund Clinical Scientist Award in Translational Research and the NIH Director’s Pioneer Award Program, part of the NIH Roadmap for Medical Research (funded through grant number DPI OD00329).
Footnotes
COMPETING INTERESTS STATEMENT
The authors declare that they have no competing financial interests.
References
- 1.Britten RJ, Kohne DE. Repeated sequences in DNA. Science. 1968;161:529–540. doi: 10.1126/science.161.3841.529. [DOI] [PubMed] [Google Scholar]
- 2.Casrouge A, et al. Size estimate of the αβ TCR repertoire of naive mouse splenocytes. J Immunol. 2000;164:5782–5787. doi: 10.4049/jimmunol.164.11.5782. [DOI] [PubMed] [Google Scholar]
- 3.Thompson JR, Marcelino LA, Polz MF. Heteroduplexes in mixed-template amplifications: formation, consequence and elimination by ‘reconditioning PCR’. Nucleic Acids Res. 2002;30:2083–2088. doi: 10.1093/nar/30.9.2083. [DOI] [PMC free article] [PubMed] [Google Scholar]
- 4.Pannetier C, et al. The sizes of the CDR3 hypervariable regions of the murine T-cell receptor β chains vary as a function of the recombined germ-line segments. Proc Natl Acad Sci USA. 1993;90:4319–4323. doi: 10.1073/pnas.90.9.4319. [DOI] [PMC free article] [PubMed] [Google Scholar]
- 5.Pannetier C, Even J, Kourilsky P. T-cell repertoire diversity and clonal expansions in normal and clinical samples. Immunol Today. 1995;16:176–181. doi: 10.1016/0167-5699(95)80117-0. [DOI] [PubMed] [Google Scholar]
- 6.Arstila TP, et al. A direct estimate of the human αβ T cell receptor diversity. Science. 1999;286:958–961. doi: 10.1126/science.286.5441.958. [DOI] [PubMed] [Google Scholar]
- 7.Garboczi DN, et al. Structure of the complex between human T-cell receptor, viral peptide and HLA-A2. Nature. 1996;384:134–141. doi: 10.1038/384134a0. [DOI] [PubMed] [Google Scholar]
- 8.Garcia KC, et al. An αβ T cell receptor structure at 2.5 Å and its orientation in the TCR-MHC complex. Science. 1996;274:209–219. doi: 10.1126/science.274.5285.209. [DOI] [PubMed] [Google Scholar]
- 9.Suzuki MT, Giovannoni SJ. Bias caused by template annealing in the amplification of mixtures of 16S rRNA genes by PCR. Appl Environ Microbiol. 1996;62:625–630. doi: 10.1128/aem.62.2.625-630.1996. [DOI] [PMC free article] [PubMed] [Google Scholar]
- 10.Mathieu-Daude F, Welsh J, Vogt T, McClelland M. DNA rehybridization during PCR: the ‘Cot effect’ and its consequences. Nucleic Acids Res. 1996;24:2080–2086. doi: 10.1093/nar/24.11.2080. [DOI] [PMC free article] [PubMed] [Google Scholar]
- 11.Ririe KM, Rasmussen RP, Wittwer CT. Product differentiation by analysis of DNA melting curves during the polymerase chain reaction. Anal Biochem. 1997;245:154–160. doi: 10.1006/abio.1996.9916. [DOI] [PubMed] [Google Scholar]
- 12.Shen DF, Doukhan L, Kalams S, Delwart E. High-resolution analysis of T-cell receptor β-chain repertoires using DNA heteroduplex tracking. J Immunol Methods. 1998;215:113–121. doi: 10.1016/s0022-1759(98)00066-0. [DOI] [PubMed] [Google Scholar]
- 13.Yguerabide J, Ceballos A. Quantitative fluorescence method for continuous measurement of DNA hybridization kinetics using a fluorescent intercalator. Anal Biochem. 1995;228:208–220. doi: 10.1006/abio.1995.1341. [DOI] [PubMed] [Google Scholar]
- 14.Britten RJ, Davidson EH. Hybridization strategy. In: Hames BD, Higgins SJ, editors. Nucleic Acid Hybridisation: a Practical Approach. IRL; Oxford: 1985. pp. 3–15. [Google Scholar]
- 15.Gilfillan S, Dierich A, Lemeur M, Benoist C, Mathis D. Mice lacking TdT: mature animals with an immature lymphocyte repertoire. Science. 1993;261:1175–1178. doi: 10.1126/science.8356452. [DOI] [PubMed] [Google Scholar]
- 16.Cabaniols JP, Fazilleau N, Casrouge A, Kourilsky P, Kanellopoulos JM. Most α/β T cell receptor diversity is due to terminal deoxynucleotidyl transferase. J Exp Med. 2001;194:1385–1390. doi: 10.1084/jem.194.9.1385. [DOI] [PMC free article] [PubMed] [Google Scholar]
- 17.Arstila TP, et al. Diversity of human αβ T cell receptors. Science. 2000;288:1135. doi: 10.1126/science.288.5469.1135a. [DOI] [PubMed] [Google Scholar]
- 18.Soen Y, Chen DS, Kraft DL, Davis MM, Brown PO. Detection and characterization of cellular immune responses using peptide-MHC microarrays. PLoS Biol. 2003;1:429–438. doi: 10.1371/journal.pbio.0000065. [DOI] [PMC free article] [PubMed] [Google Scholar]
- 19.Wagner UG, Koetz K, Weyand CM, Goronzy JJ. Perturbation of the T cell repertoire in rheumatoid arthritis. Proc Natl Acad Sci USA. 1998;95:14447–14452. doi: 10.1073/pnas.95.24.14447. [DOI] [PMC free article] [PubMed] [Google Scholar]
- 20.Naylor K, et al. The influence of age on T cell generation and TCR diversity. J Immunol. 2005;174:7446–7452. doi: 10.4049/jimmunol.174.11.7446. [DOI] [PubMed] [Google Scholar]
- 21.Ogle BM, et al. Direct measurement of lymphocyte receptor diversity. Nucleic Acids Res. 2003;31:e139. doi: 10.1093/nar/gng139. [DOI] [PMC free article] [PubMed] [Google Scholar]
- 22.Cohn M, Langman RE. The immune system: a look from a distance. Front Biosci. 1996;1:318–323. doi: 10.2741/a134. [DOI] [PubMed] [Google Scholar]
- 23.Halpin DR, Harbury PB. DNA display I. Sequence-encoded routing of DNA populations. PLoS Biol. 2004;2:E173. doi: 10.1371/journal.pbio.0020173. [DOI] [PMC free article] [PubMed] [Google Scholar]
- 24.Ellington AD, Szostak JW. In vitro selection of RNA molecules that bind specific ligands. Nature. 1990;346:818–822. doi: 10.1038/346818a0. [DOI] [PubMed] [Google Scholar]
- 25.Adleman LM. Molecular computation of solutions to combinatorial problems. Science. 1994;266:1021–1024. doi: 10.1126/science.7973651. [DOI] [PubMed] [Google Scholar]
- 26.Glusman G, et al. Comparative genomics of the human and mouse T cell receptor loci. Immunity. 2001;15:337–349. doi: 10.1016/s1074-7613(01)00200-x. [DOI] [PubMed] [Google Scholar]
Associated Data
This section collects any data citations, data availability statements, or supplementary materials included in this article.
Supplementary Materials
Note: Supplementary information is available on the Nature Methods website.