

Abstract
Microtubules are cylindrical polymers found in every eukaryotic cell. They have a unique helical structure that has implications at both the cellular level, in terms of the functions they perform, and at the multicellular level, such as determining the left–right symmetry in plants. Through the combination of an atomically detailed model for a microtubule and large-scale computational techniques for computing electrostatic interactions, we are able to explain the observed microtubule structure. On the basis of the lateral interactions between protofilaments, we have determined that B lattice is the most favorable configuration. Further, we find that these lateral bonds are significantly weaker than the longitudinal bonds along protofilaments. This explains observations of microtubule disassembly and may serve as another step toward understanding the basis for dynamic instability.
Keywords: Microtubule, tubulin, Poisson-Boltzmann, molecular modeling
Microtubules are key constituents of the cytoskeleton and are involved in numerous cellular functions. These filaments are constructed from heterodimers of α- and β-tubulin, which assemble into polar, linear protofilaments that form a closed tube. The structure of these polymers is key to their function–the linear protofilaments provide a uniform substrate for motor protein movement, whereas the helical structure makes the polymers more rigid. Despite this rigidity, these tubular polymers are not static structures; microtubules undergo periods of growth and sudden collapse termed dynamic instability (Mitchison and Kirschner 1984). As well, although many of the details are not yet understood, it is clear that the microtubule helix affects microtubule growth and interactions leading to higher-order asymmetries such as those observed in many plants (Thitamadee et al. 2002). The basic structural properties (the number of protofilaments, the radius of the tube, the helical pitch, etc.) have been well determined by electron microscopy (Chretien et al. 1995; Chretien and Fuller 2000). However, until recently, there was no detailed information about how these structures assemble and form tubes. The atomically detailed structure of tubulin has been solved (Nogales et al. 1998) and further refined (Lowe et al. 2001), and this structure was used together with low-resolution EM data to derive models for a microtubule (Nogales et al. 1999; Meurer-Grob et al. 2001; Li et al. 2002). The availability of atomically detailed structures makes it possible to investigate microtubule properties using computational means. Our goal in this study is to use such techniques to elucidate some of the factors controlling microtubule structure and stability.
Results
The starting point for these calculations was the microtubule model of Meurer-Grob et al. (2001). We used a group of five dimers in two neighboring protofilaments and incrementally translated one protofilament along the microtubule axis in order to produce different dimer offsets or helical pitches (Fig. 1 ▶). To estimate the binding affinity between the protofilaments, we used a combination of Poisson-Boltzmann calculations, to capture both Coulombic and polar desolvation energies, and a surface area term to account for apolar contributions to binding (Fig. 2 ▶). The combination of these two terms allows us to determine the relative binding-free energy of each configuration. We began with a subunit rise of zero, a configuration in which the dimers would form a ring in the microtubule, and slid the protofilaments in 2 Å increments until a second ring conformation was obtained at roughly 80 Å displacement. The most favorable energy configuration was observed at a subunit rise of around 8–9 Å, with a second, less favorable minima at 52 Å. To decompose the interaction energies within the microtubule lattice, we chose a set of four neighboring dimers in the B lattice configuration (Fig. 3 ▶). Using the same techniques as before, we found that longitudinal bonds along the protofilaments were ~7 kcal/mole stronger than between the protofilaments.
Figure 1.

The binding-free energy between two protofilaments as a function of the subunit rise between adjacent dimers. The protofilament on the right was translated down the protofilament axis in 2 Å steps, starting with a subunit rise of 0 Å and finishing with 80 Å. The top shows four selected configurations (from left to right), the starting configuration; the B lattice, the most favorable configuration at 8–9 Å; the A lattice, a secondary minimum at 52 Å; and the final configuration at 80 Å. The α monomers are in blue and the β monomers are purple. The view is from the outside of the microtubule with the + end at the top.
Figure 2.

Decomposition of the graph in Figure 1 ▶ showing the relative contributions to the binding-free energy by the electrostatic and surface area terms as a function of the subunit rise.
Figure 3.
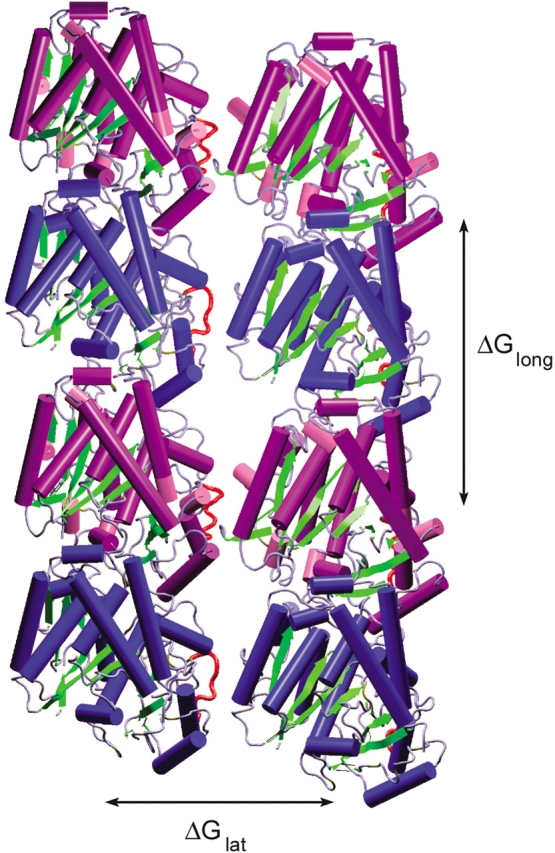
Four dimers in the B lattice used to calculate the lateral and longitudinal-binding energies. The α monomers are in blue, the β monomers are purple, and the M loops (residues 279–287) are shown in red. The difference in binding energies is ΔGlong–ΔGlat ≈ −7 kcal/mole. When the M loop is removed, there is no change in the longitudinal-binding energy, but the lateral-binding energy is weakened by ~1 kcal/mole.
Discussion
Figure 1 ▶ illustrates the binding energy between neighboring protofilaments as a function of the subunit rise. The minimum energy conformation occurs at a value of 8–9 Å, a conformation that corresponds to the B lattice. This value of 8–9 Å is in excellent agreement with observations in a wide variety of microtubules (Chretien and Fuller 2000), and the fact that it is the lowest energy configuration supports the finding that the B lattice is the predominant form found in vitro (Song and Mandelkow 1993). The second minimum in Figure 1 ▶ at 52 Å corresponds to a displacement of one subunit height (~42 Å) above the global energy minimum offset (8–9 Å). This second energy minimum corresponds to the experimentally observed A lattice as well as the seam, a discontinuity found in microtubules with an odd start number helix (Kikkawa et al. 1994). This seam is the point in the microtubule lattice in which two protofilaments align such that an α monomer meets a β monomer (Fig. 4 ▶). Whereas microtubules can be produced under laboratory conditions with 12–17 protofilaments and helices with start numbers between 2 and 5, microtubules in living cells usually have 13 protofilaments and a 3-start helix in which the monomers align α-α-α-. . . and β-β-β-. . . along the 3′ helix. Because the start number of this helix is odd, there must always be a seam in these microtubules. The lateral binding energy at this seam is slightly less favorable, and hence, an ideal 13-protofilament microtubule will have a B lattice structure except at the seam, where the subunit rise is closer to 52 Å or the A lattice.
Figure 4.

Views of the microtubule lattice as viewed from the outside of a 13-protofilament 3-start microtubule for both the A and B lattices. The 3-start designation means that after one complete turn around the microtubule, the helix ends up three monomers above its starting position. For the A lattice, this means that the helix is continuous, whereas for the B lattice, there is a discontinuity or seam. The protofilament configuration at the seam is exactly the same as the A lattice, with a subunit rise of around 52 Å.
It is important to notice that the helical structure results only from the combination of electrostatic and apolar contributions. Because the two monomers are structurally homologous, the A and B lattices have similar amounts of buried surface area; however, the difference in electrostatic interactions appears to break this symmetry and make the B lattice the favored conformation (Fig. 2 ▶). As pointed out at the onset, these calculations were based on the Meurer-Grob (2001) microtubule structure, but another, higher-resolution structure has since been published by Li et al. (2002). One of the primary differences between the initial Nogales (1999) model and the Meurer-Grob (2001) model was the rotation between adjacent protofilaments. Fortunately, the most recent Li (2002) model agrees with the model used in our calculations, although it does suggest small conformational changes in dimers that are in a microtubule as opposed to zinc sheets, where the tubulin structure was solved. They find that the most significant structural changes are in helix H6, the H6–H7 loop, and in the M loop. Although our calculations make use of the atomic detail of tubulin, and hence, allow us to observe the subtle differences in the interactions of α and β tubulin, they are not overly sensitive to these atomic details, as they do not explicitly include terms such as van der Waals interactions. Until a higher-resolution tubulin structure becomes available, preferably based on a microtubule instead of a zinc sheet, we are limited to working with the current tubulin structure.
The second set of calculations found that the bonds between dimers within a protofilament were ~7 kcal/mole stronger than the bonds between protofilaments. This finding agrees with estimates from recent modeling (VanBuren et al. 2002), and explains the observation that microtubules undergoing collapse often display ram’s horns, in which the individual protofilaments separate from each other, yet remain intact even after disassembly. To further investigate the lateral bonds between dimers, we separated a pair of dimers into their α and β subunits and examined how each pair contributes to the lateral binding energy. We found that the β subunits contributed twice as much to the lateral-binding energy as the α-α interactions. This is likely due to the combination of several effects. First, the tubulin structure we used was for a dimer stabilized with Docetaxel (Taxotere), a drug very similar to Paclitaxel (Taxol). Although we removed this molecule prior to starting our calculations, the conformation of the M loop (residues 279–287) in the β subunit is likely in a conformation that stabilizes lateral interactions. Second, there are significant differences between the two M loops; residue 284 is an arginine in β and a glutamic acid in α. In the β subunit, R284 makes a favorable contact with E55 on the β subunit of the adjacent monomer. However, the refinement of the original tubulin structure resulted in the loss of residues 35–60 in the α subunit (Lowe et al. 2001). E55 is conserved in the α subunit and, although this residue is not included, we can assume that the interaction of E284 with E55 would further weaken the interactions between α subunits.
We wanted to quantify the contribution of the M loop to lateral interaction energies. When we removed the charges from the M loop in the α monomer, we found no difference in the α–α interactions, likely due to the fact that the α M loop is missing key lateral interactions. However, when the M loop for the β subunit was removed, the lateral-binding energy was weakened by ~1 kcal/mole. Similarly, when we returned to the set of four dimers, we found that removing the M loop charges had a negligible effect on the longitudinal-binding energy, but again weakened lateral binding by ~1 kcal/mole. This change may seem relatively small, but could be sufficient to affect microtubule stability. In the absence of drugs such as Taxol, it is likely that the M loop is free to assume a variety of conformations. If the loops of adjacent dimers were in conformations that weakened lateral interactions, this could have a destabilizing effect and lead to the breaking of lateral bonds and microtubule collapse. It will be interesting to investigate such behavior in further studies and determine whether such an effect could affect microtubule stability and contribute, at least in part, to dynamic instability.
Finally, it is worthwhile to put this work in the context of the broader issue of prediction and evaluation of protein–protein complexes. The protein docking problem involves two components, a search of conformational space and the estimation of interaction energies. We are obviously not performing any search of conformational space, but instead working strictly with predefined protein complexes on the basis of an experimental structure. With respect to calculating interaction energies, Poisson-Boltzmann calculations have been shown to be an accurate method of determining the electrostatic and polar contributions in biomolecular interactions; however, the computational cost of performing such calculations has typically prohibited using this method for fast screening of complexes. The APBS package (see Materials and Methods) greatly accelerates these computations; although using APBS for a full search of conformation space would not be practical for the size of system we are studying here, there is the prospect of using such calculations as part of docking algorithm for smaller protein–protein systems.
Materials and methods
The electrostatic calculations were performed using the package APBS (Baker et al. 2001). The calculation parameters were 0.5 Å grid spacing, solvent and protein dielectrics of 78.54 and 12, respectively, and a monovalent ion concentration of 150 mM. Calculations were run on the NPACI Blue Horizon located at the San Diego Supercomputing Center using 973 meshes on parallel arrays of 18–36 processors. The average time to calculate the electrostatic-binding energy for a single conformation was 35 min, and the accuracy of the energy values is on the order of 5%. The apolar contribution was calculated assuming that each Å2 of solvent accessible surface area that was buried contributed 11 cal/mole to the binding energy, a value consistent with a range of previous estimates (for review, see Sept and McCammon 2001, and references therein). The microtubule model (Meurer-Grob et al. 2001) we used was based on the unrefined tubulin structure. We used this model as our template structure, but replaced the dimers with the refined tubulin coordinates (Lowe et al. 2001). We used CHARMM27 charges and radii for the molecules with protonation states chosen for pH 7.
Acknowledgments
This work was supported by grants from NIH (J.A.M.), Whitaker Foundation (D.S.), NSF (through grants to J.A.M. and the Center for Theoretical Biological Physics), the National Biomedical Computation Resource (NBCR), and the W.M. Keck Foundation. Computer time on the IBM Blue Horizon was through grants from the National Partnership for Advanced Computational Infrastructure (NPACI) and the San Diego Supercomputer Center (SDSC).
The publication costs of this article were defrayed in part by payment of page charges. This article must therefore be hereby marked “advertisement” in accordance with 18 USC section 1734 solely to indicate this fact.
Article and publication are at http://www.proteinscience.org/cgi/doi/10.1110/ps.03187503.
References
- Baker, N., Sept, D., Joseph, S., Holst, M., and McCammon, J.A. 2001. Electrostatics of nanosystems: Application to microtubules and the ribosome. Proc. Natl. Acad. Sci. 98 10037–10041. [DOI] [PMC free article] [PubMed] [Google Scholar]
- Chretien, D. and Fuller, S.D. 2000. Microtubules switch occasionally into unfavorable configurations during elongation. J. Mol. Biol. 298 663–676. [DOI] [PubMed] [Google Scholar]
- Chretien, D., Fuller, S.D., and Karsenti, E. 1995. Structure of growing microtubule ends: Two-dimensional sheets close into tubes at variable rates. J. Cell. Biol. 129 1311–1328. [DOI] [PMC free article] [PubMed] [Google Scholar]
- Kikkawa, M., Ishikawa, T., Nakata, T., Wakabayashi, T., and Hirokawa, N. 1994. Direct visualization of the microtubule lattice seam both in vitro and in vivo. J. Cell. Biol. 127 1965–1971. [DOI] [PMC free article] [PubMed] [Google Scholar]
- Li, H., DeRosier, D.J., Nicholson, W.V., Nogales, E., and Downing, K.H. 2002. Microtubule structure at 8 Å resolution. Structure 10 1317–1328. [DOI] [PubMed] [Google Scholar]
- Lowe, J., Li, H., Downing, K.H., and Nogales, E. 2001. Refined structure of α β-tubulin at 3.5 Å resolution. J. Mol. Biol. 313 1045–1057. [DOI] [PubMed] [Google Scholar]
- Meurer-Grob, P., Kasparian, J., and Wade, R.H. 2001. Microtubule structure at improved resolution. Biochemistry 40 8000–8008. [DOI] [PubMed] [Google Scholar]
- Mitchison, T. and Kirschner, M. 1984. Dynamic instability of microtubule growth. Nature 312 237–242. [DOI] [PubMed] [Google Scholar]
- Nogales, E., Wolf, S.G., and Downing, K.H. 1998. Structure of the αβ tubulin dimer by electron crystallography. Nature 391 199–203. [DOI] [PubMed] [Google Scholar]
- Nogales, E., Whittaker, M., Milligan, R.A., and Downing, K.H. 1999. High-resolution model of the microtubule. Cell 96 79–88. [DOI] [PubMed] [Google Scholar]
- Sept, D. and McCammon, J.A. 2001. Thermodynamics and kinetics of actin filament nucleation. Biophys. J. 81 667–674. [DOI] [PMC free article] [PubMed] [Google Scholar]
- Song, Y.H. and Mandelkow, E. 1993. Recombinant kinesin motor domain binds to β-tubulin and decorates microtubules with a B surface lattice. Proc. Natl. Acad. Sci. 90 1671–1675. [DOI] [PMC free article] [PubMed] [Google Scholar]
- Thitamadee, S., Tuchihara, K., and Hashimoto, T. 2002. Microtubule basis for left-handed helical growth in Arabidopsis. Nature 417 193–196. [DOI] [PubMed] [Google Scholar]
- VanBuren, V., Odde, D.J., and Cassimeris, L. 2002. Estimates of lateral and longitudinal bond energies within the microtubule lattice. Proc. Natl. Acad. Sci. 99 6035–6040. [DOI] [PMC free article] [PubMed] [Google Scholar]