Abstract
The antigen binding fragment (Fab) of a monoclonal antibody (HyHEL-10) consists of variable domains (Fv) and constant domains (CL–CH1). Normal modes have been calculated from the three-dimensional structures of hen egg lysozyme (HEL) with Fab, those of HEL with Fv, and so on. Only a small structural change was found between HEL–Fab and HEL–Fv complexes. However, HEL–Fv had a one order of magnitude lower dissociation constant than HEL–Fab. The Cα fluctuations of HEL–Fab differed from those of HEL–Fv with normal mode calculation, and the dynamics can be thought to be related to the protein–protein interactions. CL–CH1 may have influence not only around local interfaces between CL–CH1 and Fv, but also around the interacting regions between HEL and Fv, which are longitudinally distant. Eighteen water molecules were found in HEL–Fv around the interface between HEL and Fv compared with one water molecule in HEL–Fab. These solvent molecules may occupy the holes and channels, which may occur due to imperfect complementarity of the complex. Therefore, the suppression of atomic vibration around the interface between Fv and HEL can be thought to be related to favorable and compact interface formation by complete desolvation. It is suggested that the ability to control the antigen–antibody affinity is obtained from modifying the CL–CH1. The second upper loop in the constant domain of the light chain (UL2–CL), which is a conserved gene in several light chains, showed the most remarkable fluctuation changes. UL2–CL could play an important role and could be attractive for modification in protein engineering.
Keywords: Immunoglobulin, constant domain, protein interaction, normal mode analysis, affinity
Over the past few decades, a considerable number of experimental studies, such as X-ray and NMR analyses, have been performed to acquire the three-dimensional coordinates of a biopolymer. The X-ray crystal structure of proteins includes very informative features statically; however, as far as the dynamics are concerned, more information will be required. Recently, computer simulation approaches have been performed to study those dynamics. There are two typical approaches that have been applied to study protein conformational dynamics: molecular dynamics calculation (MD) and normal mode analysis (NMA). MD is free from the harmonic approximation; however, it is limited to studying phenomena in the time range of 10−9 sec or faster, and the larger the molecule, the more the time frame is limited.
NMA has been developed as another tool for the study of the dynamic behavior of biologic macromolecules (Levitt et al. 1985). The method includes some limitations, for instance, the harmonic approximation and conventional calculation in vacuo. Levitt et al. (1985) reported that the diffusing water molecules cannot be treated, as they do not move in a harmonic potential well, and that the presence of surrounding water would not be expected to have a major effect. Therefore, exclusion of water molecules in the calculation may not change the conclusion, and can avoid a cost of an additional six degrees of freedom per water molecule. NMA is still useful for understanding protein dynamics, especially for directly describing subtle fluctuations of rigid bodies (Soejima et al. 1999). Moreover, a more important usefulness of NMA is that it might functionally describe collective motions from the normal mode (Brooks and Karplus 1983; Go et al. 1983; Nishikawa and Go 1987; Hayward et al. 1995; Ishida et al. 1998; Jaaskelainen et al. 1998; Miller and Agard 1999; Nojima et al. 2002).
The three-dimensional structures of three monoclonal antibodies, D1.3, HyHEL-5, and HyHEL-10, have been studied during binding to different sites on the surface of hen egg white lysozyme (HEL). The antibodies bind to HEL specifically with six upper loops of variable domains (Fv), termed complementary determining regions (CDRs; Ward et al. 1989; Batra et al. 1990; Fishmann et al. 1991). In addition, the principles of the antigen–antibody binding were explored with mutagenesis around the antigen–antibody interface (Lavoie et al. 1992; Kam-Morgan et al. 1993; Tsumoto et al. 1994, 1996; Sundburg et al. 2000).
In the HyHEL-10 system, the crystal structure of HEL–Fv (PDB code: 1C08), which is a complex of HEL and Fv, had no significant differences from that of HEL–Fab (PDB code: 3HFM), which is a complex of HEL and Fab. However, it was reported HEL–Fv had a one order of magnitude lower dissociation constant than HEL–Fab in the system: HEL–Fab and HEL–Fv had 450 × 108 M−1, 4.2 × 10⁸ M−1, respectively (Smith-Gill et al. 1984; Lavoie et al. 1992; Kam-Morgan et al. 1993; Tsumoto et al. 1994). We focused on the dynamics of HEL–Fab and HEL–Fv, and attempted to explore the difference in the interaction between the antigen and the antibody.
Figure 1 ▶ shows the schematic structure of HEL–HyHEL-10 (Padlan et al. 1989). Fab is composed of the light and the heavy chains (L and H). The heavy chain cut between CH1 and CH2 has only one constant domain of CH1. Each chain folds into two domains: the variable and the constant domains. The variable domains (VL: residues 1–107, VH: residues 1–114) have four upper loops (CDRs and another) and three lower loops (FRs), respectively. The constant domains of each chain (CL: residues 108–214, CH1: residues 115–215) also have three upper (ULs) and three lower (no names) loops, respectively. It has been considered that six CDRs are placed between HEL and Fv for antigen binding. On the other hand, while six FRs and ULs in HEL–Fab are placed between Fv and the constant domain of CL–CH1, these functions are unclear.
Figure 1.
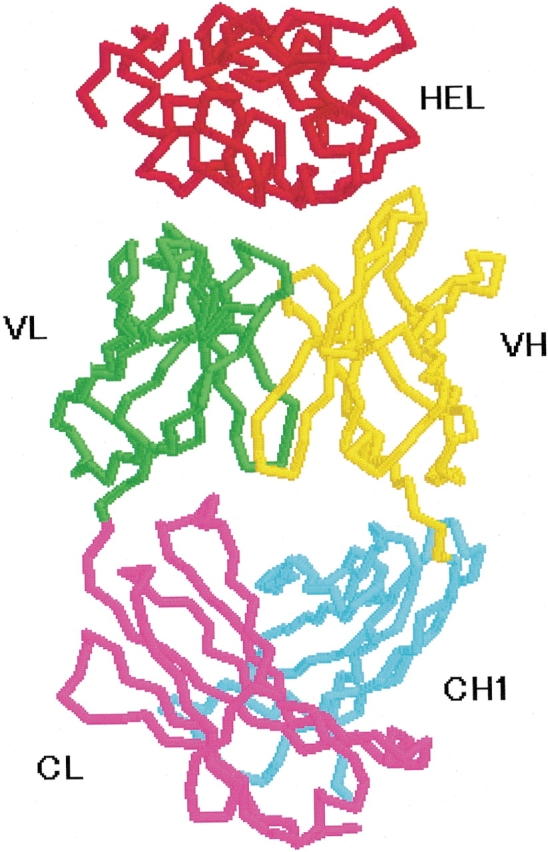
Schematic structure of the HEL–HyHEL-10 complex (PDB code: 3HFM). HEL, red; VL, green; CL, violet; VH, yellow; CH1, cyan. FR1-L(8–17), CDR1-L(24–34), FR2-L(39–44), CDR2-L(50–56), FR3-L(76–83), CDR3-L(89–97), UL1-L(138–144), UL2-L(164–173), UL3-L(198–204), FR1-H(8–17), CDR1-H(31–35), FR2-H(40–44), CDR2-H(50–65), FR3-H(83–90), CDR3-H(95–102), UL1-H(147–152), UL2-H(166–174), UL3-H(197–206).
Results
Comparison of the HEL–Fv structure in each complex
HEL–Fv (1C08) was superimposed onto HEL–Fv of HEL–Fab (3HFM) by a least-squares method around the gravity center of HEL–Fv. The root-mean-square differences (RMSD) of distances between Cα atoms were calculated. VL, VH, and HEL in HEL–Fv show RMSDs of 0.62, 0.63, and 0.47 Å, respectively, for those in HEL–Fab. These results suggest that the overall structure of HEL–Fv is similar to that of HEL–Fab. Interestingly, superimposition of VH around the gravity center of the self-domain and similar superimposition of VL gave RMSDs of 0.55 and 1.03 Å for VH, respectively. The difference of the latter RMSD may be due to the considerable conformational changes in the VH domain.
In addition, 18 water molecules are found around the HEL–Fv interface of the HEL–Fv complex (1C08), while only 1 is found around the interface of HEL–Fab (3HFM).
Fluctuation changes of HEL–Fab in the HyHEL-10 system due to Fab or HEL removal
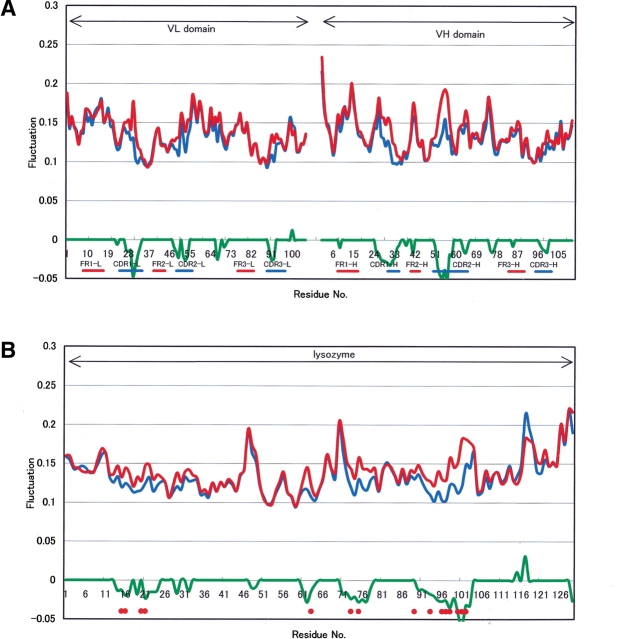
Regarding all frequency modes, Figure 2 ▶ shows the fluctuation profiles of Cα atoms on Fv and HEL in HyHEL-10 complexes. On HEL removal from the complex, the fluctuation changes appeared mainly around all CDRs and another upper loop, whose residue number is around 70, in each chain as shown in Figure 2A ▶. On the other hand, on Fab removal from the complex, the fluctuation changes appeared mainly around epitopes in HEL, as shown in Figure 2B ▶. The above results indicated that the fluctuation changes observed in this study were in the interacting regions between HEL and Fab (Padlan 1977; Padlan et al. 1989; Kondo et al. 1999). Namely, our results show that NMA calculation without water molecules can provide the protein–protein interaction approximately. Hence, NMA may be useful for illustration of protein–protein interactions between the antigen and the antibody, and further suppression of atomic vibration may express stronger protein–protein interaction.
Figure 2.
Fluctuation changes between HEL-Fab and HEL or Fab. (A) Fluctuation changes on Fv between Fab and HEL-Fab. (Red line) Mean fluctuation of six structures of Fab or HEL, (blue line) mean fluctuation of six structures of HEL-Fab, (green line) significance level of 5% by the Wilcoxon Rank Sum Test with six samples of each. (B) Fluctuation changes on HEL between HEL and HEL-Fab. (Thin line) Mean fluctuation of six structures of Fab or HEL, (broken line) mean fluctuation of six structures of HEL-Fab, (thick line) significance level of 5% by the Wilcoxon Rank Sum Test with six samples of each. (Gray circles) Epitopes of HEL (H15, G16, Y20, R21, W63, R73, L75, T89, N93, K96, K97, I98, S100, D101, G102).
Fluctuation changes of HEL and Fv between HEL–Fab and HEL–Fv in the HyHEL-10 system due to CL–CH1 removal
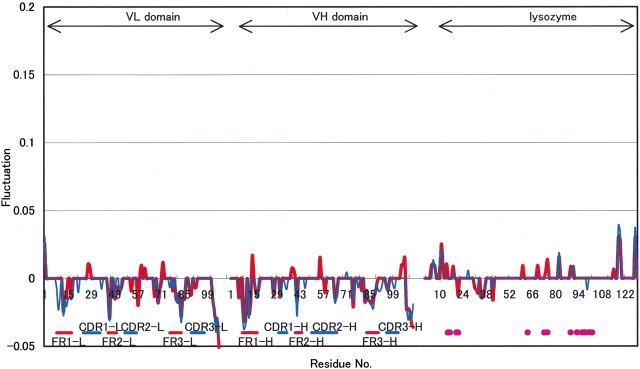
Similar to the above, Figure 3 ▶ shows the Cα atom fluctuation profiles of Fv (Fig. 3A ▶) and HEL (Fig. 3B ▶) between HEL–Fv and HEL–Fab. On CL–CH1 removal from HEL–Fab, the fluctuation changes in Fv appeared around all FRs, CDRs, and so on. The large fluctuation decrement of the terminal regions in Fv is shown in Figure 3A ▶. On the other hand, increases or decreases of the fluctuations in HEL are observed as shown in Figure 3B ▶. Thus, CL–CH1 may have an influence not only on FRs fluctuations at the interface between Fv and CL–CH1, but also on the distant region of the HEL–Fv interface, longitudinally.
Figure 3.
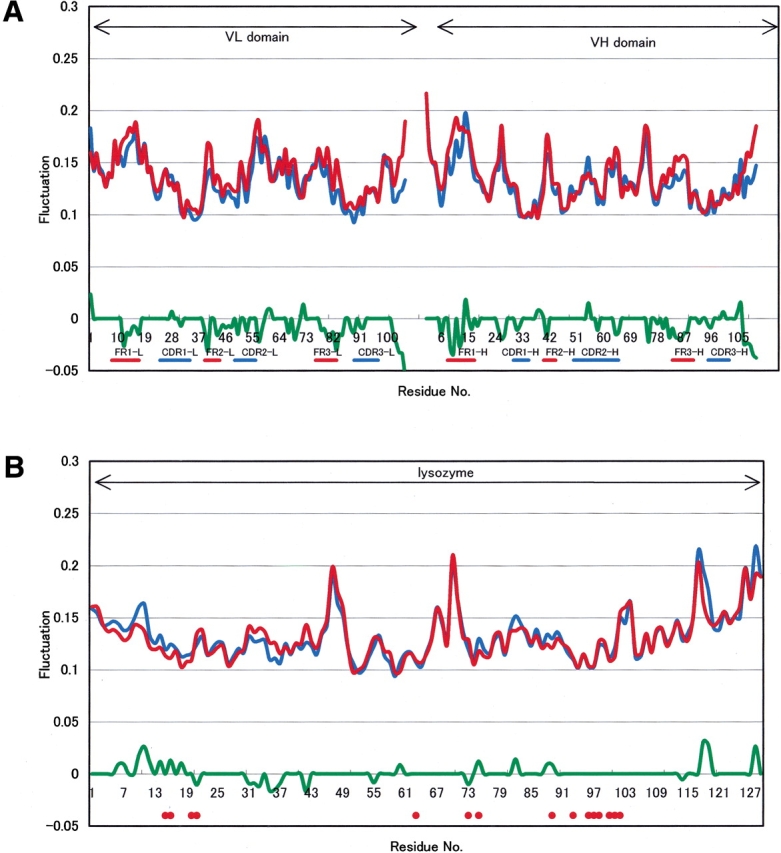
Fluctuation changes between HEL-Fab and HEL-Fv due to CL-CH1 removal. (A) Fluctuation changes on Fv between two complexes. (Red line) Mean fluctuation of six structures of HEL-Fv, (blue line) mean fluctuation of six structures of HEL-Fab, (green line) significance level of 5% by the Wilcoxon Rank Sum Test with six samples of each. (B) Fluctuation changes on HEL between two complexes. (Thin line) Mean fluctuation of six structures of HEL-Fv, (broken line) mean fluctuation of six structures of HEL-Fab, (thick line) significance level of 5% by the Wilcoxon Rank Sum Test with six samples of each. (Gray circles) Epitopes of HEL (H15, G16, Y20, R21, W63, R73, L75, T89, N93, K96, K97, I98, S100, D101, G102).
The fluctuation changes under 50 cm−1 of HEL and Fv are mainly equivalent with the results including all frequency modes (Fig. 4 ▶). Therefore, the fluctuation changes are mainly contributed by the lower frequency modes.
Figure 4.
Fluctuation changes between HEL-Fab and HEL-Fv with frequency modes. (Red line) Significance level of 5% with all frequency modes, (blue line) significance level of 5% under 50 cm−1.
Fluctuation changes of CL–CH1 in the HyHEL-10 system due to HEL–Fv removal
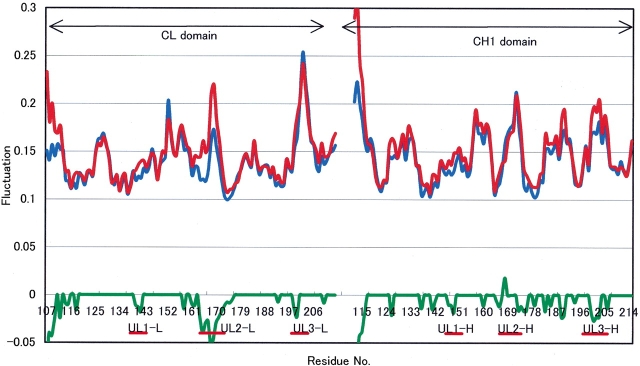
As the constant domains of CL–CH1 may have influence around the interface between HEL and Fv, it is important to consider which part of the CL–CH1 domains contribute to the fluctuation changes. On HEL–Fv removal from HEL–Fab, remarkable fluctuation changes appeared around UL2–CL (Fig. 5 ▶). Therefore, UL2–CL may strongly influence HEL–Fv.
Figure 5.
Fluctuation changes on CL-CH1 between HEL-Fab and CL due to HEL-Fv removal. (Red line) Mean fluctuation of six structures of CL-CH1, (blue line) mean fluctuation of six structures of HEL-Fab, (green line) significance level of 5% by the Wilcoxon Rank Sum Test with six samples of each.
Discussion
It has been reported that NMA can be applied successfully to the exploration of enzyme specificity with molecular vibrations (Miller and Agard 1999). Supposing that NMA results indicate the interaction between polypeptide chains, the vibrational features are useful for illustrating the outline of protein dynamics.
Antigen–antibody binding is mainly thought to be a result of noncovalent interactions. It is compared to the relationship between “a key and a keyhole,” and results in the almost complete desolvation of the interfaces in which hydrophobic clusters, hydrogen bonds, electrostatic interaction, and van der Waals interactions may contribute to the antigen–antibody induced fit (Chothia and Janin 1975; Bhat et al. 1994). An antibody recognizes the antigenic surface with the variable domains, and a favorable interface formation may be necessary for the antigen–antibody binding.
The parts of the schematic structure of HEL–Fv, which are influenced by the CL–CH1 domains, are illustrated in Figure 6 ▶.
Figure 6.
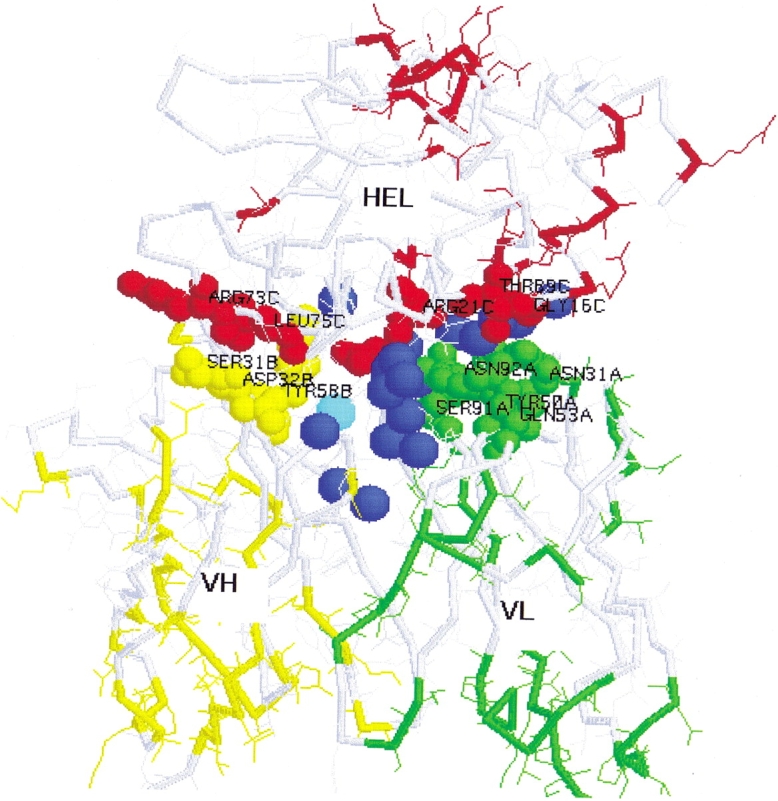
Schematic structure of the parts of HEL-Fv that are influenced by the CL-CH1 domains. Green, orange, and red residues indicate those that are influenced by CL-CH1; green, A chain; yellow, B chain; red, C chain; small spacefill, residues between domains within 5 Å and interactions reported by Padlan et al. 1989 (N31A, Q53A, S91A, N92A, S31B, D32B, Y58B, R14C, G16C, D18C, R21C, R73C, L75C, T89C). (Large blue spacefill) 18 water molecules around the interfaces between HEL and Fv in HEL-Fv (1C08), (large cyan spacefill) a water molecule around the interfaces between HEL and Fv in HEL-Fab (3HFM) superimposed on HEL-Fv (1C08).
Eighteen water molecules are found around the interface between the domains of HEL–Fv (1C08) as described in the Results. These water molecules may occupy the holes and channels around antigen–antibody interfaces. On the other hand, only one water molecule is found around the HEL–Fv interface in HEL–Fab (3HFM), as described in the Results. It can be thought that favorable and compact interface formation by complete desolvation in the case of HEL–Fab is necessary and essential. Most of the water molecules in the HEL–Fv complex (1C08) are closer to VL than VH, and this means that there are more spaces around the HEL–VL interface compared with the HEL–VH interface. Therefore, the VH domain may have higher affinity for HEL than VL. This idea may be consistent with the result that the VH domain has a relatively higher affinity for HEL than VL in the D1.3Fv complex (Ward et al. 1989).
The RMSD results indicated that the three-dimensional structure of HEL-Fab is similar to that of HEL–Fv, although the domain superimpositions are different. Namely, there are tiny but significant conformational changes in the HEL–Fv complex. Considering the fluctuation differences around interfaces between HEL and Fv domains, the removal of constant domains from the HEL–Fab complex may lead to the insertion of water molecules because of the imperfect complementarity.
It was reported that eight water molecules may mediate the stabilization of interaction in the hydrogen bonds formation, and the buried surface area increase was 100 Å2 at the interface in the HEL–Fv complex in comparison with HEL–Fab (Kondo et al. 1999). The increment of the buried surface area means that another induced fit may occur at the antigen–antibody interface compared with the HEL–Fab complex, and such exceptional conformational changes may bring about imperfect complementarity.
It is suggested that CL–CH1 may play important roles in the perfect antigen–antibody complementarity without some water molecules and the large suppression of induced local conformational changes at the antigen–antibody interface.
Kabat et al. compared the sequences of the constant domains of human and mouse immunoglobulin light chains, and predicted that the conserved residues of 160–175 may have unique functions (Kabat et al. 1975). The residues that Kabat et al. focused on correspond to UL2–CL in this study. UL2–CL shows considerable fluctuation changes on HEL–Fv removal, and it is naturally considered that UL2–CL is the most effective region in the CL–CH1 domains at the interface between HEL and Fv. Therefore, UL2–CL may play an important role for longitudinal HEL–Fv interactions.
In the HEL–HyHEL-10 system, we can reach the following conclusions.
First, fluctuation changes may explain antigen–antibody interactions, and the noncovalent interactions can be interpreted with the vibrational features. This is useful for illustrating the local interactions and distant interactions due to tiny dynamic changes.
Second, the constant domains of CL–CH1 may have important functions not only for supporting the variable domains as a framework, but also for conserving the favorable interface between HEL and Fv. Incomplete desolvation around the binding interfaces and excess induced local conformational changes may bring about affinity loss of the protein–protein interaction, and it may be compensated for by the energetically insufficient water-mediated hydrogen bonds formation.
Last, the second upper loop of the CL domain could play an important role in keeping the favorable binding interfaces as distant interactions.
These results have further implications. Regarding protein engineering, our results suggest that the antigen–antibody affinity could be controlled by CL–CH1 mutations without changing the antigen–antibody binding specificity, and, UL2–CL, especially, could be a most attractive region.
HEL–Fab and HEL–Fv complexes have an identical sequence of the Fv region and the RMSD around 0.6 with comparison between HEL–Fv moieties: The binding specificity may be maintained. On the other hand, it was reported that HEL–Fv had one order magnitude lower dissociation constant than HEL–Fab. In the other words, the affinity of HEL–Fv may differ without changing binding specificity, and could be controlled by constant domain mutation.
Materials and methods
The crystal structures of HEL–Fab and HEL–Fv in the HyHEL-10 system are available with pdb codes 3HFM and 1C08, respectively, in the Brookhaven Protein Data Bank (PDB). Supposing that the coordinates of these are preserved after dissociation of the components, the original three-dimensional coordinates can be divided into Fab, Fv, CL–CH1, and so on, according to the situations.
First, energy minimization of the X-ray coordinates was performed with a slightly modified force field of AMBER, and NMA was done with torsion angles (Kamiya et al. 2003). We assumed that the complexes were in vacuo, and that the distance-dependent dielectric constant (r/Å) for electrostatic energy was maintained. The electrostatic potential and van del Waals potential were cut off at 9 Å and were smoothly switched to zero at 10 Å. A threshold of 0.04 kcal/mole Å for the maximal component of the gradients of atoms was used. Six energetically optimized structures on each were obtained under restriction conditions, and these were gradually relaxed near the experimental coordinates. The thermal fluctuations of the atoms were calculated under 300 K (Sumikawa et al. 1998; Soejima et al. 1999; Takeda-Shitaka et al. 1999). Eckart’s condition was applied to obtain the fluctuation of each structure (Eckart 1935). The significance level was calculated on couples of six optimized conformations by Wilcoxon’s rank sum test (Nojima et al. 2002). Refinements of the protein coordinates and applying the statistics may reduce the unexpected effects such as the difference of the X-ray resolution as much as possible.
Acknowledgments
The publication costs of this article were defrayed in part by payment of page charges. This article must therefore be hereby marked “advertisement” in accordance with 18 USC section 1734 solely to indicate this fact.
Abbreviations
Fab, antigen binding fragment of immunoglobulin
Fv, variable domains of immunoglobulin
CL, constant domain of immunoglobulin light chain
CH1, first constant domain of immunoglobulin heavy chain
HEL, hen egg white lysozyme
VH, variable domain of immunoglobulin heavy chain
VL, variable domain of immunoglobulin light chain
CDR, complementary determining region
CDR1-VL, first CDR of the variable domain in the light chain
FR, lower loop as framework region
UL, upper loop of constant domain
Article and publication are at http://www.proteinscience.org/cgi/doi/10.1110/ps.03100803.
References
- Batra, J.K., FitzGerald, D., Gately, M., Chaudhary, V.K., and Pastan, I. 1990. Anti-Tac(Fv)-PE40, a single chain antibody Pseudomonas fusion protein directed at interleukin 2 receptor bearing cells. J. Biol. Chem. 265 15198–15202. [PubMed] [Google Scholar]
- Bhat, T.N., Bentley, G.A., Boulot, G., Greene, M.I., Tello, D., Dall’Acqua, W., Souchon, H., Schwarz, F.P., Mariuzza, R.A., and Poljak, R.J. 1994. Bound water molecules and conformational stabilization help mediate an antigen-antibody association. Proc. Natl. Acad. Sci. 91 1089–1093. [DOI] [PMC free article] [PubMed] [Google Scholar]
- Brooks, B. and Karplus, M. 1983. Harmonic dynamics of proteins: Normal modes and fluctuations in bovine pancreatic trypsin inhibitor. Proc. Natl. Acad. Sci. 80 6571–6575. [DOI] [PMC free article] [PubMed] [Google Scholar]
- Chothia, C. and Janin, J. 1975. Principles of protein–protein recognition. Nature 256 705–708. [DOI] [PubMed] [Google Scholar]
- Eckart, C. 1935. Some studies concerning rotating axes and polyatomic molecules. Phys. Rev. 47 552–558. [Google Scholar]
- Fishmann, T.O., Bentley, G.A., Bhat, T.N., Boulot, G., Mariuzza, R.A., Phillips, S.E., Tello, D., and Poljak, R.J. 1991. Crystallographic refinement of the three-dimensional structure of the FabD1.3–lysozyme complex at 2.5 Å resolution. J. Biol. Chem. 266 12915–12920. [PubMed] [Google Scholar]
- Go, N., Noguti, T., and Nishikawa, T. 1983. Dynamics of a small globular protein in terms of low-frequency vibrational modes. Proc. Natl. Acad. Sci. 80 3696–3700. [DOI] [PMC free article] [PubMed] [Google Scholar]
- Hayward, S., Kitao, A., and Go, N. 1995. Harmonicity and anharmonicity in protein dynamics: A normal mode analysis and principal component analysis. Proteins Struct. Funct. Genet. 23 177–186. [DOI] [PubMed] [Google Scholar]
- Ishida, H., Jochi, Y., and Kidera, A. 1998. Dynamic structure of Subtilisin-Eglin c complex studied by normal mode analysis. Proteins Struct. Funct. Genet. 32 324–333. [DOI] [PubMed] [Google Scholar]
- Jaaskelainen, S., Verma, C.S., Hubbard, R.E., Linko, P., and Caves, L.S.D. 1998. Conformational change in the activation of lipase: An analysis in terms of low-frequency normal modes. Protein Sci. 7 1359–1367. [DOI] [PMC free article] [PubMed] [Google Scholar]
- Kabat, E.A., Padlan, E.A., and Davies, D.R. 1975. Evolutionary and structural influences on light chain constant (CL) region of human and mouse immunoglobulins. Proc. Natl. Acad. Sci. 72 2785–2788. [DOI] [PMC free article] [PubMed] [Google Scholar]
- Kamiya, K., Sugawara, Y., and Umeyama, H. 2003. Algorithm for normal mode analysis with general internal coordinates. J. Comput. Chem. 24 826–841. [DOI] [PubMed] [Google Scholar]
- Kam-Morgan, L.N.W., Smith-Gill, S.J., Taylor, M.G., Zhang, L., Wilson, A.C., and Kirsch, J.F. 1993. High-resolution mapping of the HyHEL-10 epitope of chicken lysozyme by site-directed mutagenesis. Proc. Natl. Acad. Sci. 90 3958–3962. [DOI] [PMC free article] [PubMed] [Google Scholar]
- Kondo, H., Shiroishi, M., Matsushima, M., Tsumoto, K., and Kumagai, I. 1999. Crystal structure of anti-hen egg white lysozyme antibody (HyHEL-10) Fv-antigen complex. J. Biol. Chem. 274 27623–27631. [DOI] [PubMed] [Google Scholar]
- Lavoie, T.B., Drohan, W.N., and Smith-Gill, S.J. 1992. Experimental analysis by site-directed mutagenesis of somatic mutation effects on affinity and fine specificity in antibodies specific for lysozyme. J. Immunol. 148 503–513. [PubMed] [Google Scholar]
- Levitt, M., Sander, C., and Stern, P.S. 1985. Protein normal mode dynamics: Trypsin inhibitor, crambin, ribonuclease and lysozyme. J. Mol. Biol. 181 423–447. [DOI] [PubMed] [Google Scholar]
- Miller, D.W. and Agard, D.A. 1999. Enzyme specificity under dynamic control: A normal mode analysis of α-lytic protease. J. Mol. Biol. 286 267–278. [DOI] [PubMed] [Google Scholar]
- Nishikawa, T. and Go, N. 1987. Normal modes of vibration in bovine pancreatic trypsin inhibitor and its mechanical property. Proteins 2 308–329. [DOI] [PubMed] [Google Scholar]
- Nojima, H., Takeda-Shitaka, M., Kurihara, Y., Adachi, M., Yoneda, S., Kamiya, K., and Umeyama, H. 2002. Dynamic characteristics of a peptide-binding groove of human HLA-A2 class 1 MHC molecules: Normal mode analysis of the antigen peptide-class 1 MHC complex. Chem. Pharm. Bull. 50 1209–1214. [DOI] [PubMed] [Google Scholar]
- Padlan, E.A. 1977. Structural implications of sequence variability in immunoglobulins. Proc. Natl. Acad. Sci. 74 2551–2555. [DOI] [PMC free article] [PubMed] [Google Scholar]
- Padlan, E.A., Silverton, E.W., Sheriff, S., Cohen, G.H., Smith-Gill, S.J., and Davies, D.R. 1989. Structure of an antibody–antigen complex: Crystal structure of HyHEL-10 Fab–lysozyme complex. Proc. Natl. Acad. Sci. 86 5938–5942. [DOI] [PMC free article] [PubMed] [Google Scholar]
- Smith-Gill, S.J., Lavoie, T.B., and Mainhart, C.R. 1984. Antigenic regions defined by monoclonal antibodies correspond to structural domains of avian lysozyme. J. Immunol. 133 384–393. [PubMed] [Google Scholar]
- Soejima, K., Kurihara, Y., Kamiya, K., and Umeyama, H. 1999. Dynamic character of the complex of human blood coagulation factor VIIa with the extracellular domain of human tissue factor: A normal mode analysis. FEBS Lett. 463 19–23. [DOI] [PubMed] [Google Scholar]
- Sumikawa, H., Suzuki, E., Fukuhara, K., Nakajima, Y., Kamiya, K., and Umeyama, H. 1998. Dynamic structures of granulocyte colony-stimulating factor proteins studied by normal mode analysis: Two domain-type motions in low frequency modes. Chem. Pharm. Bull. 46 1069–1077. [DOI] [PubMed] [Google Scholar]
- Sundberg, E.J., Urrutia, M., Braden, B.C., Isern, J., Tsuchiya, D., Fields, B.A., Malchiodi, E.L., Tormo, J., Schwarz, F.P., and Mariuzza, R.A. 2000. Estimation of hydrophobic effect in an antigen-antibody protein–protein interface. Biochemistry 39 15375–15387. [DOI] [PubMed] [Google Scholar]
- Takeda-Shitaka, M., Kamiya, K., Miyata, T., Ohkura, N., Madoiwa, S., Sakata, Y., and Umeyama, H. 1999. Structural studies of the interactions of normal and abnormal human plasmins with bovine basic pancreatic trypsin inhibitor. Chem. Pharm. Bull. 47 322–328. [DOI] [PubMed] [Google Scholar]
- Tsumoto, K., Ueda, Y., Maenaka, K., Watanabe, K., Ogasahara, K., Yutani, K., and Kumagai, I. 1994. Contribution to antibody–antigen interaction of structurally perturbed antigenic residues upon antibody binding. J. Biol. Chem. 269 28777–28782. [PubMed] [Google Scholar]
- Tsumoto, K., Ogasahara, K., Ueda, Y., Watanabe, K., Yutani, K., and Kumagai, I. 1996. Role of salt bridge formation in antigen–antibody interaction. J. Biol. Chem. 271 32612–32616. [DOI] [PubMed] [Google Scholar]
- Ward, E.S., Gussow, D., Griffiths, A.D., Jones, P.T., and Winter, G. 1989. Binding activities of a repertoire of single immunoglobulin variable domains secreted from Escherichia coli. Nature 341 544–546. [DOI] [PubMed] [Google Scholar]


